
ABSTRACT
FT-MIR spectroscopy coupled to chemometrics can be an alternative technique to conventional methods to determine the chemical composition of berries such as strawberry. This study developed chemometric models based on FT-MIR spectroscopy to identify strawberry cultivars at seven stages of ripening and quantify the main attributes involved in sensory quality of strawberry fruits (total soluble solids, total acidity, reducing sugars, pH) and the main bioactive compounds involved in antioxidant capacities (ascorbic acid, phenolics, flavonoids, anthocyanins). PCR, PLS1 and PLS2 algorithms were used to develop the prediction models. PLS1 algorithm developed excellent predictions with Rc2 -greater than 0.90. SIMCA model identified the cultivars with 99% confidence. Unlike conventional methods, FT-MIR allowed us to analyze simultaneously the attributes of quality, bioactive compounds, and antioxidant capacity of strawberries fruits in a fast and reliable way without the use of reagents and/or solvents, which considerably reduces the time and cost of the analyzes.
RESUMEN
La espectroscopia FT-MIR acoplada a la quimiometría puede ser una técnica alternativa a los métodos convencionales para determinar la composición química de bayas como la fresa. Este estudio desarrolló modelos quimiométricos basados en FT-MIR para identificar cultivares de fresa en siete etapas de maduración y cuantificar los principales atributos involucrados en la calidad sensorial de los frutos de fresa (sólidos solubles, acidez total, azúcares reductores, pH) y los principales compuestos bioactivos implicados en la capacidad antioxidante (ácido ascórbico, fenólicos, flavonoides, antocianinas). Los algoritmos PCR, PLS1 y PLS2 se utilizaron para desarrollar los modelos de predicción. El algoritmo PLS1 desarrolló excelentes predicciones con Rc2 superior a 0.90. El modelo SIMCA identificó los cultivares con el 99% de confianza. A diferencia de los métodos convencionales, FTIR nos permitió analizar simultáneamente los atributos de calidad, compuestos bioactivos y capacidad antioxidante de las fresas de una manera rápida y confiable sin el uso de reactivos y/o disolventes, lo que reduce considerablemente el tiempo y el costo de los análisis.
1. Introduction
Strawberries (Fragaria x ananassa Duch.) are cultivated and consumed worldwide. Strawberry fruits contain important amounts of phenolic compounds with beneficial health effects, such as antioxidant, antimutagenic, and anti-inflammatory, among others (Aaby, Mazur, Nes, & Skrede, Citation2012; Pineli et al., Citation2011). Recently, it has been considered necessary to quantify the main attributes involved in the sensory quality of strawberry fruits (such as total soluble solids, total acidity, reducing sugars, pH), as well as the main bioactive compounds involved in the antioxidant capacity (ascorbic acid, phenolics, flavonoids, anthocyanins), because it is a fruit rich in antioxidants and its commercial and economic relevance requires higher quality standards (Aaby et al., Citation2012; Buendía et al., Citation2010; Pineli et al., Citation2011; Ríos de Souza et al., Citation2014; Young-Jun & Youngjae, Citation2015). Nevertheless, to analyze these compounds, spectrophotometric and chromatographic methods are used, which are laborious, costly, time consuming, and use toxic chemical products (Buendía et al., Citation2010).
Nowadays, FT-MIR spectroscopy coupled to chemometrics is an alternative used to analyze quality attributes, bioactive compounds, and antioxidant capacity in foods (Mohamed, Mohamed, Khalil, Hussein, & Kamil, Citation2011; Tamaki & Mazza, Citation2011). Multivariate statistical techniques exhibit advantages over conventional methods because this methodology does not use reagents nor solvents, it is fast and does not require pretreatment of the sample and extraction processes, which leads to a reduction in costs and time of the analyses. Also, FT-MIR spectroscopy coupled to multivariate analysis offers the possibility of analyzing several compounds simultaneously. There are several studies that use FT-MIR spectroscopy coupled to chemometrics to determine quality attributes and chemical composition of fruits, such as apricot, blueberries, grapes, blackberries and apple (Mohamed et al., Citation2011). However, in the revised literature, we did not find studies on strawberries that determine simultaneously the aforementioned compounds by FT-MIR spectroscopy coupled to multivariate analysis. FT-MIR spectroscopy coupled to chemometrics would allow to quickly select the most promising strawberry cultivars for the farmer based on their quality attributes, as well as their bioactive compounds.
Therefore, the objective of this study was to develop an analytical alternative to quantify quality attributes (total soluble solids, total acidity, reducing sugars, pH), bioactive compounds (ascorbic acid, phenolics, flavonoids, anthocyanins), and antioxidant capacity in ten strawberry cultivars in seven ripeness stages by means of FT-MIR spectroscopy coupled to chemometric tools. Also, a SIMCA model was developed to identify and classify the strawberry cultivars.
2. Materials and methods
2.1. Standards and chemicals
All chemicals were of analytical grade. Folin-Ciocalteu’s phenol reagent, 1,1-diphenyl-2-picrylhydracil (DPPH), 2,2ʹ-Azino-bis (3-ethylbenzthiazoline-6-sulfonic acid) (ABTS), 6-hydroxy-2,5,7,8-tetramethylchromane-2-carboxylic acid (Trolox), 3,5-dinitrosalicylic acid (DNS), 3,4,5-Trihydroxybenzoic acid (gallic acid), 2,6-dichlorophenol, indophenol, ascorbic acid, glucose, and catechin were purchased from Sigma Chemical (St. Louis, MO, USA). Sodium acetate, glacial acetic acid, hydrochloric acid, metaphosphoric acid, sodium carbonate anhydrous, aluminum chloride, potassium chloride, sodium hydroxide, methanol, sodium nitrite, potassium persulfate, sodium sulphate, sodium acetate trihydrate, sodium-potassium tartrate, and xylene were acquired from J.T. Baker (Center Valley, PA, USA).
2.2. Samples
The strawberry cultivars (Fragaria x ananassa Duch.) used in this work were harvested in 2018 and were provided by the National Strawberry Council (CONAFRESA, for its initials in Spanish), located in Zamora, state of Michoacán, Mexico (19° 59′ 00″ N, 102° 17′ 00″ W). Ten cultivars (Albión, Camino Real, Celin, Dorado, Dulce Ana, Festival, Fortuna, Osceola, San Andreas, and Spartan) were selected with three replicates per cultivar using the fruits from ten different plants of each cultivar. The fruits were harvested at seven ripeness stages (0–6), as established by the Mexican Norm, NMX-FF-062-SCFI-Citation2002(2002). Each sample was assigned a code of three letters to identify the cultivar and a number to identify the ripeness degree. Afterward, samples were packed in polyethylene bags (portions of 100 g) with a vacuum sealer (Selovac, model 200B, Brazil), and stored in a freezer at −20ºC until analysis. All analyses were carried out within 2 months.
2.3. Chemical composition
Analyses were performed in triplicate. Total soluble solids (TSS) expressed in percentage of TSS (% TSS), were determined with a digital refractometer (Atago, PR-1, Kunzmann) according to NMX-FF-015-Citation1982(1982). Total acidity (TA) was determined by titration of a water extract of strawberry homogenate with 0.1 N NaOH to pH 8.1 (pH meter, Mettler-toledo, Switzerland) based on NMX-FF-010-Citation1982(1982); the results were expressed in percentage of citric acid (% of citric acid). Reducing sugars (RS) were analyzed following the technique described by Miller (Citation1959); glucose standard solutions were used for the calibration curve; results were described in percentage of glucose (% glucose). The pH was determined with a pH meter (Mettler-toledo, Switzerland); results were reported in a numerical scale (Ríos de Souza et al., Citation2014).
2.4. Bioactive compounds
Ascorbic acid content (AAC) was determined using the 2,6-dichloroindophenol Tritimetric method according to AOAC method 967.21 (Citation2002); quantification of ascorbic acid was carried out through a calibration curve prepared by running standard concentrations of ascorbic acid; the results were expressed as milligrams of ascorbic acid per 100 g of fresh weight (mgAA/100 g FW). Total phenolic content (TPC) were estimated according to Singleton and Rossi (Citation1965) with the Folin-Ciocalteau colorimetric method at 760 nm; quantifications were calculated by a calibration curve prepared daily with known concentrations of gallic acid (GA) as a standard; the results were expressed in milligrams equivalent of gallic acid per 100 g of fresh weight (mg EqGA/100 g FW). Total flavonoids content (TFC) was determined according to Tulipani et al. (Citation2011); catechin standard solutions were used for the calibration curve and the absorbance was measured at 510 nm; the results were expressed as milligrams equivalent of catechin per 100 g of fresh weight (mg EqC/100 g FW). The total anthocyanins content (TAC) was determined using a pH differential method (Giusti & Wrolstad, Citation2001). The absorbance at 520 nm and 700 nm was measured and the absorbance at 700 nm was substracted from the absorbance at 520 nm; the results were expressed as milligrams equivalent of cyanidin-3-glucoside per 100 g of fresh weight (mg EqC-3-glc/100 g FW).
2.5. Antioxidant capacity
Total antioxidant capacity was determined in triplicate using the Trolox equivalent antioxidant capacity (TEAC) by means two methodologies: ABTS+ (2,2ʹazino-bis-(3-ethylbenzthiazoline-6-sulphonic acid) assay (Moura et al., Citation2007) and DPPH (1,1- diphenyl-2-picrylhydrazyl) assay (Brand-Williams, Cuvelier, & Berset, Citation1995). Aqueous standard dilutions of Trolox (6-hydroxy-2,5,7,8-tetramethylchromane-2-carboxylic acid) were used for calibration, and the results were expressed as micromoles equivalent of Trolox per 100 g of fresh weight (µmoles EqT/100 g FW).
2.6. Statistical analysis
The values of TSS, TA, RS, pH, AAC, TPC, TFC, TAC, TEAC-ABTS and TEAC-DPPH were analyzed through one-way ANOVA and Tuckey multiple comparisons of means (p ≤ 0.05). Before developing the chemometric models, a principal component analysis (PCA) was performed to know the relation among variables. Moreover, a Pearson correlation was performed to find a correlation between the analyzed compounds and the ripeness stage of the analyzed samples. For the analysis, the Minitab version 16.1.0 software (State College, PA, USA) was used.
2.7. FT-MIR spectra
FT-MIR spectra were recorded in a model GX FTIR spectrophotometer (PerkinElmer®, Massachusetts, USA), equipped with an attenuated total reflectance (ATR) and a selenide zinc (ZnSe) crystal (model 022-12xx, PerkinElmer®, Massachusetts, USA) with a 45° incidence angle and a deuterated triglycine sulfate (DTGS) detector. Data acquisition was achieved with the Spectrum software (version 5.3.1. PerkinElmer®, Massachusetts, USA).
FT-MIR spectra were obtained in the 4000-550 cm−1 region with 64 scans, resolution of 4 cm−1, in absorbance (A) units. Before obtaining the FT-MIR spectra, the reference spectrum was recorded by reading the empty ZnSe crystal under the same conditions as those of the samples. To obtain the FT-MIR spectra, approximately 3 g of macerated strawberries was placed on the ZnSe crystal, covering the whole crystal and avoiding the formation of bubbles. The FT-MIR spectra were recorded in triplicate with the Spectrum software (version 5.3.1. PerkinElmer®, Massachusetts, USA). A total of 210 FT-MIR spectra were recorded, which were used for the multivariate analysis. After ending each reading, the ZnSe crystal was washed with liquid detergent (Extran®, Merck, Darmstadt, Germany), then, it was rinsed with distilled water and left to air dry.
2.8. Multivariate analysis
2.8.1. Quantitative models
For these models, the Spectrum Quant+ version 4.51.02 software (PerkinElmer®, Massachusetts, USA) was used, which contains the partial least squares (PLS1 and PLS2) and the principal components regression (PCR) algorithms to establish the correlation between the spectral data and the chemical composition values (TSS, TA, RS, pH, AAC, TPC, TFC, TAC) and antioxidant capacity (ABTS and DPPH assays). The regression model was created with 80% of the samples (168 FT-MIR spectra) and the remainder 20% (42 FT-MIR spectra) was used to validate the model.
The spectral pretreatments to improve the prediction of the chemometric model were: spectral smoothing (Savitzky-Golay filter, 19 points), base line correction to avoid changes and/or displacements in it, second derivative (Savitzky-Golay filter, 13 points), and normalization of the variable normal standard (SNV)-type to eliminate or minimize interferences caused by dispersion effects.
The selection of the best model depended on: 1) number of factors (latent variables) for PLS or principal components for PCR, 2) coefficient of determination of calibration (Rc2, must be as close to 1 as possible) and, 3) standard error of calibration (SEC, must be as low as possible). To assess the external validation stage, we analyzed: 1) coefficient of determination of validation (Rv2, must be as close to 1 as possible), 2) the standard error of prediction (SEP, must be as low as possible), 3) Mahalanobis distance (must be lower than 1), 4) residuals relation (must be lower than 3), 5) residual error (must be as low as possible), 6) the relative difference percentage (% RD, must be lower than 10%), and 7) residual predicted deviation (RPD) was calculated for each parameter, RPD is defined as the ratio between the standard deviation of the population (SD) and the SEP, high values of RPD are desirable.
2.8.2. Soft independent modeling of class analogies (SIMCA)
SIMCA is one of the most used analyses in chemometrics because it is a supervised classification method based on PCA that is used to reduce the dimensionality of the set of multivariate data. Thus, SIMCA helps to analyze the similitude or difference among groups of spectra (classes) by constructing a reliable region (confidence level ≥99%) around each class (Kumar, Bansal, Sarma, & Rawal, Citation2014).
With the Assure ID Method Explorer version 4.0.2.0175 software (PerkinElmer®), 10 classes were established: Albión, Camino Real, Celin, Dorado, Dulce Ana, Festival, Fortuna, Osceola, San Andreas, and Spartan. To develop the SIMCA model, 210 FT-MIR spectra were obtained (21 of each class), of these, 168 FT-MIR spectra (80% of the samples) were used to calibrate the model and 42 spectra (20% of samples) were used to validate it. The model was optimized by applying different mathematical pretreatments: baseline correction, spectral smoothing (Savitzky-Golay filter, 19 points), ambient filters (CO2 and H2O), second derivative (Savitzky-Golay filter, 9 points), SNV-type normalization.
To evaluate the performance of the SIMCA model, we analyzed: 1) 3D projection of the classes that allows for the visualization of groupings among classes using the first three principal components; 2) interclass distance between the ten classes, which is an indicator of the similitude of classes, and it should be greater than 3; and, 3) percentage of recognition (sensitivity) and rejection (specificity) of samples, a value of 100% describes a model that differentiates the classes correctly.
3. Results and discussion
3.1. Chemical composition
The results for TSS, TA, RS, and pH in the 10 strawberry cultivars at seven ripeness degrees are presented on Supplementary Figure 1S. TSS content varied from 5.59% in the DAN0 cultivar to 10.73% in SPA6. Flavor is one of the most important attributes in strawberries and is due by TSS, like saccharine, fructose, and glucose, the main sugars contained in this fruit. TA varied from 0.53% in OSC6 to 0.94% in OSC0. The RS content varied from 1.10% in FES0 to 2.89% in OSC6. The RS, represented as glucose percentage, are the main soluble components in strawberries and provide energy for the metabolic changes in the fruit, aside from influencing markedly the flavor of the fruit. The pH varied from 2.87 in CAR0 to 3.89 in DOR6. Values of TSS, TA, RS, and pH showed a significant difference (p ≤ 0.05), because, during ripening of the fruit, the TA diminished, whereas TSS, AR, and pH increased due to enzymatic unfolding of starch, hence, the fruit is sweeter. Likewise, during the ripening process, the concentration of organic acids diminishes, particularly that of the citric acid, which leads to a diminution in TA and an increase in pH. Results of TSS, TA, RS, and pH in the 10 strawberry cultivars under different ripeness degrees coincide with data reported by other authors (Pineli et al., Citation2011; Ríos de Souza et al., Citation2014).
3.2. Bioactive compounds
The results for AAC, TPC, TFC, and TAC in the 10 strawberry cultivars at seven ripening degrees are presented on Supplementary Figure 2S. The AAC varied from 31.87 to 143.30 mgAA/100 g FW in SPA6 and FES0, respectively. The AAC was higher in green (0–1 ripening degree) and rose-colored (2–5 ripening degree) fruits; but AAC diminished in the red fruit (6 ripening degree), this behavior is similar to that observed by Pineli et al. (Citation2011). The aforementioned indicates that in green (0 ripeness) and rose-colored (2–5 ripening degree) fruits, a higher synthesis of AA occurs than in ripe fruits. The TPC varied from 46.30 to 358.02 mg EqGA/100 g FW in FOR6 and CEL0, respectively. The TFC varied from 1.35 to 5.56 mg EqC/100 g FW in FES6 and FES0, respectively. The TPC and TFC is higher in green (0–1 ripeness) and rose-colored (2–5 ripeness) fruits. The least content of these compounds is found in red fruits (6 ripeness degree). This behavior is due to changes in the composition of the fruit occurring during the ripening process. Ferreyra, Viña, Mugridge, and Chaves (Citation2007) observed that the TPC is higher in rose-colored fruits due to the accumulation of anthocyanins which have a typical flavonoid structure, and they are responsible for the characteristic red to purple color of berries (Haminiuk, Maciel, Plata-Oviedo, & Peralta, Citation2012).
Color is an important attribute of strawberries and it is partially defined by the anthocyanins content. TAC in the 10 strawberry cultivars varied from 0.04 to 30.33 mg EqC-3-glc/100 g FW in SPA0 and CAR6, respectively. TAC increased as the degree of ripeness increased, thus, the highest anthocyanins content will be found in ripe fruits. This behavior is in agreement with Pineli et al. (Citation2011) and Aaby et al. (Citation2012), who observed the same tendency in Brazilian and Norwegian strawberries, respectively. The aforementioned is a behavior posed by the ripening process of strawberries, as there is an increase in anthocyanins content as the fruit ripens and gets an intense red color. Kalt, Lawand, Ryan, McDonald, and Donner (Citation2003) suggest that this increment is because anthocyanins are synthetized from the phenolic compounds, leading to a diminution of the latter.
3.3. Antioxidant capacity
Total antioxidant capacity varied, according to the ABTS method, from 553.82 to 1729.57 µmoles EqT/100 g FW in FES6 and SPA0, respectively. According to the DPPH radical, it varied from 345.11 to 1371.60 µmoles EqT/100 g FW in DOR6 and FES0, respectively (Supplementary Figure 3S). The ABTS assay yielded a higher antioxidant capacity, probably because this radical measured the antioxidant capacity of hydrophilic and lipophilic compounds, whereas the DPPH assay only measures that of hydrophobic compounds. Antioxidant capacity is higher in green (0–1 ripeness) and rose-colored (2–5 ripeness) fruits than in red fruits (6 ripeness degree). The latter is because green and rose-colored fruits need a higher amount of antioxidants as they are more susceptible to pests and diseases. Results on the antioxidant capacity agree with those reported by Pineli et al. (Citation2011).
Results of TSS, TA, RS, pH, AAC, TPC, TFC, TAC, TEAC-ABTS and TEAC DPPH in the 10 strawberry cultivars at seven ripeness degrees showed variability (Tukey test, p ≤ 0.05), which is fundamental to build the proposed chemometric models.
3.4. Principal components analysis (PCA)
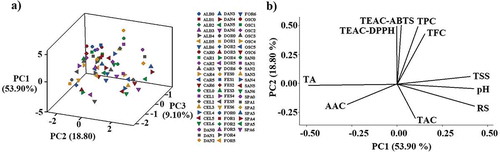
The PCA allowed to examine sample grouping and detect outliers (). The PCA showed that three PC explained 81.80% of the variability of the samples (PC1 53.90%, PC2 18.80% and PC3 9.10%). The 3D scatter plot ()) shows the distribution of the ten strawberry cultivars at seven ripeness stages. The 3D graph does not show clustering effect and the data showed variability, which is fundamental to construct the prediction models. On the other hand, the principal components loading plot ()) shows the correlation between the variables. The PCA developed a graph that represents the loads obtained with the first two principal components, explaining 72.70% of the variability. The first component explains 53.90% of the variability and is associated with TSS, pH and RS; these parameters are related because as the ripening of the fruit progresses, their content increases. The TPC, TFC, TEAC-ABTS and TEAC DPPH are related in such a way that the antioxidant capacity of the fruits can be attributed to TPC and TFC. Some antioxidant compounds (phenolic compounds, flavonoids, and anthocyanins) can be synergistic and even inhibitory. Young-Jun and Youngjae (Citation2015) found a relation of phenolic compounds and flavonoids with the antioxidant capacity, this agrees with the present work because, based on the PCA, the antioxidant capacity of strawberries is related to TPC and TFC. The second component explains 18.80% of the variability and is associated with TA, AAC, and TAC. The TA is located opposed to the pH, because as the fruit ripens, the pH increases and the acidity decrease.
Figure 1. (a) 3D scatter plot of the ten strawberry cultivars at seven ripeness stages, letters and numbers are codes: letters indicate the name of the cultivar and the number the degree of ripeness. (b) Principal components loading plot. TSS: total soluble solids, TA: total acidity, RS: reducing sugars, pH, AAC: ascorbic acid content, TPC: total phenolic content, TFC: total flavonoids content, TAC: total anthocyanins content, TEAC-ABTS: trolox equivalent antioxidant capacity with ABTS assay, TEAC-DPPH: trolox equivalent antioxidant capacity with DPPH assay.
Figura 1. (a) Gráfica de dispersión 3D de las puntuaciones del análisis de componentes principales de los diez cultivares de fresa en siete etapas de madurez, letras y números son códigos: las letras indican el nombre del cultivar y el número el grado de madurez. (b) Gráfico de cargas del análisis de componentes principales. TSS: sólidos solubles totales, TA: acidez total, RS: azúcares reductores, pH, AAC: contenido de ácido ascórbico, TPC: contenido fenólico total, TFC: contenido total de flavonoides, TAC: contenido total de antocianinas, TEAC-ABTS: capacidad antioxidante equivalente de trolox con ensayo ABTS, TEAC-DPPH: capacidad antioxidante equivalente de trolox con ensayo DPPH.
3.5. Pearson’s correlation analysis
reveals the positive correlation of TSS, RS, pH and TAC with the degree of ripeness (r = 0.6561, r = 0.6777, r = 0.3644, and r = 0.9108 respectively), because these compounds increase with the advancing ripeness degree of the fruit. TA shows a negative correlation with the degree of ripeness (r = −0.4478), because, during ripening, there is an increase in TSS, RS, and pH, and a diminution in the TA. The AAC, TPC, TFC, and antioxidant capacity (ABTS and DPPH assays) have a negative correlation with the ripeness degree (r = −0.0759, r = −0.2297, r = −0.3438, r = −0.1659, and r = −0.3486, respectively), suggesting that these compounds diminish with the increasing ripeness degree. Finally, TAC presents a positive correlation coefficient with the ripeness degree (r = 0.9108), because anthocyanins content increase as the fruit ripens. The aforementioned agrees with the results reported by Pineli et al. (Citation2011) and Aaby et al. (Citation2012).
Table 1. Pearson’s correlation for the chemical composition, bioactive compounds, and antioxidant capacity in ten strawberry cultivars at seven ripeness stages.
Tabla 1. Correlación de Pearson para la composición química, los compuestos bioactivos y la capacidad antioxidante en diez cultivares de fresa en siete etapas de madurez.
3.6. FT-MIR spectra
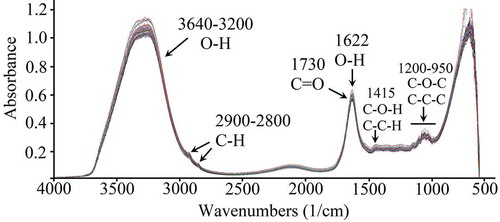
The chemical composition of the strawberry cultivars can be correlated with the FT-MIR spectra of the samples. depicts the FT-MIR spectra of the ten strawberry cultivars at seven ripeness stages. Interpretation of the FT-MIR spectra were made based on the literature (Mohamed et al., Citation2011). The broad band at 3640-3200 cm−1 is due to tension vibrations of the OH bonds of phenolic compounds and water. The band at 3380 cm−1 corresponds to tension vibrations of OH bonds of carbohydrates, organic acids (citric acid) or amino acids (tyrosine). Peaks at 2900-2800 cm−1 are due to tension vibrations of CH bonds of methyl and methylene groups. The band at 1730 cm−1 indicates the presence of ester-type bonds (C = O) such as the ethyl hexanoate, and methyl and ethyl butanoate, which influence the fragrance of the fruit. The region at 1622 cm−1 is due to the deformation movements of the hydroxyl group (OH). The peak at 1415 cm−1 corresponds to the deformation movements of groups OCH, COH, and CCH characteristic of fructose. The region at 1270-1180 cm−1 is due to flexion vibrations of the OH of carboxylic acids and phenolic compounds. The region at 1200-950 cm−1 corresponds to vibrations of the C-O-C bonds present in disaccharides, polysaccharides, and glycosylated anthocyanins. The region at 1045 cm−1 corresponds to vibrations of C-O, C-C-C and the pyranose ring of glucose. Finally, at 927 cm−1, pectin-characteristic balancing vibrations occur.
Figure 2. FT-MIR spectra of the ten strawberry cultivars at seven ripeness stages.
Figura 2. Espectros FT-MIR de los diez cultivares de fresa en siete etapas de madurez.
3.7. Multivariate analyses
3.7.1. Quantitative models
Based on , PLS1 developed the best predictive model by obtaining higher Rc2 values (0.999) and lower values of SEC (0.03–1.05) and SEP (0.03–1.07) as compared to models developed with PLS2 (Rc2: 0.635–0.897, SEC: 0.04–315.73, SEP: 0.05–670.01) and PCR (Rc2: 0.108–0.971, SEC: 0.04–207.51, SEP: 0.05–516-63). Values of Rc2 higher than 0.90 suggest excellent quantitative information, whereas values of 0.81–0.66 represent poorly reliable quantitative predictions (Tamaki & Mazza, Citation2011). SEC and SEP are statistical parameters that evaluate the accuracy with which the calibration and prediction samples adjust to regression; hence, low values, like those obtained for PLS1, correspond to a better adjustment of data. Also, the standard error (SE) of the reference methods was calculated in order to compare the calibrated models obtained. The SE is an important indicator of how accurate an estimate of the population parameter of the statistical sample is; a lower standard error value indicates a more accurate estimate. As seen in , the standard error values were from 0.06 to 1.69, these results confirmed the accuracy of the developed model, because the standard error values were low, very similar to the values of SEC and SEP.
Table 2. Calibration data of the chemometric models to predict the chemical composition, bioactive compounds, and antioxidant capacity in ten strawberry cultivars at seven ripeness stages.
Tabla 2. Datos de calibración de los modelos quimiométricos para predecir la composición química, los compuestos bioactivos y la capacidad antioxidante en diez cultivares de fresa en siete etapas de madurez.
On the other hand, factors represent a significant source of data variations in FT-MIR spectra, so that small values will result in a model without enough information to predict adequately (under- estimated model) and too high values will make the model to have too much information (over-estimated model). Thus, the optimal number of factors is that which provides the lowest SEP () and good prediction results in the validation samples.
There are two versions of PLS: PLS1 and PLS2. PLS1 calibrates properties one by one, and PLS2 calibrates properties simultaneously. In contrast to PLS, PCR uses the properties of decomposing in principal components, performing an inverse multiple regression of the property to be determined on the scores (which reveal differences or similarities among samples) instead of performing it on the original data. PLS is the preferred method in multivariate calibration, hence, it is one of the most common regression algorithms in the field of chemometrics (Karoui, Downey, & Blecker, Citation2010).
presents the statistical predictions data with PLS1. According to Tamaki and Mazza (Citation2011), excellent correlations (Rv2 > 0.91) were obtained between the actual and the predicted values for each parameter. Values of the Mahalanobis distance (≤1), residuals relation (≤3), and residual error (must be as low as possible) comply with established criteria. Also, % RD for all validation samples were lower than 9%; according to Granato and Ares (Citation2014), percentages of RD ≤ 10% are considered excellent. Finally, RPD values ranged from 6.75 to 13.18 for all parameters, according to Williams (Citation2001), RPD values between 3.1 and 4.98 are considered acceptable, between 5 and 6.39 are good, and between 6.4 and 8 are very good for analytical purposes. These results indicated that the model developed with PLS1 performed an excellent prediction.
3.7.2. SIMCA model
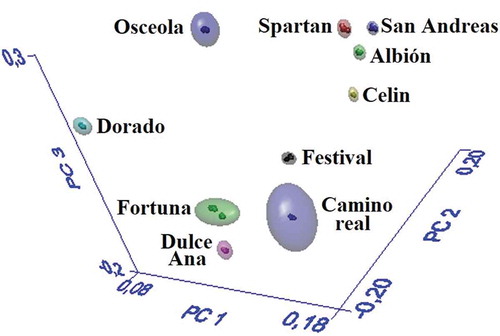
In the SIMCA model, the spectral region between 3500-2800 and 1750-950 cm−1 showed adequate spectral variability to discriminate the ten classes of strawberry. presents the spatial distribution of the 3D modeled classes, consisting of a geometric shape known as hyperbox, hyperspace, or cloud. The limit of hyperboxes around each group represents the 99% confidence level and each point represents one FT-MIR spectrum (sample). According to , the SIMCA model identified the classes in well-defined groups, no extreme or overlapped samples were presented, and therefore, the model was able to identify the 10 strawberry cultivars.
Figure 3. 3D projection of the classes obtained with the SIMCA model.
Figura 3. Proyección 3D de las clases obtenidas con el modelo SIMCA.
The above-mentioned is confirmed by the results depicted on , which present the interclass distance given by the SIMCA model. In the 10 classes, the interclass distance was greater than 3, which indicates that the populations had different spectral characteristics. The interclass distance is the geometrical distance that exists among the hyperboxes and represents the 99% confidence that the sample pertains or not to a class. An interclass distance greater than 3 indicates that the populations were well separated without overlap between the classes. In contrast, an interclass distance lower than 3 indicates that hyperboxes are similar, and a distance equal to 0 indicates that they are identical (Kumar et al., Citation2014).
Table 3. Interclass distance of the different classes derived from the SIMCA model.
Tabla 3. Distancia interclases de las clases derivadas del modelo SIMCA.
Also, the SIMCA model determines the recognition and rejection rates. Recognition (sensitivity) indicates how many samples are recognized as pertaining to a determined class, whereas rejection (specificity) indicates how many samples do not pertain to a determined class. Recognition and rejection rates of 100% were obtained for the ten classes, i.e., if the class that was analyzed was the Albión cultivar, the FT-MIR spectra pertaining to this class were identified as Albion (100% recognition). In contrast, the FT-MIR spectra that do not pertain to the Albión class were rejected (100% rejection). Thus, the model classified samples in the correct category.
External validation results of the SIMCA model indicate that the samples were recognized and classified correctly (). The total distance ranged from 0.07 to 0.87, this value indicates whether the sample was correctly classified (must be lower than 1.0). Residual distance ranged from 0.34 to 1.87, a value higher than 3 indicates that the sample contains a variation source not found previously. External validation confirmed that the SIMCA model is useful and reliable to identify the 10 strawberry cultivars with a 99% confidence.
Table 4. External validation data from the SIMCA model.
Tabla 4. Datos de validación externa del modelo SIMCA.
4. Conclusions
Results indicated that the model developed with PLS1 is useful to predict simultaneously total soluble solids, total acidity, reducing sugars, pH, ascorbic acid, total phenolic content, total flavonoids content, total anthocyanins content, and antioxidant capacity in 10 strawberry cultivars at variable ripeness stages. Likewise, the SIMCA model identified different strawberry cultivars with a 99% confidence. The aforementioned demonstrates that FT-MIR spectroscopy coupled to multivariate analysis provides similar results to those obtained with conventional methods but less costly, more efficiently, and faster (5–10 min), without the use of solvents or long pretreatments of samples. The models developed in this study could be used to analyze in real time the quality attributes and bioactive compounds in different strawberry cultivars. This proposed methodology can be useful for farmers looking to produce strawberry cultivars with better quality attributes and bioactive compounds with health benefits.
Supplemental Material
Download MS Word (286.5 KB)Acknowledgments
Authors thank the Consejo Nacional de la Fresa (CONAFRESA), Consejo Nacional de Ciencia y Tecnología (CONACyT) and the Secretaría de Investigación y Posgrado of the Instituto Politécnico Nacional (SIP-IPN).
Data availability statement
The data used to support the findings of this study are included within the article.
Disclosure statement
No potential conflict of interest was reported by the authors
Supplementary material
Supplemental data for this article can be accessed on the publisher's website.
Related Research Data
References
- Aaby, K., Mazur, S., Nes, A., & Skrede, G. (2012). Phenolic compounds in strawberry (Fragaria x ananassa Duch.) fruits: Composition in 27 cultivars and changes during ripening. Food Chemistry, 132, 86–97. doi:10.1016/j.foodchem.2011.10.037
- AOAC. (2002). Official methods of analysis of AOAC international. Washington, USA: Author. Secs. 967.21.
- Brand-Williams, W., Cuvelier, M. E., & Berset, C. (1995). Use of free radical method to evaluate antioxidant activity. LWT - Food Science and Technology, 28, 25–30. doi:10.1016/S0023-6438(95)80008-5
- Buendía, B., Gil, M., Tudela, J., Gady, A., Medina, J., Soria, C., & López, J. (2010). HPLC-MS analysis of proanthocyanidin oligomers and other phenolics in 15 strawberry cultivars. Journal of Agricultural and Food Chemistry, 57, 3916–3926. doi:10.1021/jf9030597
- Ferreyra, R. M., Viña, S., Mugridge, A., & Chaves, A. R. (2007). Growth and ripening season effects on antioxidant capacity of strawberry cultivar Selva. Scientia Horticulturae, 112, 27–32. doi:10.1016/j.scienta.2006.12.001
- Giusti, M. M., & Wrolstad, R. E. (2001). Anthocyanins. Characterization and measurement of anthocyanins by UV visible spectroscopy. In R. Wrolstad (Ed.), Current protocols in food analytical chemistry (pp. 21–30). New York, NY: Wiley.
- Granato, D., & Ares, G. (2014). Mathematical and statistical methods in food science and technology. New York, NY: Wiley Blackwell.
- Haminiuk, C. W., Maciel, G. M., Plata-Oviedo, M. S., & Peralta, R. M. (2012). Phenolic compounds in fruits-an overview. International Journal of Food Science & Technology, 47, 2023–2044. doi:10.1111/j.1365-2621.2012.03067.x
- Kalt, W., Lawand, C., Ryan, D., McDonald, J. E., & Donner, H. (2003). Oxygen radical absorbing capacity, anthocyanin and phenolic content of highbush blueberries (Vaccinium corymbosum L.), during ripening and storage. Journal of the American Society for Horticultural Science, 128, 917–923. doi:10.21273/JASHS.128.6.0917
- Karoui, R., Downey, G., & Blecker, C. (2010). Mid-infrared spectroscopy coupled with chemometrics: A tool for the analysis of intact food systems and the exploration of their molecular structure-quality relationships-a review. Chemical Reviews, 110, 6144–6168. doi: 10.1021/cr100090k
- Kumar, N., Bansal, A., Sarma, G. S., & Rawal, R. K. (2014). Chemometrics tools used in analytical chemistry: An overview. Talanta, 123, 186–199. doi:10.1016/j.talanta.2014.02.003
- Miller, G. (1959). Use of dinitrosalicylic reagent for determination of reducing sugar. Analytical Chemistry, 31(3), 426–428. doi:10.1021/ac60147a030
- Mohamed, G., Mohamed, S., Khalil, S., Hussein, A., & Kamil, M. (2011). Application of FTIR spectroscopy for rapid and simultaneous quality determination of some fruit products. Natural Science, 9, 21–31.
- Moura, R., Elesbao, A., Sousa de Brito, E., Maia de Morais, S., Goes, S., Pérez-Jiménez, J., & Saura-Calixto, F. (2007). Metodología científica: Determinacao da Actividade Antioxidante Total em Frutas pela Captura do Radical Livre ABTS+. Brazil: Ministério da agricultura, Pecuária e abastecimento. Brazil: Comunicado Técnico 128.
- Norma Mexicana NMX-FF-010-1982. (1982). Productos alimenticios no industrializados para uso humano. Fruta fresca. Determinación de acidez titulable método potenciométrico. Ciudad de México, Mexico: Dirección General de Normas.
- Norma Mexicana. NMX-FF-015-1982. (1982). Productos alimenticios no industrializados, para uso humano. Fruta fresca. Determinación de sólidos solubles totales. Ciudad de México, Mexico: Dirección General de Normas.
- Norma Mexicana. NMX-FF-062-SCFI-2002. (2002). Productos alimenticios no industrializados para consumo humano. Fruta fresca. Fresa (Fragaria x ananassa, Dutch). Especificaciones y método de prueba. Ciudad de México, Mexico: Dirección General de Normas.
- Pineli, L., Moretti, C., Dos Santos, M., Campos, A., Brasileiro, A., Córdova, A., & Chiarello, M. (2011). Antioxidants and other chemical and physical characteristics of two strawberry cultivars at different ripeness stages. Journal of Food Composition and Analysis, 24, 11–16. doi:10.1016/j.jfca.2010.05.004
- Ríos de Souza, V., Pimenta-Pereira, P., Da Silva, T., de Oliveira, L., Pio, R., & Queiroz, F. (2014). Determination of the bioactive compounds, antioxidant activity and chemical composition of Brazilian blackberry, red raspberry, strawberry, blueberry and sweet cherry fruits. Food Chemistry, 156, 362–368. doi:10.1016/j.foodchem.2014.01.125
- Singleton, V. L., & Rossi, J. A. (1965). Colorimetry of total phenolics with phosphomolybdic–Phosphotungstic acid reagents. American Journal of Enology and Viticulture, 16, 144–158.
- Tamaki, Y., & Mazza, G. (2011). Rapid determination of lignin content of straw using Fourier mid-infrared spectroscopy. Journal of Agricultural and Food Chemistry, 59, 504–519. doi:10.1021/jf1036678
- Tulipani, S., Marzban, G., Herndl, A., Laimer, M., Mezzetti, B., & Battino, B. (2011). Influence of environmental and genetic factors on health-related compounds in strawberry. Food Chemistry, 124, 906–913. doi:10.1016/j.foodchem.2010.07.018
- Williams, P. C. (2001). Implementation of near-infrared technology. In P. C. Williams & K. H. Norris (Eds.), Near infrared technology in the agricultural and food industries (pp. 145–169). St. Paul, MN: American Association of Cereal Chemist.
- Young-Jun, K., & Youngjae, S. (2015). Antioxidant profile, antioxidant activity, and physicochemical characteristics of strawberries from different cultivars and harvest locations. Journal of the Korean Society for Applied Biological Chemistry, 58, 587–595. doi:10.1007/s13765-015-0085-z