
 ?Mathematical formulae have been encoded as MathML and are displayed in this HTML version using MathJax in order to improve their display. Uncheck the box to turn MathJax off. This feature requires Javascript. Click on a formula to zoom.
ABSTRACT
Cornelian cherry (Cornus mas L.), a fruit found in Central Europe, is used as a traditional ingredient in fruit preserves. In this study, we analyzed seven cultivars of Cornelian cherry growing in Poland and the differences between them in sugar content, total polyphenol content, and total chlorophyll content. Moreover, we measured the antioxidant potential of Cornelian cherry extracts was also measured. Polyphenols were found to be highest in Słowianin, Wydubieckij and Jolico cultivars. The presented research outcomes were extremely different from the results obtained for the other cultivars of Cornelian cherry. The electrochemical analysis of extracts proved that compounds contained in Cornelian cherry had the reducing against peroxyl radicals, which makes these extracts an important class of nutritional antioxidants. Our study showed that electrochemical assessment can replace the standard colorimetric tests in the evaluation of the antioxidant potential of analyzed compounds.
RESUMEN
La cereza de cornalina (Cornus mas L.), una fruta que se encuentra en Europa Central, se usa como ingrediente tradicional para la elaboración de conservas de frutas. El presente estudio analizó siete cultivares de cerezas Cornus mas que crecen en Polonia, así como las diferencias en el contenido de azúcar, el contenido total de polifenoles y el contenido total de clorofila existentes entre ellas. Además, se midió el potencial antioxidante de los extractos de esta cereza. Se constató que los polifenoles son más abundantes en los cultivares de Słowianin, Wydubieckij y Jolico. Los resultados de esta investigación mostraron la existencia de diferencias muy importantes al compararlos con los resultados obtenidos para los otros cultivares de la cereza de Cornus mas. El análisis electroquímico de los extractos mostró que los compuestos contenidos en dicha cereza disminuyen los radicales peroxilo, lo que hace de estos extractos una clase importante de antioxidantes nutricionales. El estudio reveló que la evaluación electroquímica puede remplazar las pruebas colorimétricas estándar en la evaluación del potencial antioxidante de los compuestos analizados.
PALABRAS CLAVE:
1. Introduction
The Cornus genus includes ~40 species that are found in the natural state in the temperate climate zones. Cornelian cherry (Cornus mas L.) is a cultivated plant species that has attractive and concurrently useful fruits. Note that cornelian cherry can be mostly found as a shrub growing up to 9 m high as well as, although rarely, as a small tree (Czerwińska & Melzig, Citation2018). Cornelian cherry (Cornus mas L.) is recognized as a source of polyphenols, tannins, anthocyanins, and iridoids, all of which are present in both its fruits and leaves (Szczepaniak, Kobus-Cisowska, Kusek, & Przeor, Citation2019; Kucharska, Szumny, Sokól-Letowska, Piórecki, & Klymenko, Citation2015). Cornelian cherry is a plant grown in the Eastern and Southern regions of Europe and the Middle East, where it has been used in domestic cuisines for centuries (Czyżowska et al., Citation2017; Rop, Mlcek, Kramarova, & Jurikova, Citation2010). Cornelian cherry’s edible parts are reddish, oval fruits, sweet, and sour in taste (Kucharska, Sokół-Łętowska, & Piórecki, Citation2011). Cornus mas is regarded as a source of natural radical scavenging anti-inflammatory and anti-toxic agents; however, this potential is deviated by natural causes, i.e. cultivar issue and genetic variation (Cornescu & Cosmulescu, Citation2017; Pantelidis, Vasilakakis, Manganaris, & Diamantidis, Citation2007). The primary substances identified and labeled in Cornelian cherry fruits (which are responsible for their biological activity) are vitamin C, anthocyanins, flavonoids, and iridoids (De Biaggi et al., Citation2018; Kucharska et al., Citation2015). In the literature, the issue of deviation between different Polish cultivars of Cornelian cherry has been examined using standard radical tests (Adamenko, Kawa-Rygielska, Kucharska, & Piórecki, Citation2018; Kostecka, Szot, Czernecki, & Szot, Citation2017; Kucharska et al., Citation2011). There have been no studies about the antioxidant profile analyses of Cornus mas using electrochemical tools and techniques. Electrochemical assays can provide much more consistent and accurate results compared to colorimetric tests (de Macêdo et al., Citation2017; Keyrouz et al., Citation2011). Our aim was to fill this gap and show differences in polyphenols, sugars, and chlorophyll content between the seven cultivars grown in Poland and how these differences affect the antiradical properties of the examined cultivars. The fruit extracts were analyzed in two different solvents, i.e. water and 40% ethanol, to verify the differences in the migration of bioactive compounds during the extraction phase. We conducted standard colorimetric tests, i.e. total phenolic content (TPC), 2,2ʹ-azino-bis(3-ethylbenzothiazoline-6-sulphonic acid (ABTS), and 2,2-diphenyl-1-picrylhydrazyl (DPPH) radicals scavenging together with two separate electrochemical analyses, to verify the similarity between the comparisons performed by our team.
2. Material and methods
2.1. Material
The ripe fruits of Cornelian cherry were harvested in September 2018 in the orchard farm Szynsad in Dąbrówka Nowa, Błędów, Mazowieckie, Poland (51°47′01″N 20°43′04″E). We collected Cornelian cherry in production orchard where the fruit harvest took place from the third year of cultivation. Soil in the orchard was characterized by an average abundance of macronutrients. The approximate value of pH for soil, marked in 1M KCl, was 6.1. The content of humus was 1.1%. The average amount of precipitation in the growing season was 320 mm per square meter, with an average daily temperature of 14.9°C. The fruits of seven cultivars cultivated in Poland: Bolestraszycki, Wydubiecki, Szafer, Jolico, Florianka, Słowianin, and P5. The fruits were stored in refrigerated conditions (cooling temperature = 4°C) until the extracts were prepared.
2.2. Extraction
Cornelian cherry extracts were composed of fresh fruits in which the skin was cut, to allow proper maceration of the plant material. Then fruits were macerated with distilled water or 40% (v/v) ethanol at ratio fresh fruit: extractant 1:5 (w/v) for 30 min at 40°C. Then, the extracts were seeped through paper filters (Alfachem, Poznań, Poland). The prepared extracts were stored in dark tubes until examination at −21°C. Two extractants were chosen in relation to their applicability in food, i.e. aqueous extracts – for the production of functional foods, and ethanol-water extracts – to use as tinctures. As the aqueous extracts are tested in other studies (Popović, Štajner, Kevrešan, & Bijelić, Citation2012; Świerczewska, Buchholz, Melzig, & Czerwińska, Citation2019), in this paper, water as an extractant was taken into consideration. Samples were encoded as follows: BA – cultivar (cv.) Bolestraszycki alcocholic extract; BW-cv. Bolestraszycki aqueous extract; FA-cv. Florianka alcoholic extract; FW-cv. Florianka aqueous extract; SA-cv. Szafer alcoholic extract; SW-cv. Szafer aqueous; PA-cv. P5 alcoholic extract; PW-cv. P5 aqueous extract; XA-cv. Wydubiecki alcoholic extract; XW-cv. Wydubiecki aqueous extract; VA-cv. Słowianin alcoholic ex-tract; VW-cv. Słowianin aqueous extract; CA-cv. Jolico alcoholic extract; CW-cv. Jolico aqueous extract.
2.3. Methods
2.3.1. Total phenolic content
TPC was evaluated according to Cheung et al.’s (Citation2003) method with our some modifications. The tested extract (5 ml) and Folin–Ciocalteau reagent (5 ml; Chempur, Piekary Śląskie, Poland) were added to 50 ml volumetric flasks. Then, the two solutions were mixed for 5 s, followed by the addition of the supersaturated solution of Na2CO3 and NaHCO3 to the homogenized mixture. The sample was incubated in a darkroom for 90 min, and then the liquid was collected by decanting. The analysis was performed using the Specord 40 spectrophotometer (Analytic Jena, Germany), and the absorbance was measured at λ = 765 nm. Each sample was measured six-fold and for each tested extract were conducted three independent measurements. Gallic acid (Sigma-Aldrich, Germany) was used to prepare the calibration curve at five different concentrations: 22.21 mg/ml; 26.65 mg/ml; 31.09 mg/ml; 35.54 mg/ml and 44.42 mg/ml. The standards were measured six-fold. The linearity of the calibration curve (r2) was 0.9523, and the curve was validated using internal cross-validation method. The total average recovery observed was 102.9%. The results were referenced to the dry mass of the extract and expressed in milligrams of gallic acid equivalents (GAE)/100 g dry mass (d.m.).
2.3.2. Antioxidant potential
We determined the inhibition capacity of ABTS radical according to Bartosz’s (Citation2003) methodology with some modifications. After the addition of 980 µl of ABTS solution, its absorbance was measured at λ = 414 nm. Then, 20 µl of the extract was added, and the absorbance of the solution was measured after 40 s. The standard ABTS radical inhibition curve was determined based on Trolox concentration. The linearity (r2) of the calibration curve was 0.9829, and inhibiting capacity of the ABTS radical was defined by the sample absorbance at λ = 414 nm measured at t = 0 s (A’) and the sample absorbance at λ = 414 nm measured at t = 40 s (A), as following Equation 1.
The inhibition capacity of DPPH radical was determined according to Kobus-Cisowska et al.’s methodology (Citation2019) with some modifications. We added. 100 µl of the tested extract to 2.9 ml of 0.1 mM DPPH solution in a tube, and then the sample was mixed on a shaker for 3 s at 1500 rpm, which was deposited in a darkroom for 30 min. The calibration curve was performed based on Trolox solutions, and the linearity of the curve (r2) was 0.9075. The inhibition capacity of the DPPH radical is expressed under Equation 2.
where A′ is the absorbance of the blank sample at λ = 517 nm (measured at t = 0 min), and A is the absorbance of the sample at λ = 517 nm (measured at t = 30 min). The results for tests with ABTS and DPPH were presented as milligrams of Trolox equivalent (TE)/100 g d.m. The radical inhibition activity of DPPH and ABTS was performed using the Metertek SP-450 spectrometer (Metertek, Taiwan).
2.3.3. Total chlorophyll content
Total chlorophyll content (TCC) was determined according to Arnon (Citation1948) and the absorbance spectra were obtained at λ = 652 nm using the Specord 40 spectrophotometer (Analytic Jena, Germany). TCC was calculated according to Equation 3 and expressed in mg/g d.m.
where A652 is the absorbance at a wavelength of 652 nm; V is the total volume of the extract [ml] (the total volume needed to determine the dry matter was 1 ml); and W is the mass of the sample equivalent to dry mass of the extract [g].
All measurement was conducted in threefold repetition.
2.3.4. Semi-qualitative assay of sugars
Sugars were determined by high-performance liquid chromatography (HPLC) on Hitachi-L-2000 Series LaChrom Elite chromatograph (set: automatic sample feeder L-2200, double pump L-2130, refractometric detector RID L-2490 and UV detector L-2400). We used the Rezex ROA Organic Acid H+ (8%)-300 × 7.80 mm column (Phenomenex) for the measurements. We used 0.0225 N H2SO4 as an eluent at an isocratic flow rate of 0.6 ml/min. The measurements were carried out at 30°C. The samples (10 μl) were applied to the column, and quantitative and qualitative identification was conducted using the external standard method, and integration with the measurements of the area under the curve and peak height was performed with the support of EZChrom Elite software (Agilent, USA).
2.3.5. Electrochemical assay
The antioxidant capacity of examined extracts was determined based on the value of the oxidation potentials of the electroactive compounds present in them. It was measured by dissolving the extracts in phosphate buffer (1 M, pH = = 7.0). The determination was carried out according to Filipiak et al.’s method (Citation2001). Voltammetric measurements were performed using PGSTAT12 device with the GPES 4.9 control software (EcoChemie, The Netherlands). The measuring system comprised a reference electrode Ag/AgCl (3 M KCl) (Mineral, Poland), platinum as an auxiliary electrode (Mineral, Poland); and carbon paste as a working electrode (CPE), which was developed according to a previously described procedure (Ligaj, Tichoniuk, & Filipiak, Citation2008). Carbon paste was made by mixing graphite powder with mineral oil (Sigma) in the ratio of 70:30 (w/w). The surface of the CPE electrode was renewed after each measurement by rubbing the outer layer of the paste on tissue paper, and a new paste was applied and polished on a matte microscope slide. The measuring vessel had a diameter of 8 mm and a capacity of 3.5 ml. We added 500 µl of the examined aqueous extract to 500 µl of 0.05 M phosphate buffer with pH 7.0. The measurement cycle included the following stages: activation of the CPE electrode surface in phosphate buffer (60 s with the potential of +1.7 V); immersion of the electrode in the extract (120 s); and voltammetric measurement in the range from −0.6 V to +1.4 V. We performed two independent cyclic voltammetry (CV) and square wave voltammetry (SWV) measurements in three repetitions for each aqueous extract. SWV voltamperograms were smoothed using Savitzky–Golay’s method (Press et al., Citation1992). From all SWV voltamperograms, we subtracted the baselines determined with moving average procedure (n = 3). We then calculated the oxidation and reduction potentials, corresponding to peak heights (currents), peak areas, and total peak areas for each of the extracts, and a new Edm coefficient was determined for CV and SWV measurements:
Furthermore, electrochemical index (EI) for anode peaks measured by CV technique was determined according to Macedo et al.’s (Citation2017) method with the abovementioned modifications. The average potential was assumed for the formula for non-separated peaks with common intensity and area.
2.4. Statistical analysis
We performed a statistical analysis of all the results using Microsoft Excel 2013 software (USA).
For TPC, ABTS, DPPH, and electrochemical tests, principal component analysis (PCA) was conducted to verify the relation between these factors and to present the deviation between the tested cultivars. The electrochemical results were treated as an additional factor to the model based on standard analytical techniques. To calculate PCA model qualitative factors, i.e. defined sample, extractant and cultivar were applied. Moreover, the p values for Levene’s test of independent variables were calculated using Statistica 13 software (StatSoft, Poland).
3. Results
3.1. Scavenging of TPC, ABTS, and DPPH radicals
Based on the current literature on the state of Cornelian cherry properties, the cultivar impact on the antioxidative potential of their aqueous and alcoholic extracts was analyzed. Selected Cornelian cherry cultivars were characterized in terms of TPC (mg GAE/100 g d.m.). The results are presented in . Moreover, we conducted the analyses of the scavenging ability of ABTS and DPPH radicals. The content of polyphenols in Cornelian cherry ranged from 289.69 to 2598.39, mg GAE/100 g d.m. and the highest value measured for was obtained for the alcoholic extract of cv. Jolico (). The other cultivars had significantly lower TPC values compared to cv. Jolico. The mean TPC of all analyzed samples was 839.48 ± 610.14 mg GAE/100 g dm. The poorest in polyphenolic compounds was cv. P5. Moreover, the alcoholic extracts had generally higher TPC values than the aqueous ones. The extracts can be divided into two groups: samples that were not significantly varied (BA, BW, FW, PA, SA, SW, XW, VW, and CW) and other those that varied distinctly.
Table 1. Total phenolic content, ABTS and DPPH radical scavenging ability of tested extracts.
Tabla 1. Contenido fenólico total, capacidad de eliminación de radicales ABTS y DPPH de los extractos probados.
The highest ABTS radical scavenging potential was presented for the aqueous extracts of Słowianin and Szafer cultivars (), and the inhibitory potential was higher for a majority of samples. The mean inhibition rate for all tested samples was 36.759% ± 26.793%. However, presenting ABTS scavenging results in relation to dry mass indicates that the predominant antioxidant properties had cv. Jolico and Słowianin. Moreover, there was no significant difference between the aqueous and alcoholic extracts. Cultivar P5 had the poorest ABTS scavenging properties presented as both TE concentration and percentage of the inhibition ratio. The results for cv. Jolico was significantly different from the average for all tested cultivars ()). All the results obtained for TPC and antiradical activity against ABTS seem to be within the limits of double standard deviation (2σ), except CA sample. Levene’s test results for independent samples indicate a significant relationship between TPC and antiradical activity against the ABTS radical (p = .000980 for α = 0.05). The highest antioxidant activity regarding DPPH radical was noted for the alcoholic extracts of cultivars Jolico and Wydubiecki (). The mean scavenging rate was 72.086 ± 15.009% and gave 2.932 mmol Trolox equivalents/100 g d.m. Alcoholic extract results from cv. Jolico and P5 significantly differ from the other tested cultivars ()). Levene’s test results showed no correlation between the antiradical activity against ABTS and DPPH radical (p = .068474 for α = 0.05). The relationship between total polyphenol content (TPC) and antiradical activity measured for DPPH radical seems to be significant (p = .001004 for α = 0.05).
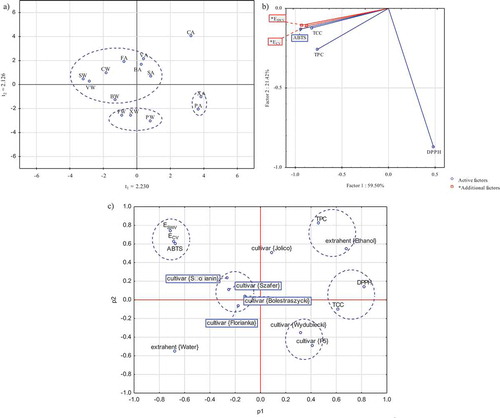
Figure 1. Principal scatter diagram for tested samples (a), principal component analysis for them (b) and statistical charges scatter plot for tested variables (c).
Figura 1. Diagrama de dispersión principal para muestras probadas (a), análisis de componentes principales para tales muestras (b) y gráfico de dispersión de cargas estadísticas para las variables probadas (c).
3.2. Total chlorophyll content
TCC of the extracts tested ranged from 0.073 to 6.281 mg/g of dry matter (). The highest chlorophyll content was found in the alcoholic extract of Wydubiecki cultivar, while the lowest content was found in the alcohol extract of Florianka cultivar. Note that the chlorophyll content was similar for most of the extracts that were studied, except the PA, SA and XA samples which exceeded the average level. Similar to TPC, the relationship between TCC and the inhibition ability of ABTS and DPPH radicals was verified. We found using Levene’s test for independent variables strong statistical relationship between the TPC and antioxidative capacity against DPPH (p = .037801, α = 0.05) while the relation between TCC and antioxidative capacity against ABTS was not significant (p = .617441 α = 0.05).
Figure 2. Total chlorophyll content in tested Cornelian cherry extracts [mg/g dm].
Figura 2. Contenido total de clorofila en extractos de cereza de Cornus mas [mg/g dm].
![Figure 2. Total chlorophyll content in tested Cornelian cherry extracts [mg/g dm].Figura 2. Contenido total de clorofila en extractos de cereza de Cornus mas [mg/g dm].](/cms/asset/262f7560-667e-4c30-b64e-b925a22c8ab0/tcyt_a_1653378_f0002_oc.jpg)
3.3. Semi-quantitative analysis of sugars
In the tested cultivars of Cornelian cherry, we found three reducing sugars: glucose, fructose, and rhamnose. Moreover, glucuronic acid, mannose, and galactose were not detected in the examined samples. The concentration of rhamnose was significantly lower than the concentration of other sugars detected in Cornelian cherry, i.e. it did not exceed 12–30% of all sugars detected in this fruit; however, the share of glucose was the highest and varied from 43% to 50% of the total sugars ().
Figure 3. Content of sugars [%] in Cornelian cherry extracts.
Figura 3. Contenido de azúcares [%] en extractos de cereza de Cornus mas.
![Figure 3. Content of sugars [%] in Cornelian cherry extracts.Figura 3. Contenido de azúcares [%] en extractos de cereza de Cornus mas.](/cms/asset/fa2d8cca-a32f-498c-ac9c-f53acade8ad0/tcyt_a_1653378_f0003_oc.jpg)
3.4. Electrochemical assay
shows the results of CV and SWV electrochemical analyses. The aqueous extracts of Cornelian cherry revealed four clear signal maxima appearing in the forward step (oxidation signals), which were identified on CV voltamperograms. These overlapping signals (current peaks) were located in the potential region from 0.2 to 0.65 V and were characterized by the current values from ~ca. 0.14 to ~ca. 0.67 µA, depending on the cultivar tested. Note that the other measured voltammetric signals had very low intensity, and the location of current peaks originating from the same electroactive analytes may slightly differ because of differences in the pH of extracts, obtained from the quantitatively differentiated set of compounds present in specific cultivars (Kilmartin, Citation2001). The cathodic current (associated with the reduction), we generally detected only one broad signal of low intensity, which was located in the region from −0.1 to 0.5 V. The highest total area of cyclic voltammetry peaks for Cornelian cherry samples relative to dry matter was found in the Słowianin cultivar; however, the lowest number of compounds in the extract volume was reported for the Florianka cultivar. The average value of this coefficient for all Cornelian cherry samples was 238.551 ± 112.123 V*µA/100 g d.m. SWV technique was used to confirm that the Jolico cultivar contains the highest quantity of electroactive components with antioxidant potential, while the P5 cultivar has the lowest concentration of the target components (). The mean value of the Edm coefficient for all tested aqueous extracts was 213.215 ± 96.856 V*µA/100 g d.m. Levene’s test indicates that both electrochemical methods are independent of each other (p= .662349; α = 0.05). Levene’s test outcomes concerning the results from the previous parts of the research show clear relationship between TCC, free radical extinguishing properties, and the Edm parameter (); however, there is no clear relationship for TPC. The data in indicate that the correlation between electrochemical signals measured by SWV technique is clearly dependent on chlorophyll content in the extracts and activity toward ABTS and DPPH radicals, although it is not a strictly linear relationship. PCA analysis shows that both CV and SWV results fit the analytical model based on standard photometric tests ()).
Table 2. CV and SWV peaks heights and areas for tested Cornus mas aqueous extracts and standards.
Tabla 2. Alturas pico y áreas de CV y SWV para extractos acuosos y estándar de Cornus mas.
Table 3. Probability values for Levene’s test of statistical independence (p) and Pearson correlation factor (r2) between total polyphenol count, radical scavenging activities, total chlorophyll count and relative surface of peaks measured using SWV or CV techniques.
Tabla 3. Valores de probabilidad para la prueba de independencia estadística de Levene y factor de correlación de Pearson (r2) en el recuento total de polifenoles, las actividades de eliminación de radicales, el recuento total de clorofila y la superficie relativa de los picos medidos utilizando técnicas SWV o CV.
4. Discussion
The average content of polyphenols is consistent with the data presented in previous studies (Czerwińska & Melzig, Citation2018; Dokhanieh, Aghdam, Fard, & Hassanpour, Citation2013; Jaćimović & Božović, Citation2017). The high content of phenolic acids is confirmed by the results in Kucharska et al. (Citation2011) and Rop et al. (Citation2010) who indicated the TPC content for Szafer and Wydubieckij cultivars at 464.12 mg/100 g fresh mass and 811.00 mg/100 g fresh mass, respectively. shows that the high content of polyphenols in Cornus mas L. influences its high antioxidant properties to varying degrees, depending on the fruit cultivar, which is confirmed by the data presented in ). The antioxidant properties of polyphenols resulted from the presence of -OH groups, which reduces free radicals, as indicated in this study. According to Kobus-Cisowska et al. (Citation2019a, Citation2019b), phenolic compounds in which the hydroxyl group is bound to an aromatic ring with acidic properties show special antioxidant properties, i.e. they easily capture the radical. The resulting free phenolic radical is stable enough (relocation of the radical because of a resonance) and is not able to disconnect the hydrogen atom from another one. However, according to Piekarska, Szczypka, Kucharska, and Gorczykowski (Citation2018), anthocyanins and iridoids contained in Cornelian cherry fruit have a dominant influence on antioxidant properties. Iridoids are a large group of secondary metabolites and belong to the group of cyclopentane monoterpenes with a basic skeleton composed of a ring of cyclopentane and pyran. As reported by Czerwińska and Melzig (Citation2018), iridoids, depending on their structure, show different pharmacological properties, including antibiotic, anti-inflammatory, or hypotensive properties. Furthermore, the studies have shown additionally the existence of statistically significant relationships between TPC and antioxidant capacity for ABTS and between TPC and antioxidant capacity for DPPH.
The capacity is because of the strong polar extraction solvents used in the study and Cornelian cherry contains chemical compounds capable of extinguishing both cationic radicals and inert radicals. Vilano et al. (Citation2007) and Nenadis, Wang, Tsimidou, and Zhang (Citation2004) reported that catechins, phenolic acids, and kaempferol were characterized by the ability to scavenge DPPH radicals; however, the phenolic acids and quercetin have proven the extinction capacity of the ABTS radicals. Despite the big similarity in the substrates involved in the inhibition of these two radicals, their extinction turned out to be independent of each other, which may indicate the fact that other photochemically active compounds were present in Cornelian cherry extracts. As an element of novelty, electrochemical methods were used to evaluate the antioxidant activity of Cornelian cherry extracts. A statistically proven relationship between ABTS radical extinction and TCC can be justified by the presence of iron ions in the tested extracts. Iron ions can form complexes with chlorophyll ring, and thus better catalyze the oxidation of polyphenols. However, chlorophyll shows antioxidant properties that are three times weaker than Trolox (Wang & Wink, Citation2016). This is because of the easy exchange of Mg2+ ions by chlorophyll molecules for ions of other bivalent metals (Kobus-Cisowska, Flaczyk, Rudzińska, & Kmiecik, Citation2014), which may explain the high antioxidant activity determined in the study of free radical tests (). Furthermore, chlorophyll α and β have clearly different reduction and oxidative potentials, which may result in better scavenging of these two radicals (Goedheer, Horreus De Haas, & Schuller, Citation1958).
All the factors tested in PCA ()), excluding DPPH, are in the same part of the chart, that together with the high correlation (r2 values) confirms the dependence of the data tested for these parameters. The location of the DPPH factor on the outside of the graph can be explained by low correlation rate measured between DPPH and the other factors. In the study of Cetkovska et al. (Citation2015), a considerable correlation between TPC and DPPH scavenging capacity (r2 nearly 0.8) was observed. Our research showed that TPC and DPPH are dependent, but weakly correlated, what leads to the final statement that DPPH scavenging is not solely caused by molecules active against Folin-Ciocalteau’s reagent. Furthermore, Cetkovská et al. (Citation2015) measured DPPH scavenging with the use of different analytical technique, i.e. electron paramagnetic spectroscopy, which makes our results not fully comparable.
Chlorophylls and carbohydrates as components of extracts may affect their activity, i.e. they may act synergistically or antagonistically with other components of the extracts. The close statistical distance between ABTS, DPPH scavenging and chlorophyll confirms the Levene’s test results from point 3.3. ). Chlorophyll present in Cornelian cherry fruits may negatively affect the radical scavenging assays, by reoxidizing the radicals. This mechanism can be observed for the majority of samples subjected to DPPH radical scavenging test (). Samples richer in chlorophyll tended to be weaker DPPH scavenging agents, except sample XA.
The basis for the electrochemical determination is the current that is formed during the redox reaction performed nearby the surface of working electrode. The electrochemical analysis of Cornelian cherry extracts showed the dominance of signals related to the oxidation of compounds because of the flow of anode current in the CV voltamperograms. The reduction signals were characterized by peaks with low intensity (low current values) and large width (wide potential range), which indicates that the compounds contained in the extracts or their derivatives obtained by oxidation (associated with the flow of anode current) were not reduced in the reverse scan. This could be because of many factors that have widely discussed Kilmartin’s study (Citation2001) in which detailed protocols for electrochemical analysis of natural antioxidants are presented. A similar phenomenon is observed, inter alia, on CV voltammograms for ascorbic acid in which the oxidation product of ascorbic acid (dehydroascorbic acid) is known to be relatively stable and may be reduced; however, the complete lack of its cathodic peak is observed. The location of current peaks in the region of relatively low potential ranging from 0.2 to 0.6 V (observed on SWV voltammograms) indicates that electroactive compounds contained in Cornelian cherry extracts show a high antioxidant activity. Their reduction potentials are lower than the reduction potentials of biologically damaging peroxyl radicals, and their addition in foods makes them an important class of nutritional antioxidants (Jovanovic, Steenken, Hara, & Simic, Citation1996). The intensity of the current peaks observed for aqueous Cornelian cherry extracts is ten-fold lower than those of de Macedo et al. (Citation2017) for fruit extracts.for because of the possibly different dry mass content of extracts, which is reflected in the concentration of biologically active ingredients in the sample.
The glucose and fructose presence in tested extracts can affect their electrochemical profiles. In Ji et al.’s study (Citation2017), glucose tested using screen printed electrodes possessed two characteristic peaks: the former measured at 0.2 V anodic current and the latter for the cathodic current at 0.3 V. Similar results provided Amani-Beni and Nezamzadeh-Ejhieh (Citation2017) using CPE electrode modified with nanoscale CuO. The glucose peak was recorded in anodic current range of 0.1–0.2 V depending on the scan rate applied. In the cited study, the authors recorded an additional peak at cathodic sweep approx. 0.2 V. Fructose electrochemical signals are similar to signals of glucose, which causes their mutual distinction hardly without modifying the electrode detection layer (Amani Beni, & Nezamzadeh-Ejhieh, Citation2017; Nicolas, Pittson, & Hart, Citation2018). In our study, the over mentioned anodic peak was detected for samples VW, CW and surprisingly for quercetin (), while the cathodic signal was present in all tested samples (also quercetin and gallic acid), except BW and XW.
The examination of electrochemical signals for gallic acid and quercetin standards using the CV technique showed that these compounds could be found in P5 and Wydubiecki cultivars, as well as in Szafer, Słowianin, and Bolestraszycki cultivars, respectively (). The location of peaks measured by SWV confirms the presence of quercetin in Szafer and Słowianin cultivars, indicating the presence of this compound in Florianka cultivar; however, the location of potentials in Bolestraszycki and Jolico cultivars indicates the presence of gallic acid. lists the Pearson correlation factors and shows that the SWV technique represents the standard photometric tests such as TPC, TCC, and ABTS radical scavenging (r2 values 84.95%, 85.49%, and 73.61%, respectively) compared to CV (31.20%, 52.96%, and 64.21%, respectively). In the case of the Folin–Ciocalteau test’s results compared with Levene’s p values indicate that the obtained relations were partially random, while the CV and SWV results set with other factors showed significant dependence.
5. Conclusions
SWV relates well with the following three parameters, i.e. TPC, TCC and ABTS radical scavenging. Relation with these factors was found to be less significant for the CV technique. The electrochemical detection using square wave voltammetry and our novel Edm parameter can effectively replace the abovementioned three methods. Cornelian cherry fruits and extracts obtained from them are potential sources of phenolic compounds and possess high antioxidant activity, which may act positively against oxidative stress and could be a raw material for producing supplements and functional foods.
Declaration of interest statement
We declare no conflict of interest.
Additional information
Funding
References
- Adamenko, K., Kawa-Rygielska, J., Kucharska, A., & Piórecki, N. (2018). Characteristics of biologically active compounds in cornelian cherry meads. Molecules, 23(8), 2024. doi:10.3390/molecules23082024
- Amani-Beni, Z., & Nezamzadeh-Ejhieh, A. (2017). A novel non-enzymatic glucose sensor based on the modification of carbon paste electrode with CuO nanoflower: Designing the experiments by response surface methodology (RSM). Journal of Colloid and Interface Science, 504, 186–196. doi:10.1016/j.jcis.2017.05.049
- Arnon, D. I. (1948). Copper enzymes in isolated chloroplasts. Polyphenoloxidase in Beta vulgaris. Plant Physiology, 24(1), 1–16. doi:10.1104/pp.24.1.1
- Bartosz, G. (2003). Druga twarz tlenu: Wolne rodniki w przyrodzie. [ Second face of oxygen: free radicals in nature.]. Warszawa: Wydaw. Naukowe PWN.
- Cetkovská, J., Diviš, P., Vespalcová, M., Pořízka, J., & Řezníček, V. (2015). Basic nutritional properties of cornelian cherry (Cornus mas L.) cultivars grown in the Czech Republic. Acta Alimentaria, 44(3), 357–364. doi:10.1556/AAlim.2014.0013
- Cheung, L. M., Cheung, P. C. K., & Ooi, V. E. C. (2003). Antioxidant activity and total phenolics of edible mushroom extracts. Food Chemistry, 81(2), 249–255. doi:10.1016/S0308-8146(02)00419-3
- Cornescu, F.-C., & Cosmulescu, S. N. (2017). Morphological and biochemical characteristics of fruits of different cornelian cherry (Cornus mas L.) genotypes from spontaneous flora. Notulae Scientia Biologicae, 9(4), 577. doi:10.15835/nsb9410161
- Czerwińska, M. E., & Melzig, M. F. (2018). Conurs mas and Cornus officinalis — analogies and differences of two medicinal plants traditionally used. Frontiers in Pharmacology, 9, 1–28. doi:10.3389/fphar.2018.00894
- Czyżowska, A., Kucharska, A. Z., Nowak, A., Sokół-Łętowska, A., Motyl, I., & Piórecki, N. (2017). Suitability of the probiotic lactic acid bacteria strains as the starter cultures in unripe cornelian cherry (Cornus mas L.) fermentation. Journal of Food Science and Technology, 54(9), 2936–2946. doi:10.1007/s13197-017-2732-3
- De Biaggi, M., Donno, D., Mellano, M. G., Riondato, I., Rakotoniaina, E. N., & Beccaro, G. L. (2018). Cornus mas (L .) fruit as a potential source of natural health-promoting compounds: Physico-chemical characterisation of bioactive components. Plant Foods for Human Nutrition, 73, 89–94. doi:10.1007/s11130-018-0663-4
- de Macêdo, I. Y. L., Garcia, L. F., Oliveira Neto, J. R., de Siqueira Leite, K. C., Ferreira, V. S., Ghedini, P. C., & de Souza Gil, E. (2017). Electroanalytical tools for antioxidant evaluation of red fruits dry extracts. Food Chemistry, 217, 326–331. doi:10.1016/j.foodchem.2016.08.082
- Dokhanieh, A. Y., Aghdam, M. S., Fard, J. R., & Hassanpour, H. (2013). Postharvest salicylic acid treatment enhances antioxidant potential of cornelian cherry fruit. Scientia Horticulturae, 154, 31–36. doi:10.1016/j.scienta.2013.01.025
- Filipiak, M., Kiceła, A., & Stempkowska, I. (2001). Estimation of antioxidant activity of polyphenols by cyclic voltammetry. In M. Denac, V. Musil, & B. Pregrad (Eds.), Commodity science in global quality perspective : Products - technology, quality and environment. Proceedings of the 13th IGWT symposium (pp. 389–394). Maribor, Slovenia: Ekonomsko-poslovna fakulteta.
- Goedheer, J. C., Horreus De Haas, G. H., & Schuller, P. (1958). Oxidation-reduction potentials of different chlorophylls in methanol. Biochimica Et Biophysica Acta, 28, 278–283. doi:10.1016/0006-3002(58)90474-8
- Jaćimović, V., & Božović, Ð. (2017). Evaluation of cornelian cherry (Cornus mas L.) varieties and selections under the conditions of Gornje Polimlje region. Voćarstvo, 51(199/200), 81–86.
- Ji, D., Liu, L., Li, S., Chen, C., Lu, Y., Wu, J., & Liu, Q. (2017). Smartphone-based cyclic voltammetry system with graphene modified screen printed electrodes for glucose detection. Biosensors and Bioelectronics, 98, 449–456. doi:10.1016/j.bios.2017.07.027
- Jovanovic, S. V., Steenken, S., Hara, Y., & Simic, M. G. (1996). Reduction potentials of flavonoid and model phenoxyl radicals. Which ring in flavonoids is responsible for antioxidant activity? Journal of the Chemical Society, Perkin Transactions, 2(11), 2497. doi:10.1039/p29960002497
- Keyrouz, R., Abasq, M. L., Le Bourvellec, C., Blanc, N., Audibert, L., ArGall, E., & Hauchard, D. (2011). Total phenolic contents, radical scavenging and cyclic voltammetry of seaweeds from Brittany. Food Chemistry, 126(3), 831–836. doi:10.1016/j.foodchem.2010.10.061
- Kilmartin, P. A. (2001). Electrochemical detection of natural antioxidants: Principles and protocols. Antioxidants & Redox Signaling, 3(6), 941–955. doi:10.1089/152308601317203495
- Kobus-Cisowska, J., Flaczyk, E., Rudzińska, M., & Kmiecik, D. (2014). Antioxidant properties of extracts from Ginkgo biloba leaves in meatballs. Meat Science, 97(2), 174–180. doi:10.1016/j.meatsci.2014.01.011
- Kobus-Cisowska, J., Szymanowska, D., Maciejewska, P., Kmiecik, D., Gramza-Michałowska, A., Kulczyński, B., & Cielecka-Piontek, J. (2019a). In vitro screening for acetylcholinesterase and butyrylcholinesterase inhibition and antimicrobial activity of chia seeds (Salvia hispanica). Electronic Journal of Biotechnology, 37, 1–10. doi:10.1016/j.ejbt.2018.10.002
- Kobus-Cisowska, J., Szymanowska, D., Maciejewska, P., Szczepaniak, O., Kmiecik, D., Gramza-Michałowska, A., … Cielecka-Piontek, J. (2019b). Enriching novel dark chocolate with Bacillus coagulans as a way to provide beneficial nutrients. Food & Function, 10(2), 997–1006. doi:10.1039/C8FO02099J
- Kostecka, M., Szot, I., Czernecki, T., & Szot, P. (2017). Vitamin C content of new ecotypes of cornelian cherry (Cornus mas L.) determined by various analytical methods. Acta Scientiarum Polonorum Hortorum Cultus, 16(4), 53–61. doi:10.24326/asphc.2017.4.6
- Kucharska, A. Z., Sokół-Łętowska, A., & Piórecki, N. (2011). Morphological, physical & chemical, and antioxidant profiles of polish varieties of cornelian cherry fruit (Cornus mas L.). Zywnosc. Nauka. Technologia. Jakosc, 3(76), 78–89.
- Kucharska, A. Z., Szumny, A., Sokól-Letowska, A., Piórecki, N., & Klymenko, S. V. (2015). Iridoids and anthocyanins in cornelian cherry (Cornus mas L.) cultivars. Journal of Food Composition and Analysis, 40, 95–102. doi:10.1016/j.jfca.2014.12.016
- Ligaj, M., Tichoniuk, M., & Filipiak, M. (2008). Detection of bar gene encoding phosphinothricin herbicide resistance in plants by electrochemical biosensor. Bioelectrochemistry, 74(1), 32–37. doi:10.1016/j.bioelechem.2008.03.003
- Nenadis, N., Wang, L.-F., Tsimidou, M., & Zhang, H.-Y. (2004). Estimation of scavenging activity of phenolic compounds using the ABTS•+ assay. Journal of Agricultural and Food Chemistry, 52(15), 4669–4674. doi:10.1021/jf0400056
- Nicholas, P., Pittson, R., & Hart, J. P. (2018). Development of a simple, low cost chronoamperometric assay for fructose based on a commercial graphite-nanoparticle modified screen-printed carbon electrode. Food Chemistry, 241, 122–126. doi:10.1016/j.foodchem.2017.08.077
- Pantelidis, G. E., Vasilakakis, M., Manganaris, G. A., & Diamantidis, G. (2007). Antioxidant capacity, phenol, anthocyanin and ascorbic acid contents in raspberries, blackberries, red currants, gooseberries and Cornelian cherries. Food Chemistry, 102(3), 777–783. doi:10.1016/j.foodchem.2006.06.021
- Piekarska, J., Szczypka, M., Kucharska, A. Z., & Gorczykowski, M. (2018). Effects of iridoid-anthocyanin extract of Cornus mas L. on hematological parameters, population and proliferation of lymphocytes during experimental infection of mice with Trichinella spiralis. Experimental Parasitology, 188, 58–64. doi:10.1016/j.exppara.2018.03.012
- Popović, B. M., Štajner, D., Kevrešan, S., & Bijelić, S. (2012). Antioxidant capacity of cornelian cherry (Cornus mas L.) - Comparison between permanganate reducing antioxidant capacity and other antioxidant methods. Food Chemistry, 134, 734–741. doi:10.1016/j.foodchem.2012.02.170
- Press, W. H., Flannery, B. P., Teukolsky, S. A., & Vetterling, W. T. (1992). Savitzky-Golay smoothing filters. In Numerical recipes in Fortran 77: The art of scientific computing (pp. 644–649). Cambrigde, UK: Cambridge University Press.
- Rop, O., Mlcek, J., Kramarova, D., & Jurikova, T. (2010). Selected cultivars of cornelian cherry (Cornus mas L.) as a new food source for human nutrition. African Journal of Biotechnology, 9(8), 1205–1210. doi:10.5897/AJB10.1722
- Świerczewska, A., Buchholz, T., Melzig, M. F., & Czerwińska, M. E. (2019). In vitro α-amylase and pancreatic lipase inhibitory activity of Cornus mas L. and Cornus alba L. fruit extracts. Journal of Food and Drug Analysis, 27(1), 249–258. doi:10.1016/j.jfda.2018.06.005
- Szczepaniak, O. M., Kobus-Cisowska, J., Kusek, W., & Przeor, M. (2019). Functional properties of Cornelian cherry (Cornus mas L.): A comprehensive review. European Food Research and Technolology, 1–17. doi: 10.1007/s00217-019-03313-0
- Villaño, D., Fernández-Pachón, M. S., Moyá, M. L., Troncoso, A. M., & García-Parrilla, M. C. (2007). Radical scavenging ability of polyphenolic compounds towards DPPH free radical. Talanta, 71(1), 230–235. doi:10.1016/j.talanta.2006.03.050
- Wang, E., & Wink, M. (2016). Chlorophyll enhances oxidative stress tolerance in Caenorhabditis elegans and extends its lifespan. PeerJ, 4, e1879. doi:10.7717/peerj.1879