
 ?Mathematical formulae have been encoded as MathML and are displayed in this HTML version using MathJax in order to improve their display. Uncheck the box to turn MathJax off. This feature requires Javascript. Click on a formula to zoom.
ABSTRACT
Cornelian cherry fruits are rich in health-related compounds. In the present study, the ultrasound-assisted extraction was used to maximize the recovery of anthocyanins and phenolic compounds from cornelian cherry. The optimal extraction conditions were determined and the influence of independent variables was checked through response surface methodology. The maximum recovery of anthocyanin and total phenolic compounds was obtained after 40 min at 30°C, when performing the extraction with aqueous ethanol of 80% and 60%, respectively. The major anthocyanins identified through HPLC were cyanidin-3-rutinoside and cyanidin-3-glucoside. The thermal degradation kinetic study revealed that up to 120°C, the anthocyanins from cornelian cherry were thermo-resistant, whereas at more severe temperatures were easily degraded. The kinetics of the heat-induced changes in total monomeric anthocyanins followed a first-order kinetic model, allowing to predict the thermal degradation parameters.
Resumen
Las cerezas de cornalina son ricas en compuestos relacionados con la salud. El presente estudio utilizó la extracción asistida por ultrasonido con el propósito de maximizar la recuperación de antocianinas y compuestos fenólicos de dicha cereza. En este sentido, se determinaron las condiciones óptimas de extracción y se verificó la influencia de variables independientes mediante la metodología de superficie de respuesta. Después de 40 minutos a 30°C se logró la recuperación máxima de antocianina y compuestos fenólicos totales, al realizar la extracción con etanol acuoso al 80% y 60%, respectivamente. Las principales antocianinas identificadas mediante HPLC fueron la cianidina-3-rutinósido y la cianidina-3-glucósido. El estudio cinético de degradación térmica reveló que las antocianinas de la cereza de cornalina son termorresistentes hasta 120°C, mientras que a temperaturas más severas se degradan fácilmente. En tanto los cambios inducidos por el calor en las antocianinas monoméricas totales siguen un modelo cinético de primer orden, es posible predecir los parámetros de degradación térmica.
1. Introduction
Cornelian cherry (Cornus mas) fruits are an excellent source of organic acids, sugars, carotenoids, phenolic acids, flavonoids, anthocyanins, pectins, tannins, vitamin C and minerals, being considered as the fruit that complies the most severe standards of safe food (Dinda et al., Citation2016).
Cornelian cherry extracts showed significant activity against some pathogenic bacteria, justifying the traditional use for treating diarrhea, gastrointestinal disorders and urinary tract infections (Dinda et al., Citation2016; Milenkovic-Andjelkovic, Andjelkovic, Radovanovic, Radovanovic, & Nikolic, Citation2015). Moreover, cornelian cherries have strong antibacterial activity, being therefore effective in treating skin diseases (Tong, Davis, Eichenberger, Holland, & Fowler, Citation2015).
The content of anthocyanins from cornelian cherry is higher compared to many other cherries and berries. Previous studies (Pantelidis, Vasilakakis, Manganaris, & Diamantidis, Citation2007) showed that cornelian cherries are an excellent source of ascorbic acid, anthocyanins, phenols, and antioxidants. The anthocyanins from cornelian cherry were found to stimulate the insulin secretion from the rodent’s pancreatic beta-cells in vitro (Jayaprakasam, Vareed, Olson, & Nair, Citation2005). Moreover, the consumption of cornelian cherry by atherosclerotic patients decreased the risk of cardiovascular diseases (Asgary, Rafieian-Kopaei, Adelnia, Kazemi, & Shamsi, Citation2010), and proved to have hepatoprotective activity (Alavian, Banihabib, Haghi, & Panahi, Citation2014).
Because of the potential health benefits of anthocyanins as antioxidants and anti-inflammatory agents, the interest of the consumers on new dietary food supplements based on cornelian cherry has increased. In many cases, the development of such products requires extracting the anthocyanins out of the matrix. Various methods can be used to increase the efficiency of liquid extractions, by decreasing the processing time, and minimizing the use and exposure to organic solvents (Celli, Ghanem, & Brooks, Citation2015). Ultrasound-assisted extraction (UAE) is a green extraction method that compared to the conventional extraction technique provides increased reproducibility, simplified manipulation, reduced solvent consumption and less energy input (Da Porto & Natolino, Citation2018). On the other hand, in order to maximize the recovery of bioactive compounds such as polyphenols and anthocyanins, optimization of the extraction conditions is needed. UAE has been successfully used to extract the anthocyanins from different food sources, such as black chokeberries (Galván D’Alessandro, Dimitrov, Vauchel, & Nikov, Citation2014), cranberries (Klavins, Kviesis, Nakurte, & Klavins, Citation2018), haskap berries (Celli et al., Citation2015), blueberries, cherries, and red pear peels (Wang, Jung, Tomasino, & Zhao, Citation2016). However, to the best of our knowledge, there are no reports on the optimization of the extraction conditions of anthocyanins and total phenolic compounds from cornelian cherry. The main objective of our study was to identify the optimal extraction conditions using ultrasounds for the extraction of total anthocyanins and total phenolic compounds from cornelian cherry. Further kinetic study was performed to evaluate the thermal behavior of these bioactives at different temperature-time combinations, considering the perspective of their use as food ingredients.
2. Materials and methods
2.1. Materials
Approximately 3 kg of fresh cornelian cherry cultivar “Bordo” (listed in the Romanian Official Catalogue of Varieties published by the State Institute for Testing and Registration of Varieties; maintainer is the Research Institute for Fruit Growing Pitesti – Maracineni, Romania) at full maturity (dark red) were purchased from the local market (Roman, Romania) in August 2016 and stored at −20°C until needed for analysis. The pulp was removed from the stones and freeze-dried (CHRIST Alpha 1–4 LD plus, Germany) at −42°C under a pressure of 0.10 mbar for 72 h.
The cyanidin-3-glucoside and cyanidin-3-rutinoside with purity over 99% were purchased from Extrasynthese (France).
2.2. Ultrasound-assisted extraction procedure
Ultrasound-assisted extraction was performed using an ultrasonic bath system (MRC Scientific Instruments). An amount of 1 g of freeze-dried powder of cornelian cherry was mixed with the designated volume of ethanol of varying concentration and introduced in an ultrasonic bath equipped with a digital control system of sonication time, temperature and frequency. UAE was performed at a constant frequency of 40 kHz, with a constant power of 100 W. Cold water was added to maintain a constant temperature (± 3°C) in the ultrasonic bath. The influence of extraction temperature (30°C, 40°C, and 50°C), solvent concentration (40%, 60% and 80% v/v), extraction time (10 min, 25 min, 40 min) and liquid to solid ratio (10, 20 and 30 mL/g) was investigated. Afterwards, the supernatant was separated by centrifugation at 9000 rpm for 10 min. The collected supernatant was dried at 40°C using a vacuum rotary evaporator (AVC 2-18, Christ, UK). The dried extracts were stored at 4°C prior to subsequent analysis.
2.3. Total anthocyanins content (TAC)
TAC was measured according to pH differential method. Anthocyanins appear in the oxonium form at pH 1.0 and the hemiketal form at pH 4.5. The structural reversible transformations of anthocyanins under different pH values display different UV–Visible absorptions (Jiang, Yang, & Shi, Citation2017). The absorbance of cornelian cherry anthocyanins was measured at 520 nm (A520) and 700 nm (A700), using a 0.025 M potassium chloride buffer of pH 1.0 and 0.4 M sodium acetate buffer of pH 4.5. The absorbance (A) was measured using Equation (1):
TAC of cornelian cherry, expressed in mg cyanidin-3-glucoside/100 g dry weight (d.w.), was calculated according to Equation (2):
where: MW is 449.1 and represents the molecular weight of cyanidin-3-glucoside (Cy3gl), 26900 is the extinction coefficient, DF represents the dilution factor, V is the total volume (mL), while Wt represents the sample weight (g).
2.4. Total phenolics content (TPC) analysis
TPC was measured according to Folin-Ciocalteu’s protocol. Briefly, 0.1 mL of diluted extract was mixed with 7.9 mL of distilled water and 0.5 mL of Folin-Ciocalteu solution and kept for 10 min to allow the interaction. Then, 1.5 mL of sodium bicarbonate (20% w/v) was added and the samples were kept in the dark for 60 min at room temperature. The absorbance was measured using UV-VIS spectrophotometer (Biochrom Libra S22, UK) against the blank at 765 nm. The results are expressed as gallic acid equivalent (GAE) mg/100 g d.w.
2.5. Yield of TAC and TPC
The yield of TAC and TPC was calculated as:
where: is the content of TAC or TPC and
is the mass of the concentrated extract derived from the initial lyophilized powder.
2.6. Chromatographic analysis of anthocyanins
The chromatographic analysis of the anthocyanins from cornelian cherry extract was conducted using a Thermo Finnigan HPLC system (Thermo Scientific, USA). For the analysis, a Synergi 4u Fusion-RP 80A (150 × 4.6 mm, 4 μm) column was used, monitored at 520 nm wavelength, at an oven temperature of 25°C. The samples were first filtered using a C18 Sep-Pack cartridge-Waters, in order to remove any unwanted compounds, besides the desired compounds, and secondly through 0.22-μm syringe filters (Bio Basic Canada Inc., ON, Canada). The two solvents used for the elution step were 10% formic acid (A) and 100% methanol (B). The injection volume was 10 µL, at a flow rate of 1.0 mL/min. Calibration curves for cyanidin-3-rutinoside (Cy3rut) and Cy3gl were plotted and estimated using standard curves. The anthocyanins from the cornelian cherry extract were identified using the retention time of standard compounds and were expressed as mg/g d.w.
The calibration curves were obtained by the external standard method on five levels of concentration of each of the following standards: cyanidin-3-glucoside and cyanidin-3-rutinoside. The areas of the chromatogram peak at 520 nm were plotted against the known concentrations of the standard solutions to establish the calibration equations. Linear regression equations with regression coefficient R2 higher than 0.99 were considered for anthocyanin quantification.
2.7. Response surface methodology (RSM)
A four-factor, three-level Box-Behnken design (BBD) with three replicates in the central point was performed to obtain the optimum conditions for UAE of TAC and TPC from cornelian cherry extracts. Temperature (X1), ethanol concentration (X2), sonication time (X3) and liquid/solid ratio (X4) were chosen as independent variables. The complete design matrix of BBD with a total of 27 experiments and experimental data for the responses of TAC and TPC from cornelian cherry extracts is presented in . The experimental data for the two responses were fitted into a second-order polynomial model:
Table 1. Box–Behnken design (BBD) experimental design with the independent variables and experimental dataa for the responses of total anthocyanin content (TAC) and total phenolic content (TPC) from cornelian cherry.
. Diseño experimental de diseño de Box-Behnken (BBD) con las variables independientes y datos experimentales para las respuestas del contenido total de antocianinas (TAC) y el contenido fenólico total (TPC) de la cereza de cornalina.
where: Y is the response, and
are the independent variables (i and j are varying between 1 to k), β0 is a constant, whereas βi, βii, and βij are the regression coefficients of linear, quadratic and interaction terms, k is the number of parameters, 4 in our study.
The statistical significance of the equation was examined by ANOVA method. The significance of each coefficient and the interaction between each independent variable were examined based on p-value. Minitab 18 Software was used to generate contour plots.
The accuracy and validity of the model were expressed through the coefficient of determination R2, the lack of fit test as well as the F-test along with its corresponding p-value at 0.05 alpha level.
2.8. Determination of optimum extraction conditions and validation of the study
The optimal extraction conditions were estimated using the response optimizer function from the Minitab 18 software. The maximum content of TAC and TPC was measured using the optimal extraction conditions proposed by the software. Validation experiments were conducted to assess the model performance, using the resulted experimental data from BBD. The experimental values were compared to the model predicted values. In addition, the coefficient of variation (CV %) and percentage error Equation (5) between the actual and predicted values were calculated.
where: and
are experimental and predicted values, respectively.
2.9. Heat treatment
Aqueous extract solutions were introduced in glass tubes and heated in the temperature range between 100°C and 150°C for 0 to 80 min, using a block heater (Stuart SBH200D, UK). After heating, the tubes were cooled rapidly in cold water and analyzed for TAC and TPC.
2.10. Kinetic analysis
The degradation kinetics of TAC and TPC from cornelian cherry was fitted using the first-order kinetic model as described previously (Stanciuc, Dumitrascu, Râpeanu, & Stanciu, Citation2011).
2.11. Molecular modeling investigations on thermal dependent behavior of anthocyanins
In order to investigate the thermal behavior of main anthocyanins from cornelian cherry molecular modeling tests were further performed. The chemical structures of Cy3rut and Cy3gl were drawn and optimized using Hyperchem 8.0 software (Hypercube Inc.). Steepest descent and Conjugate gradient algorithms were used in sequence to optimize the geometry of the investigated molecules until reaching potential energy gradients lower than 0.001 kcal/Å·mol. Three different starting models consisting of two anthocyanins of the same type were used to investigate the effect of the thermal treatment, to favor all types of self-association (Castaneda-Ovando, de Lourdes Pacheco-Hernández, Páez-Hernández, Rodríguez, & Galán-Vidal, Citation2009). The models obtained by merging similar optimized compounds were as follows: complex 1 – characterized by the distance between oxygen atoms of benzopyrylium of one anthocyanin molecule and phenyl aromatic ring of the second anthocyanin molecule of 1.5Å, which allows hydrogen bonding; complex 2 – characterized by the distance of 1.5Å between oxygen atoms of phenyl aromatic ring of one anthocyanin molecule and benzopyrylium of the second anthocyanin molecule; complex 3 – characterized by the distance of 1.5Å between oxygen atoms of benzopyrylium of one anthocyanin molecule and the sugar moiety of the second anthocyanin molecule. All starting models were heated and equilibrated through molecular dynamics steps at 25°C, 100°C and 150°C for 100 ps. Atomic-level details were finally gathered on the equilibrated models, such as to predict any potential thermal-induced self-association or co-pigmentation event.
2.12. Statistical analysis
The data on thermal degradation of cornelian cherry extract are expressed as the mean of triplicate samples followed by standard deviation. The differences were quantified using one-way ANOVA after assessment of the normality and variance equality conditions. Post-hoc analysis via Tukey method was performed when p-value resulted in ANOVA analysis was less than 0.05. Statistical analysis was performed using Minitab 18 software.
3. Results and discussion
It is essential to know the influence of extraction parameters, which may allow efficient isolation and use of the biologically active compounds from a food matrix. Here, a four-level, four-factor BBD was employed to study the effect of various independent extraction variables on the recovery of TAC and TPC from cornelian cherry. The data derived from the second-order polynomial equation are shown in .
Table 2. Regression coefficient, coefficient of determination (R2) and F-test value of the predicted second-order polynomial models for total anthocyanin content (TAC) and total phenolic content (TPC) from cornelian cherry.
. Coeficiente de regresión, coeficiente de determinación (R2) y valor de la prueba F de los modelos polinomiales de segundo orden pronosticados para el contenido total de antocianinas (TAC) y el contenido fenólico total (TPC) de la cereza de cornalina.
The lack of fit tests showed no significant influence, suggesting the high accuracy of the model for the prediction of TAC and TPC, for any combination of independent variables within the range of this study.
3.1. The influence of extraction parameters on TAC
The regression model obtained for TAC displayed a determination coefficient of R2= 0.87, suggesting that only 0.13 of the variation of TAC cannot be explained by the present model. Linear terms that resulted from the regression equation () indicated that only liquid-solid ratio had a significant (p < .001) negative effect on TAC, whereas all the other tested variables were insignificant.
On the other hand, ethanol concentration and liquid/solid ratio had a significant (p < .01) positive influence on quadratic terms. For the response of TAC, the interaction between temperature and extraction time had a strong significant effect (p < .01). The interaction between the ethanol concentration and extraction time showed a moderately significant effect on TAC, whereas the interaction between temperature and liquid/solid ratio displayed a high positive interaction on TAC. After excluding the insignificant terms, the final developed model was given by:
where: X1 is the extraction temperature (°C), X2 is the ethanol concentration (%), X3 is the sonication time (min), and X4 is the liquid/solid ratio (mL/g).
Under the applied experimental conditions, TAC ranged between 145.54 and 281.56 mg Cy3gl/100 g d.w. (). The interactive effects of the independent factors on the TAC content were depicted in . Contour plots, where two of the variables were fixed at the mean value, provide a good visual representation of the interactions of different factor variables on the effects of response variables (Luo, Peng, Liu, Wu, & Wu, Citation2018).
Figure 1. Contour plots showing the effect of temperature, ethanol, extraction time and liquid-solid ratio on the extraction yield of total anthocyanin content (TAC).
. Gráficos de contorno que muestran el efecto de la temperatura, el etanol, el tiempo de extracción y la relación líquido-sólido sobre el rendimiento de extracción del contenido total de antocianinas (TAC).
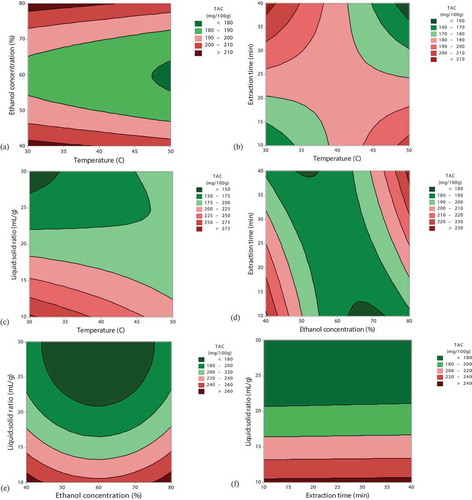
The extraction performed at 50°C for 40 min () decreased the recovery of anthocyanins from cornelian cherry. A combination of shorter extraction time and higher temperature or longer extraction time and lower temperature generated the highest recovery of anthocyanins (). Higher extraction yield of anthocyanins from blackberries when using longer extraction time (30 min) and lower temperatures (40°C) were also reported (Ivanovic, Tadic, Dimitrijevic, & Stamenic, Citation2014). These combinations allowed the decrease of the solvent’s surface tension, while increasing the vapor pressure, which led to the formation of the cavitation bubble and increased the extraction yield (Pandey, Belwal, Sekar, Bhatt, & Rawal, Citation2018).
The increase of ethanol concentration showed a positive quadratic effect (p < .01) on TAC extraction and suggested the essential role of the solvent in the extraction of phenolic compounds from cornelian cherry (). The influence of solvents on the extraction of TAC was strongly dependent on the solvent composition. Solvents tend to solubilize compounds based on the principle “like dissolve like”; thus, the compounds that possess similar properties to the solvent are easily solubilized (Ali, Lim, Chong, Mah, & Chua, Citation2018; Mustafa & Turner, Citation2011). The extraction of TAC reached a maximum when using 80% ethanol concentration ().
Material source and process parameters play an important role in selecting the liquid/solid ratio for the maximum extraction of anthocyanins. In a recent study (Blackhall, Berry, Davies, & Walls, Citation2018), the authors showed that TAC yield increased by increasing the liquid/solid ratio up to 10 mL/g, due to the increased concentration gradient. A further increase resulted in a significant decrease of TAC, behavior that was also noticed in our study, where the liquid/solid ratio higher than 10 mL/g decreased the recovery of anthocyanins (). When all of the anthocyanins within cornelian cherry have been extracted, the quantity of solvent no longer changed the yield of the TAC.
3.2. The influence of extraction parameters on TPC
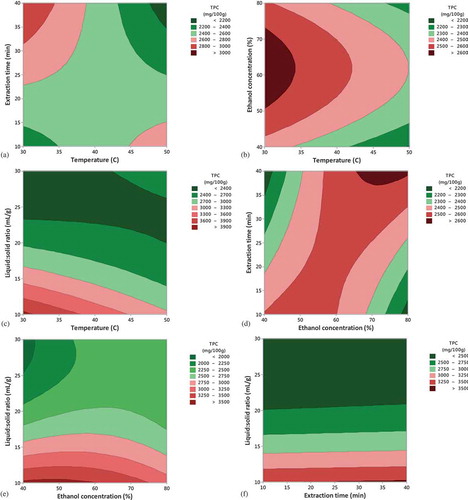
TPC from cornelian cherry ranged from 2036.17 mg GAE/100 g d.w. to 4416.28 mg GAE/100 g d.w. (). Similar to TAC, TPC extraction was significantly influenced by liquid/solid ratio (p < .001). The F-value of 9.37 (p < .001) indicated that the model was significant with a good prediction (R2 = 0.85) (). The lack of fit of the F value suggested the accuracy of the model.
The final fitted second-order polynomial equation, in terms of coded factors for TPC prediction by neglecting the insignificant terms, was given in accordance to Equation (7):
The statistical analysis of the experimental results showed that temperature, as a linear factor, did not exert a significant effect on TPC recovery, but this effect was found to be significant when associated with time and liquid-solid ratio. Based on the interactive effect of variables, the interaction between temperature and sonication time showed a significant negative effect, indicating that a higher temperature and a longer extraction time are not necessary for TPC recovery. The interaction between temperature and liquid/solid ratio influenced positively the recovery of TPC, whereas the interactive effect between ethanol concentration and liquid/solid ratio was found significant, assuming a risk of 0.1 ().
Contour plots were also created for predicting the relationship between the independent and dependent variables (). From it can be seen that up to 35°C, for ethanol concentration between 50 − 70% the highest values of TPC were obtained. The extraction of TPC from cornelian cherry at 50°C for 40 min resulted in a TPC less than 2200 mg GAE/100 g d.w, whereas when using the same extraction temperature, but only for 10 min the TPC recovery ranged between 2600 and 2800 mg GAE/100 g d.w. Lower temperatures and higher extraction time favored the increase of TPC yield (). Similar to TAC, a liquid-solid/ratio higher than 10 mL/g decreased the yield of TPC ().
Figure 2. Contour plots showing the effect of temperature, ethanol, extraction time and liquid-solid ratio on the extraction yield of total phenolic content (TPC).
. Gráficos de contorno que muestran el efecto de la temperatura, el etanol, el tiempo de extracción y la relación líquido-sólido sobre el rendimiento de extracción del contenido fenólico total (TPC).
3.3. Optimization and validation of extraction conditions
The optimal conditions proposed by the model, based on the maximization of the desirability of the responses, were used to validate the model equation. The optimal conditions for the maximum recovery of anthocyanins were: temperature 30°C, ethanol concentration 80%, extraction time 40 min and liquid/solid ratio 10 mL/g, the model predicting a maximum response of 354.46 mg Cy3gl/100 g d.w. (). In other studies (Pantelidis et al., Citation2007; Tural & Koca, Citation2008) TAC values ranged between 112 and 292 mg Cy3gl/100 g.
Table 3. Experimental data of the validation of predicted values for total anthocyanin content (TAC) and total phenolic content (TPC) at optimal extraction conditions.
. Datos experimentales de la validación de los valores pronosticados para el contenido total de antocianinas (TAC) y el contenido fenólico total (TPC) en condiciones óptimas de extracción.
The optimal conditions of TPC proposed by the model were similar to those reported for TAC, except the ethanol concentration, the model predicting a maximum recovery when using 60% ethanol (4318.9 mg GAE/100 g d.w.). Gastol, Krosniak, Derwisz, and Dobrowolska-Iwanek (Citation2013) reported for cornelian cherry a TPC of 45.6 g GAE/100 g, Pantelidis et al. (Citation2007) reported a content of 1592 ± 132 mg GAE/100 g d.w., whereas in another study (Rop, Mlcek, Kramarova, & Jurikova, Citation2010), TPC ranged from 2.61 ± 0.21 to 8.11 ± 0.4 g GAE/kg fresh weight. In our study, the mean value of 344.26 mg Cy3gl/100 g d.w. and 3969.9 mg GAE/100 g d.w. and lower CV values () indicated the validation of the extraction model. The validity of the model was sustained also by the percentage errors that ranged between 2.97% and 8.81% for TAC and TPC, respectively.
3.4. HPLC analysis of anthocyanins from cornelian cherry extract
The main anthocyanins extracted from cornelian cherry under optimized conditions were quantified using HPLC by comparison to standards. Six compounds resulted and only two of them were identified and quantified based on retention time (). Thus, for Cy3rut was calculated an average content of 180.60 mg/100 g d.w., whereas for Cy3gl of 103.6 mg/100 g d.w. The two identified anthocyanins represented more than 76% of the total peaks monitored at 520 nm. The profile on anthocyanins varies with fruit composition, genetic factors of the plant, sun exposure, temperature, humidity, availability of nutrients and soil properties (Antolak et al., Citation2017). Three major anthocyanins, namely Cy3gl, Cy3rut, and pelargonidin-3-glucoside, were identified in cornelian cherry by Tural and Koca (Citation2008), whereas Antolak et al. (Citation2017) identified Cy3gl, petunidin-3-glucoside, cyanidin-3-robinobioside and pelargonidin-3-robinobioside in the cornelian cherry juice. Moreover, Kucharska, Szumny, Sokól-Letowska, Piórecki, and Klymenko (Citation2015) studied the anthocyanins from 26 different cultivars of cornelian cherry harvested over the 5-year period and reported the existence of five anthocyanins: delphinidin, cyanidin, and pelargonidin glycosides. They employed NMR, LC-MS, and HPLC for anthocyanin analysis and showed that in some cultivars prevail pelargonidin and in other cyanidin glycosides.
Figure 3. HPLC separation of anthocyanins in cornelian cherries monitored at 520 nm. Peak identification: (1) cyanidin-3-glucoside; (2) cyanidin-3-rutinoside; (3–6) unidentified compounds.
. Separación por HPLC de antocianinas en cerezas de cornalina monitorizadas a 520 nm. Identificación de pico: (1) cianidin-3-glucósido; (2) cianidin-3-rutinósido; (3–6) compuestos no identificados.
3.5. Thermal degradation of TAC and TPC
The thermal behavior of TAC and TPC from aqueous extracts of cornelian cherry extract was further investigated. Both anthocyanins and total phenolics were heat stable at temperatures below 100°C (data not shown).
Heating the extract solutions at 100°C for 10 min decreased TAC to 284.1 ± 12.1 mg Cy3gl/100 g d.w., whereas by increasing the heating time to 80-min TAC decreased to about 55% from the initial concentration. At 150°C, only 12 min of heating were necessary to reduce TAC to 45.2 ± 7.8 mg Cy3gl/100 g d.w., thus indicating that at severe temperatures, anthocyanins are easily predisposed to degradation. Further qualitative information on the behavior of main anthocyanins from cornelian cherry, as indicated by HPLC analysis, was gathered by performing molecular modeling investigations. It was previously stated that purified anthocyanins degrade at thermal treatment faster than the unpurified extracts, as a result of intra- and intermolecular co-pigmentation reactions (Nayak, Berrios, Powers, & Tang, Citation2011). Three different models of each complex formed by two molecules of Cy3rut or Cy3gl were heated at 25°C, 100°C and 150°C, and the results suggested that, depending on the starting models and the severity of thermal processing, both intramolecular co-pigmentation and intermolecular self-association might appear, concurring to the reduction of the color, which was associated to degradation of anthocyanins (Nayak et al., Citation2011). Careful analysis of the complex 1 consisting of Cy3rut molecules indicated no non-bonded contacts between the two compounds, with high tendency of the sugar moiety of bending toward flavylium cation. Moreover, the two molecules established one hydrogen bond at 100°C (-O30 … H67-), whereas at even high temperature the complex was stabilized by two different hydrogen bonds (-O42 … H64- and – O34 … H66-). As indicated by the interaction energy (E) values, the temperature increase resulted in better affinity between Cy3rut molecules from complex 3 (E of 0 kcal/mole at 25°C, −7.4899 kcal/mole at 100°C and −22.9183 kcal/mole at 150°C). Important atomic rearrangements were observed also in case of the complexes consisting of Cy3gl molecules subjected to heat. When simulating the thermal behavior of the complexes 1 and 2 was observed that the temperature increase from 25°C to 150°C affected the interaction between the two molecules of the complex (at 25°C E was −19.7696 kcal/mole and −20.5520 kcal/mole for complex 1 and 2, respectively, whereas at 150°C was 0 kcal/mole). As a general observation, starting with 100°C, the aglycon of the anthocyanin molecules gets twisted, with phenyl ring out of the plane defined by the benzopyrylium, whereas the sugar moiety is bent toward the aglycon.
On the other hand, the experimental results indicated for the whole temperature range tested in this study, that TPC was thermo-resistant (). Thermal treatment for 10 minutes between 100°C and 150°C did not have any impact on TPC. However, severe temperatures and longer holding time generated a small but significant increase in TPC. Similar results were reported in another study (Oancea, Turturică, Bahrim, Râpeanu, & Stănciuc, Citation2017) and Maillard reaction products and/or liberation by the cleavage of the esterified and glycosylated bonds were found to be responsible for TPC increase. Between 100°C −150°C, Sólyom, Solá, Cocero, and Mato (Citation2014) indicated that the polyphenols content from grape pomace extracts remained constant, while the degradation of polyphenols occurred at 200°C after 120 min. This specific thermal behavior was correlated to the structural and bonding state of the different present polyphenols.
Figure 4. The influence of time on the total phenolics content of cornelian cherries heated at different temperatures. Superscripts that on the same heating time do not share the same letter are statistically significant at ** p < 0.01, *** p < 0.001.
. La influencia del tiempo sobre el contenido fenólico total de cerezas cornelias calentadas a diferentes temperaturas. Los superíndices que en el mismo tiempo de calentamiento no comparten la misma letra son estadísticamente significativos en ** p < 0.01, *** p < 0.001.
The linear regression of the extracts in the tested temperature range confirmed that the degradation process of anthocyanins from cornelian cherry followed a first-order kinetic model (), results that are in agreement to many other studies on anthocyanins thermal degradation (Kara & Ercȩlebi, Citation2013; Oancea et al., Citation2017; Peron, Fraga, & Antelo, Citation2017).
Table 4. Degradation rate constant (k) and activation energy (Ea) of total anthocyanins from cornelian cherry extract at different temperature-time combinations.
. Constante de velocidad de degradación (k) y energía de activación (Ea) de las antocianinas totales del extracto de cereza de cornalina a diferentes combinaciones de temperatura y tiempo.
The rate constants (k) of TAC were fitted to an Arrhenius type equation to calculate the activation energy (Ea). In a study reported by Moldovan and David (Citation2014) the influence of temperature (from 2°C to 75°C) on the stability of cornelian cherry resulted in an Ea value of 58.5 kJ/mol. In our study, the Ea was 80.48 ± 5.35 J/mol, indicating the anthocyanin susceptibility to degradation at high temperatures.
4. Conclusions
The ultrasound-assisted extraction was applied to recover the anthocyanins and total phenolic compounds from cornelian cherry. In order to obtain the highest content of phytochemicals mentioned above, the joint optimization of the most influential variables was assessed using Box-Behnken design. Anthocyanin recovery was more influenced by the ethanol concentration than by temperature, due to the major contribution of the quadratic effect of ethanol concentration. Total phenolic content was highly dependent on both the linear and quadratic term of liquid/solid ratio and on the interactive effect of temperature with the extraction time and liquid/solid ratio. When the ultrasound-assisted extraction was performed at the liquid/solid ratio of 10 mL/g for 40 min at 30°C, under 40 kHz, the HPLC analysis indicated that cyanidin-3-rutinoside and cyanidin-3-glucoside represented more than 76% of the total anthocyanins present in cornelian cherry extract. The kinetic studies revealed that the phenolic compounds were heat stable in the tested temperature range, whereas anthocyanins were easily exposed to degradation with the increasing temperature and heating time. Molecular dynamics test, which was used to explore the conformational space while heating pairs of anthocyanins at 25°C, 100°C, and 150°C, suggested that thermal degradation of these compounds might be partially explained by intramolecular co-pigmentation and intermolecular self-association reactions. In conclusion, ultrasounds assisted extraction can be used to improve the phytonutrients' recovery from cornelian cherry and opens the possibility of a better exploitation of this valuable fruit in food applications.
Acknowledgments
This work was supported by a grant of Ministry of Research and Innovation, CNCS-UEFISCDI, project number PN-III- P1-1.1-PD-2016-0950 within PNCDI III. The Integrated Center for Research, Expertise and Technological Transfer in Food Industry is acknowledged from providing technical support.
Disclosure statement
No potential conflict of interest was reported by the authors.
Additional information
Funding
References
- Alavian, S. M., Banihabib, N., Haghi, M. E., & Panahi, F. (2014). Protective effect of Cornus mas fruits extract on serum biomarkers in ccl4- induced hepatotoxicity in male rats. Hepatitis Monthly, 14, 103–130.
- Ali, A., Lim, X. Y., Chong, C. H., Mah, S. H., & Chua, B. L. (2018). Optimization of ultrasound-assisted extraction of natural antioxidants from Piper betle using response surface methodology. LWT - Food Science and Technology, 89, 681–688. doi:10.1016/j.lwt.2017.11.033
- Antolak, H., Czyzowska, A., Sakač, M., Mišan, A., Đuragić, O., & Kregiel, D. (2017). Phenolic compounds contained in little-known wild fruits as anti-adhesive agents against the beverage-spoiling bacteria asaia spp. Molecules, 22(8), 1256. doi:10.3390/molecules22081256
- Asgary, S., Rafieian-Kopaei, M., Adelnia, A., Kazemi, S., & Shamsi, F. (2010). Comparing the effects of lovastatin and Cornus mas fruit on fibrinogen level in hypercholesterolemic rabbits. ARYA Atherosclerosis, 6, 1–5.
- Blackhall, M. L., Berry, R., Davies, N. W., & Walls, J. T. (2018). Optimized extraction of anthocyanins from Reid Fruits’ Prunusavium ‘Lapins’ cherries. Food Chemistry, 256, 280–285. doi:10.1016/j.foodchem.2018.02.158
- Castaneda-Ovando, A., de Lourdes Pacheco-Hernández, M., Páez-Hernández, M. E., Rodríguez, J. A., & Galán-Vidal, C. A. (2009). Chemical studies of anthocyanins: A review. Food Chemistry, 113, 859–871. doi:10.1016/j.foodchem.2008.09.001
- Celli, G. B., Ghanem, A., & Brooks, M. S. L. (2015). Optimization of ultrasound-assisted extraction of anthocyanins from haskap berries (Lonicera caerulea L.) using Response surface methodology. Ultrasonics Sonochemistry, 27, 449–455. doi:10.1016/j.ultsonch.2015.06.014
- Da Porto, C., & Natolino, A. (2018). Extraction kinetic modelling of total polyphenols and total anthocyanins from saffron floral bio-residues: Comparison of extraction methods. Food Chemistry, 258, 137–143. doi:10.1016/j.foodchem.2018.03.059
- Dinda, B., Kyriakopoulos, A. M., Dinda, S., Zoumpourlis, V., Thomaidis, N. S., Velegraki, A., & Dinda, M. (2016). Cornus mas L. (cornelian cherry), an important European and Asian traditional food and medicine: Ethnomedicine, phytochemistry and pharmacology for its commercial utilization in drug industry. Journal of Ethnopharmacology, 193, 670–690. doi:10.1016/j.jep.2016.10.034
- Galván D’Alessandro, L., Dimitrov, K., Vauchel, P., & Nikov, I. (2014). Kinetics of ultrasound assisted extraction of anthocyanins from Aronia melanocarpa (black chokeberry) wastes. Chemical Engineering Research and Design, 92(10), 1818–1826. doi:10.1016/j.cherd.2013.11.020
- Gastol, M., Krosniak, M., Derwisz, M., & Dobrowolska-Iwanek, J. (2013). Cornelian cherry (Cornus mas L.) juice as a potential source of biological compounds. Journal of Medicinal Food, 16(8), 728–732. doi:10.1089/jmf.2012.0248
- Ivanovic, J., Tadic, V., Dimitrijevic, S., & Stamenic, M. (2014). Antioxidant properties of the anthocyanin-containing ultrasonic extract from blackberry cultivar “Cacanska Bestrna”. Industrial Crops & Products, 53, 274–281. doi:10.1016/j.indcrop.2013.12.048
- Jayaprakasam, B., Vareed, S. K., Olson, L. K., & Nair, M. G. (2005). Insulin secretion by bioactive anthocyanins and anthocyanidins present in fruits. Journal of Agriculture and Food Chemistry, 53, 28–31.
- Jiang, H. L., Yang, J. L., & Shi, Y. P. (2017). Optimization of ultrasonic cell grinder extraction of anthocyanins from blueberry using response surface methodology. Ultrasonics Sonochemistry, 34, 325–331. doi:10.1016/j.ultsonch.2016.06.003
- Kara, Ş., & Ercȩlebi, E. A. (2013). Thermal degradation kinetics of anthocyanins and visual colour of Urmu mulberry (Morus nigra L.). Journal of Food Engineering, 116, 541–547. doi:10.1016/j.jfoodeng.2012.12.030
- Klavins, L., Kviesis, J., Nakurte, I., & Klavins, M. (2018). Berry press residues as a valuable source of polyphenolics: Extraction optimisation and analysis. LWT- Food Science and Technology, 93, 583–591. doi:10.1016/j.lwt.2018.04.021
- Kucharska, A. Z., Szumny, A., Sokól-Letowska, A., Piórecki, N., & Klymenko, S. V. (2015). Iridoids and anthocyanins in cornelian cherry (Cornus mas L.) cultivars. Journal of Food Composition and Analysis, 40, 95–102. doi:10.1016/j.jfca.2014.12.016
- Luo, Y., Peng, B., Liu, Y., Wu, Y., & Wu, Z. (2018). Ultrasound extraction of polysaccharides from guava leaves and their antioxidant and antiglycation activity. Process Biochemistry, 73, 228–234. doi:10.1016/j.procbio.2018.08.003
- Milenkovic-Andjelkovic, A., Andjelkovic, M., Radovanovic, A., Radovanovic, B., & Nikolic, V. (2015). Phenol composition, DPPH radical scavenging and antimicrobial activity of cornelian cherry (Cornus mas) fruit and leaf extracts. Hemijska Industrija, 69(4), 331–337. doi:10.2298/HEMIND140216046M
- Moldovan, B., & David, L. (2014). Influence of temperature and preserving agents on the stability of cornelian cherries anthocyanins. Molecules, 19(6), 8177–8188. doi:10.3390/molecules190811211
- Mustafa, A., & Turner, C. (2011). Pressurized liquid extraction as a green approach in food and herbal plants extraction: A review. Analytica Chimica Acta, 703, 8–18. doi:10.1016/j.aca.2011.07.018
- Nayak, B., Berrios, J. D. J., Powers, J. R., & Tang, J. (2011). Thermal degradation of anthocyanins from purple potato (cv. Purple Majesty) and impact on antioxidant capacity. Journal of Agricultural and Food Chemistry, 59, 11040–11049. doi:10.1021/jf201923a
- Oancea, A. M., Turturică, M., Bahrim, G., Râpeanu, G., & Stănciuc, N. (2017). Phytochemicals and antioxidant activity degradation kinetics during thermal treatments of sour cherry extract. LWT - Food Science and Technology, 82, 139–146. doi:10.1016/j.lwt.2017.04.026
- Pandey, A., Belwal, T., Sekar, K. C., Bhatt, I. D., & Rawal, R. S. (2018). Optimization of ultrasonic-assisted extraction (UAE) of phenolics and antioxidant compounds from rhizomes of Rheum moorcroftianum using response surface methodology (RSM). Industrial Crops and Products, 119, 218–225. doi:10.1016/j.indcrop.2018.04.019
- Pantelidis, G. E., Vasilakakis, M., Manganaris, G. A., & Diamantidis, G. (2007). Antioxidant capacity, phenol, anthocyanin and ascorbic acid contents in raspberries, blackberries, red currants, gooseberries and cornelian cherries. Food Chemistry, 102(3), 777–783. doi:10.1016/j.foodchem.2006.06.021
- Peron, D. V., Fraga, S., & Antelo, F. (2017). Thermal degradation kinetics of anthocyanins extracted from juçara (Euterpe edulis Martius) and “Italia” grapes (Vitis vinifera L.), and the effect of heating on the antioxidant capacity. Food Chemistry, 232, 836–840. doi:10.1016/j.foodchem.2017.04.088
- Rop, O., Mlcek, J., Kramarova, D., & Jurikova, T. (2010). Selected cultivars of cornelian cherry (Cornus mas L.) as a new food source for human nutrition. African Journal of Biotechnology, 9(8), 1205–1210. doi:10.5897/AJB09.1722
- Sólyom, K., Solá, R., Cocero, M. J., & Mato, R. B. (2014). Thermal degradation of grape marc polyphenols. Food Chemistry, 159, 361–366. doi:10.1016/j.foodchem.2014.03.021
- Stanciuc, N., Dumitrascu, L., Râpeanu, G., & Stanciu, S. (2011). γ-Glutamyl transferase inactivation in milk and cream: A comparative kinetic study. Innovative Food Science and Emerging Technology, 12, 56–61. doi:10.1016/j.ifset.2010.11.003
- Tong, S. Y., Davis, J. S., Eichenberger, E., Holland, T. L., & Fowler, V. G. (2015). Staphylococcus aureus infections: Epidemiology, pathophysiology, clinical manifestations and management. Clinical Microbiology, 28, 603–661. doi:10.1128/CMR.00134-14
- Tural, S., & Koca, I. (2008). Physico-chemical and antioxidant properties of cornelian cherry fruits (Cornus mas L.) grown in Turkey. Scientifica Horticultura, 116, 362–366. doi:10.1016/j.scienta.2008.02.003
- Wang, W., Jung, J., Tomasino, E., & Zhao, Y. (2016). Optimization of solvent and ultrasound-assisted extraction for different anthocyanin rich fruit and their effects on anthocyanin compositions. LWT - Food Science and Technology, 72, 229–238. doi:10.1016/j.lwt.2016.04.041