
 ?Mathematical formulae have been encoded as MathML and are displayed in this HTML version using MathJax in order to improve their display. Uncheck the box to turn MathJax off. This feature requires Javascript. Click on a formula to zoom.
ABSTRACT
Physical properties of Sukkari date powder (SDP) at different particle sizes, namely, moisture content, water activity, tapped and bulk densities, compressibility index, Hausner ratio, water absorption, and solubility indices, swelling capacity, and color parameters were experimentally determined. The SDP moisture sorption experiments were conducted using a dynamic vapor sorption instrument in the relative humidity range 10%–90% at 20, 40, and 60°C. Among the ten tested sorption models, the GAB and modified GAB models best fitted SDP sorption data. The monolayer moisture content decreased with increasing temperature. The differential enthalpy and entropy, and net integral enthalpy and entropy decreased consistently with increasing moisture content. The linear relationship between differential enthalpy and entropy confirmed the applicability of the compensation theory. The estimated values of the isokinetic and harmonic temperatures and the Gibbs free energy change revealed that the sorption process is non-spontaneous and enthalpy driven.
RESUMEN
En el presente estudio se analizaron experimentalmente las propiedades físicas del polvo del dátil Sukkari (SDP) en diferentes tamaños de partículas; las propiedades analizadas incluyen: contenido de humedad, actividad acuosa, densidad aparente y densidad compactada, índice de compresibilidad, ratio de Hausner, absorción de agua e índices de solubilidad, capacidad de hinchamiento y parámetros de color. Los experimentos de sorción de humedad SDP se llevaron a cabo utilizando un instrumento de sorción de vapor dinámico en el rango de 10% a 90% de humedad relativa y a temperaturas de 20, 40 y 60°C. Entre los 10 modelos de sorción probados, se constató que el modelo GAB y los modelos GAB modificados se adaptaron mejor a los datos de sorción SDP. El contenido de humedad de la monocapa disminuyó a medida que se elevó la temperatura. La entalpía y la entropía diferenciales, así como la entalpía y la entropía integrales netas, disminuyeron consistentemente al aumentar el contenido de humedad. La relación lineal entre la entalpía y la entropía diferenciales confirmó la aplicabilidad de la teoría de la compensación. Los valores estimados para las temperaturas isocinéticas y armónicas y el cambio de energía libre de Gibbs dieron cuenta de que el proceso de sorción no es espontáneo y es impulsado por la entalpía.
1. Introduction
Dates, the fruit of the date palm tree (Phoenix dactylifera L.), is a commercially valuable crop in several regions of the world. The fruit is a portion of nourishing natural food. The Sukkari date cultivar is the second widely produced and the most popular date cultivar in the Kingdom of Saudi Arabia. The relatively high sucrose content in Sukkari dates facilitates the drying and consequently conversion into date powder (Zhang et al., Citation2015).
Production of free-flow powder from dates is highly desirable as a stable and convenient nutritious ingredient for use in several food manufacturing applications such as extruded food products, dairy products, and several bakery formulations. Several drying methods were used to produce date powder including, freeze-drying, spray drying, drum drying, vacuum drying, and conventional oven drying (Farahnaky et al., Citation2016; Manickavasagan et al., Citation2015; Sablani et al., Citation2008; Sahari et al., Citation2008; Seerangurayar et al., Citation2017). Measurement of powder’s physical properties is essential in characterizing their flow properties and, consequently, their behavior during storage, handling, and processing (Barbosa-Cánovas et al., Citation2005). Notable physical features of powders include bulk and tapped density, moisture content and water activity, water absorption, water solubility indices, swelling capacity and flowability, and cohesiveness properties. Several types of research reported on the physical properties of food and date powders (Borchani et al., Citation2012; Farahnaky et al., Citation2016; Koc et al., Citation2011, Citation2014; Sablani et al., Citation2008; Seerangurayar et al., Citation2017).
Subjecting a food material to different temperatures and humidity allows determination of the moisture sorption thermodynamic properties from moisture sorption isotherms. The major moisture sorption thermodynamic properties are the differential enthalpy (qst) and entropy (Sd), total heat of sorption (Qst), and net integral enthalpy (Qin) and entropy (Sin) (Al-Mahasneh et al., Citation2010; Kaya & Kahyaoglu, Citation2005).
Adsorption of moisture by the solid phase releases energy known as the heat of adsorption. The net isosteric heat of sorption quantifies the binding strength of water to solid particles. It is also a measure of material stability during storage (Fasina et al., Citation1997). Binding or repulsive forces and the number of available sorption sites in the sorption system relate to the differential entropy (Togrul & Arsalan, Citation2006). Pascual-Pineda et al. (Citation2014) reported that the linear relationship between differential enthalpy and entropy could explain the physicochemical interaction between water and food.
During moisture adsorption, spreading pressure lower the liquid surface tension as a result of the difference in the energy of the liquid and solid phases. The net integral enthalpy (Qin) is a measure of the binding strength of water molecules to food particles, and the water molecules movement randomness and disorder is measured by the net integral entropy (Sin) (Alpizar-Reyes et al., Citation2017; Moreira et al., Citation2008).
Physical and moisture sorption properties are essential for the characterization of packaging requirements, suitable storage conditions and stability, and shelf life of date powder, in addition to the design of handling and processing unit operations. Hence, this work objectives were to experimentally determine physical properties of the Sukkari date powder (SDP) at different particle sizes, construct the moisture sorption isotherms at three temperatures 20, 40, and 60ºC in the equilibrium relative humidity range 10%–90% and determine monolayer moisture content, fit temperature-dependent moisture sorption models to experimental data, and evaluate the thermodynamic properties.
2. Materials and methods
2.1. Powder preparation
A local date factory provided the Sukkari date cultivar at Tamr stage of maturity (fully ripe, reduced moisture, edible) and an average moisture content of 25 ± 1.3 (kg water/kg date flesh). It was sorted, washed, and dried at room temperature (23ºC). The fruits were sliced to remove the seeds, then minced with a mechanical mincer (Motore Asincrono, Italy). Produced date paste was cut into thin slices and dried in a vacuum drying oven (Vacutherm model VT 6025, Heraeus Instrument, D- 63450, Hanauer, Germany) at 60 ± 1ºC until attaining constant weight. The dried date paste slices were then ground in a grinding machine (Gold mill, GM-203, Korea) to produce Sukkari date powder (SDP). The dried powder was immediately transferred into tightly closed glass jars and stored in a refrigerator at 5 ± 0.5ºC for further analysis.
2.2. Particle size distribution
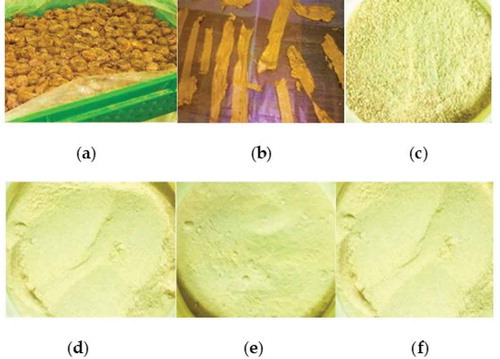
The weighted mean diameter of SDP particles as well as size distributions were determined using a vibratory sieve shaker (Analysette 3 Spartan model, Fritsch GmbH, Germany) with a series of nine sieves. The sieve sizes were 2000, 1000, 500, 355, 250, 180, 125, 90, 63 μm mesh, and a pan. A known amount of date powder was fed on top sieve and operated for 5 min, followed by recording the weight of samples retained on each sieve. Experiments were carried out in triplicate. The categories of particle size distributions were; coarse >355 μm, moderately fine (355–180 μm), fine (<180–125 mm), and very fine (<125 μm). Most of the Sukkari date powder (81.5%) was moderately fine particle size (355–180 μm). illustrates a digital image of the whole date fruit, dried date paste slices, and the Sukkari date powder (SDP) at various particle sizes categories
Figure 1. A digital image of: (a) whole Sukkari date fruit (b) dried date paste slices (c) coarse Sukkari date powder (SDP) (d) moderately fine SDP (e) fine SDP (f) very fine SDP.
Figura 1. Imagen digital de (a) fruta entera del dátil Sukkari (b) rebanadas de pasta de dátil seca (c) polvo de dátil Sukkari grueso (SDP) (d) SDP moderadamente fino (e) SDP fino (f) SDP muy fino
2.3. Moisture content and water activity
The SDP moisture content was determined using a vacuum oven (Vacutherm model VT 6025, Heraeus Instrument, D- 63450, Hanauer, Germany) at 60ºC. An Aqualab instrument (Model CX-2T, readability 1 mg, Decagon Devices Inc., Washington, USA) was used to measure water activity at 23ºC.
2.4. Bulk and tapped density
A tapped density instrument (Labhut AT 2000 Tap Density Tester (atlas), Labhut, UK) was used to measure the SDP bulk and tapped densities. The unsettled volume of a 100 ± 0.1 g of date powder in a graduated cylinder determined the bulk density (BD). The tapped volume of the same sample at 250 ± 15 taps per minute with a 3 ± 0.2 mm drop height until no significant difference in the volume (typically 2%), was determined. Tapped density (TD) is the sample mass per tapped volume.
2.5. Carr index and Hausner ratio
The compressibility index (CI %) -also known as Carr index (Carr, Citation1965)-, and Hausner ratio (HR) were evaluated from the bulk and tapped densities (BD and TD) of the SDP as: CI = ((TD-BD)/TD) X100% and HR = TD/BD, respectively.
2.6. Water absorption and solubility indices
The procedure of De Mesa et al. (Citation2009) with slight modification was used to determine the water absorption (WAI) and solubility (WSI) indices. One gram of SDP was added to 10 ml of distilled water in a 50 ml centrifuge tube and stirred with vortex, then left for 30 min at 20ºC, and centrifuged at 72576 RFC (g force) for 15 min. The supernatant was then carefully separated and dried overnight at 105 °C. WAI is the weight of the remaining gel as grams of gel per gram of original dry powder. WSI is the percentage of the mass of solids recovered from dried supernatant divided by the mass of the original dry powder.
2.7. Swelling capacity
The procedure of Robertson et al. (Citation2000), with some modification, was followed to determine the SDP swelling capacity (SC). Mass of 0.2 g of date powder was mixed with 10 ml distilled water and left for 18 h at 25ºC to hydrate. The final sample volume was a measure of the SC (ml/g).
2.8. Color evaluation
Date powder color parameters L*, a*, and b* of the CIE system were measured using Color Flex (Hunter Lab-Color Flex, Hunter Associates Laboratory, Inc-Reston, US). A white tile standard was the reference color. Other color parameters were chroma (C*), hue angle (Ho), and browning index (BI) following Pathare et al. (Citation2013).
2.9. Moisture sorption isotherms and models
The moderately fine powder (particle size 355–180 µm) was selected for the moisture sorption experiments because it represented 81.5% of the produced date powder mass. The adsorption of moisture at a different relative humidity (10–90%) applied in steps of 10%, and temperatures (20, 40 and 60ºC) was measured using a dynamic vapor sorption instrument (Aquadyne DVS, Quantachrome Instruments, Boynton Beach, FL, USA). Its two ultrasensitive microbalances can detect changes in mass during the adsorption process. The instrument was calibrated using dry microcrystalline cellulose (CRM #302) powder. In the experiment, the two ultrasensitive microbalances were used to place the pre-dried Sukkari date powder (SDP) samples (54 ± 1 mg each), and bone dried through purging. Data were, collected for mass, temperature, and humidity at 30s time intervals. Change in the mass of less than 0.001 mg/min, implied the achievement of equilibrium.
Ten popular moisture sorption models as shown in EquationEquations 1(1)
(1) –Equation10
(10)
(10) , were used to fit the experimental moisture adsorption data and evaluate their adequacy (Muzaffar & Kumar, Citation2016; Udomkun et al., Citation2015). The non-linear regression procedure (IBM SPSS Statistics, version 20, USA) was applied to fit moisture sorption equations to experimental data. The coefficient of determination (R2), the root means square error (RMSE), and the mean absolute percentage error (PE) were used to evaluate the goodness of fit and confirm the best model describing the sorption behavior. Estimation of the monolayer moisture content and the solution of the spreading pressure equation were carried out using the original GAB sorption model (EquationEquation 5
(5)
(5) ).
where X is the dry basis moisture content, aw is water activity, T is temperature, A, B and C are constants.
2.10. Differential enthalpy and entropy
The temperature dependence of the moisture sorption isotherms allows the derivation of the net isosteric heat of sorption or differential enthalpy (qst) as a differential molar quantity. The summation of the water heat of vaporization or condensation (Lw) and the qst define the total heat of sorption (Qst) (McLaughlin & Magee, Citation1998). Based on thermodynamic principles, the Clausius-Clapeyron EquationEquation (11)(11)
(11) expresses the relationship between the effect of temperature (Ta) on water activity (aw) at a constant dry basis moisture content (X) (Noshad et al., Citation2012):
where R is the universal gas constant (8.314 J/mol K).
If (qst) is assumed as independent of temperature, the integration of EquationEquation (11)(11)
(11) gives the following equation (Bahloul et al., Citation2008; Noshad et al., Citation2012):
where Sd is the differential entropy of sorption (J/mol K).
EquationEquation (12)(12)
(12) readily allows determination of qst and Sd from its slope and intercept, respectively.
2.11. Enthalpy-entropy compensation theory
Based on the compensation theory, a linear relationship exists between (qst) and (Sd) for a specific reaction as shown in EquationEquation 13(13)
(13) (Simal et al., Citation2007):
where Tβ and ∆Gβ are the isokinetic temperature, and the Gibbs free energy change, respectively. Water sorption is considered a spontaneous process if the Gibbs free energy change is negative (-∆Gβ) and a non-spontaneous process if it is positive (+∆Gβ) (Simal et al., Citation2007). Plotting qst versus Sd and applying linear regression allows the calculation of Tβ and ∆Gβ.
A parameter called harmonic mean temperature Thm (K) has been used to confirm the applicability of the compensation theory. Enthalpy–entropy compensation requires that Tβ ≠ Thm. If Tβ > Thm, the process is entropy-driven, otherwise it is not (McMinn et al., Citation2007). The following equation is used to estimate Thm:
where n is the number of isotherms, and I the number of terms.
2.12. Net integral enthalpy and entropy
Determination of the net integral enthalpy (Qin) is dependent on the determination of the spreading pressure (Φ) known as the surface potential representing the surface excess free energy that keeps the surface from spreading, and defined by the following equation (Moreira et al., Citation2008):
where KB is Boltzman constant, 1.38 × 10⁻²³ (J/K), Am is the surface area of the water molecule, 1.06 × 10⁻¹⁹ (m2), and Xm is the monolayer moisture content (kg water/kg dm).
Substitution of the GAB sorption model (EquationEquation 5(5)
(5) ) into EquationEquation (15)
(15)
(15) moreover, integrating results in the following expression for estimation of spreading pressure in the range aw = 0.05–1.0 (Lago et al., Citation2013; Tao et al., Citation2018):
where B and C are parameters of the GAB sorption model (EquationEquation 5(5)
(5) ). The net integral enthalpy is defined by EquationEquation 17
(17)
(17) at constant spreading pressure. Plotting ln(aw) against 1/Ta at constant Φ allows determination of Qin (Fasina et al., Citation1999).
The integral entropy Sin could be related to entrapment of water in microcapillaries and matrix collapse of the SDP. EquationEquation (18)(18)
(18) below was used to calculate the integral entropy Sin (Tao et al., Citation2018):
where represents the geometric mean water activity. Obtained values of Sin were then plotted against moisture content.
2.13. Statistical analysis
Analysis of variance (ANOVA) and Duncan’s multiple range test (α = 0.05) was used to determine the difference between means of the date powder physical properties using the SPSS statistics for windows (IBM SPSS Statistics, version 20, USA).
3. Results and discussion
3.1. Physical properties
shows the size distribution of SDP as a cumulative mass percentage passing and mass percentage retained as a function of particle size. About 81.5% of the date powder produced was moderately fine particle sizes (355–180 μm) and, 8.6%, 7.3% and, 1.4% were coarse (>355 μm), fine (<180–125 μm) and very-fine (<125 μm) particle sizes, respectively.
Figure 2. Cumulative mass percentage passing through sieves and mass percentage retained versus particle size of SDP.
Figura 2. Porcentaje de masa acumulada que pasa a través de tamices y porcentaje de masa retenido versus tamaño de partícula de SDP
shows the physical properties of SDP at different particle sizes. The bulk density (BD) and tapped density (TD) are both essential physical properties for characterization, handling, and processing of powder systems. Bulk density values were in the range 623.68–634.97 kg/m3, with no significant differences (P > .05) among all particle size categories of the SDP. The tapped density (TD) varied in the range 831.93–901.77 kg/m3 with the highest value (901.77 kg/m3) attained by the fine particles (<180–125 μm) and the lowest value (831.93 kg/m3) by the coarse particles (>355 μm). No significant differences (P > .05) were observed between coarse and moderately fine particles, and between fine and very fine particles. These results were within the ranges obtained for pitaya, pineapple, mango, and guava raw fruit powders (Saifullah et al., Citation2016).
Table 1. Physical properties of SDP at different particle sizes.
Tabla 1. Propiedades físicas de SDP a diferentes tamaños de partículas
The compressibility index (CI) and Hausner ratio (HR) both increased as the particle sizes were decreased and varied in the ranges of 24.15% to 30.12% for CI and 1.32–1.43 for HR. For CI, there was a significant difference (P < .05) as the particle size decreases from moderately fine to very fine. HR at different particle sizes showed no significant differences. The higher the compressibility of a bulk solid, the less flowable it is. CI and HR values for the date powder were comparable to data obtained for pitaya, pineapple, mango, and guava raw fruit powders (Saifullah et al., Citation2016). The flowability values for both CI and HR are in the ranges classified to be between passable and mediocre flowability powders (Jinapong et al., Citation2008). The sticky nature of the powder due to its high sugar content affects flowability values.
Among the essential physical properties which may affect flowability, stickiness, quality, and shelf life of powders are moisture content and water activity (Seerangurayar et al., Citation2017). The moisture content was in the range of 1.97 to 2.41 (% db), and it increased with decreasing particle size with no significant differences (P > .05) among the different particle sizes except for the very fine particle size. The water activity (aw) was in the range of 0.16–0.22, with no significant differences (P > .05) among different particle sizes. These low values of the moisture content and water activity is an indication of favorable stability of the produced date powder from a biochemical and microbiological standpoint. Watermelon, acai, and Jamun fruit powders showed similar results (Quek et al., Citation2007; Santhalakshmy et al., Citation2015; Tonon et al., Citation2009).
The water absorption index (WAI) varied in the range of 3.06–3.74 g gel/g dry powder for different particle sizes. It increased with decreasing particle size with significant differences (P < .05). The water solubility index (WSI) was in the range of 30.24% to 44.10%, and it increased with decreasing particle size with significant differences between various particle sizes. Results were comparable to those reported for raspberry powders (Si et al., Citation2016). The property of swelling capacity (SC) indicates to what extent the powder samples swell as water is absorbed. SC spanned in the range 2.08–3.14 ml/g dm and increased with decreasing particle size with no significant differences between particle sizes.
Color is a critical quality factor related directly to the acceptability of food products and is an essential physical property to report for food powders. The lightness (L*) increased with decreasing particle size and was in the range 64.56–69.26. The color parameter a* (greenness–redness) varied in the range 4.51–5.44, with a significant difference between different particle size categories. The parameter b* (blueness–yellowness) showed no significant difference (P > .05) between the different particle sizes and varied in the range 24.44 − 27.09, with very fine particles attaining the highest value.
Aleid et al. (Citation2014), reported comparable values of the color parameters L* and b* for the whole Sukkari date fruit surface; however, a* values were higher. Chroma (C*) values increased with decreasing particle size and was in the range 24.96–27.45 with significant differences between the paired categories coarse and moderate and fine and very fine. Chroma values are a measure of the degree of color saturation and are proportional to the strength of the color, and color intensity perceived by humans is higher at higher values of chroma (Pathare et al., Citation2013).
The hue angle (H°) refers to the qualitative attribute of color. Accordingly, colors are traditionally defined, as reddish, greenish, and so on. The hue angle (Ho) spanned in the range 78.30–80.55, with the highest value for very fine particle size powder. It defines the difference of a specific color concerning grey color with the same lightness (Pathare et al., Citation2013). The hue angle range of the date powder represents a yellow hue. The browning index (BI) evaluated the extent of browning (Quintas et al., Citation2007). In this work, BI values varied in the range 52.29–55.95, with no significant differences (P > .05) among all particle sizes except the fine particle size.
3.2. Moisture sorption isotherms and models
shows the moisture sorption isotherms of SDP at temperatures 20, 40, and 60°C (±0.2). The curves are of type III with a J shape, which, in general, for high sugar food. At constant temperature, moisture adsorption increased with increasing water activity up to aw = 0.81, then almost coincided after that. The variation of the equilibrium moisture content (EMC) with temperature in the water activity range aw = 0.8–0.88 was minimal. The date powder absorbed less moisture (0.00 to about 0.17 kg water/kg dm) in the water activity range aw = 0.1–0.6 and absorbed much higher moisture (0.17 to about 0.88 kg water/kg dm) in the water activity range aw = 0.6–0.88. Several researchers reported similar results and referred the behavior to the characteristics of high sugar foods, particularly their composition and solubility of sugars (Noshad et al., Citation2012; Rodriguez-Bernal et al., Citation2015). Borojo and orange juice powders showed similar results (Rodriguez-Bernal et al., Citation2015; Sormoli & Langrish, Citation2015).
Figure 3. Experimental moisture adsorption isotherms of SDP at different temperatures and prediction lines of MGAB model.
Figura 3. Isotermas experimentales de adsorción de humedad de SDP a diferentes temperaturas y líneas de predicción del modelo MGAB
lists the constants of the ten tested moisture sorption models and the corresponding statistical parameters. Based on the goodness of fit criteria (the highest R2, lowest RMSE, and PE ≤10), the modified GAB (MGAB) model in the temperature range 20–60ºC and the original GAB model at the three temperatures 20, 40, and 60ºC were the best models for fitting the experimental moisture sorption data of SDP throughout the entire range of water activity (0.1–0.9). As depicted in , the MGAB model adequately predicted the moisture sorption experimental data for the tested temperatures 20, 40, and 60ºC.
Table 2. Constants and statistical parameters of the moisture sorption isotherm models used to fit Sukkari date powder experimental data.
Tabla 2. Constantes y parámetros estadísticos de los modelos de isotermas de sorción de humedad utilizados para ajustar los datos experimentales de polvo de dátil Sukkari
The SDP monolayer moisture content (Xm) values determined using the original GAB model (EquationEquation 5(5)
(5) ) were, 0.092, 0.084, and 0.079 (kg water/kg dm) at 20, 40 and 60ºC, respectively. Values were comparable to Xm of unroasted carob and blueberry fruit powders (Cervenkaa et al., Citation2019; Tao et al., Citation2018). Xm linearly decreased with T as represented by EquationEquation 19
(19)
(19) .
3.3. Differential enthalpy and entropy
The differential enthalpy (qst) was calculated from EquationEquation (12)(12)
(12) and plotted in as a function of moisture content in the range 0.05–0.50 (kg water/kg dm). As moisture content increased, qst decreased consistently. At the lowest moisture content (0.05 kg water/kg dm) SDP had the largest qst (9.366 kJ/mol), and the lowest qst (0.262 kJ/mol) at the highest moisture content (0.5 kg water/kg dm). These values are comparable to values reported for spray-dried pure orange juice powder (Sormoli & Langrish, Citation2015), spray-dried mango mix powders (Cano-Higuita et al., Citation2015), and pineapple pulp powder (Gabas et al., Citation2007). As shown in , the isosteric (total) heat of sorption (Qst) also consistently decreased with increasing moisture content and approached the heat of vaporization of pure water (Lw = 43.35 kJ/kg at 40ºC) at the highest moisture content. The following equation adequately represented the dependence of the SDP differential enthalpy (qst) on moisture content (X):
As shown in the differential entropy (Sd) consistently decreased with increasing moisture content from 20.412 (J/mol K) at 0.05 (kg water/kg dm) to −0.758 (J/mol K) at 0.5 (kg water/kg dm). Similar reported observations were spray dried tomato pulp (Goula et al., Citation2007), and corn stover fractions (Igathinathane et al., Citation2007).
Figure 4. Net isosteric (qst) and isosteric (total, Qst) heats of sorption (a) and differential entropy (Sd) of SDP (b) as a function of dry basis moisture content (X).
Figura 4. Calores de sorción (a) isostérico (qst) e isostérico (total, Qst) netos y entropía diferencial (Sd) de SDP (b) en función del contenido de humedad en base seca (X)
3.4. Enthalpy‐entropy compensation theory
The SDP differential enthalpy (qst) varied linearly with differential entropy (Sd), as shown in EquationEquation (21)(21)
(21) , indicating the validity of the compensation theory within the studied range of moisture contents.
From EquationEquation (21)(21)
(21) , the isokinetic temperature (Tβ) equals 425.93 K, and Gibbs free energy change ∆Gβ is equal to 0.772 (kJ/mol). The harmonic mean temperature (Thm) calculated from EquationEquation 14
(14)
(14) is 312.23 K. Since Tβ > Thm the moisture sorption process is enthalpy driven. The positive ∆Gβ value of the SDP indicates that the adsorption process is non-spontaneous. Similar reported behavior of enthalpy-driven and non-spontaneous sorption process for unroasted carob powder (Cervenkaa et al., Citation2019) and oatmeal biscuit and flakes (McMinn et al., Citation2007).
3.5. Net integral enthalpy and entropy
According to EquationEquation (16)(16)
(16) , calculation of the spreading pressure (Φ) of the SDP was carried out, and depicted its dependence on water activity at different temperatures. At a constant temperature, Φ increased with increasing aw, and at constant aw it increased with decreasing temperature. Similar behavior for oat-meal biscuit, oat flakes, quince, and pestil was reported (Kaya & Kahyaoglu, Citation2005; McMinn et al., Citation2007; Noshad et al., Citation2012). At high spreading pressures, water molecules tend to confer a high level of adaptability to an active site, and consequently, an increased product hygroscopicity.
Figure 5. Variation of spreading pressure with water activity and temperature of SDP.
Figura 5. Variación de la presión de propagación con la actividad del agua y la temperatura de SDP
EquationEquation 17(17)
(17) was used to calculate the SDP net integral enthalpy (Qin) by plotting ln(aw) against 1/Ta at constant Φ. In the integral enthalpy decreased with increasing moisture content from a value of 11.51 (kJ/mol) at a moisture content of 0.027 (kg water/kg dm) to 0.40 (kJ/mol) at 0.749 (kg water/kg dm). The following exponential equation fitted the data very well:
Figure 6. Net integral enthalpy (Qin) and net integral entropy (Sin) as a function of dry basis moisture content (X) of SDP.
Figura 6. Entalpía integral neta (Qin) y entropía integral neta (Sin) en función del contenido de humedad en base seca (X) del SDP
The highest value of the integral enthalpy at the lowest moisture content may be explained by the swelling of the date powder caused by moisture adsorption on powder surface accessible sites. Consequently, opening new high energy locations and more water binding. At higher moisture content above 0.15 (kg water/kg dm), much fewer locations were accessible leading to much lower values of Qin. Investigations on food powders reported a similar explanation (Cervenkaa et al., Citation2019; Farahnaky et al., Citation2016).
shows the relationship between the net integral entropy (Sin) estimated from EquationEquation (18)(18)
(18) , with moisture content (X). The Sin of SDP decreased with increasing moisture content from a maximum value of 13.81 (J/mol K) at moisture content 0.027 (kg water/kg dm) to a minimum value of 1.21 (J/mol K) at moisture content 0.749 (kg water/kg dm). The following power type equation adequately fitted variation of Sin with moisture content:
The integral entropy of winged-been seed and gari (Fasina et al., Citation1999), and defatted sesame meal (Al-Mahasneh et al., Citation2007) followed similar behavior.
4. Conclusions
The Sukkari date powder was predominantly (81.5%) moderately fine particle size (355–180 μm). Most of the measured physical properties of the date powder were comparable to published data of several food powders.
Moisture adsorption isotherms of the moderately fine particle size SDP was determined at three temperatures 20, 40, and 60°C and equilibrium relative humidity in the range 10%–90% (i.e aw in the range 0.1–0.9). The original and temperature-dependant GAB equations best fitted the experimental moisture adsorption data. The monolayer moisture content (Xm) estimated from the original GAB model decreased linearly with increasing temperature from 0.092 (kg water/kg dm) at 20°C to 0.079 (kg water/kg dm) at 60°C. As moisture content increased both the differential enthalpy and entropy decreased consistently. The linear relationship between the differential enthalpy and entropy confirmed the validity of the compensation theory. The moisture sorption process was enthalpy driven and non-spontaneous. Both the integral enthalpy and entropy decreased with increasing moisture content, and the behaviour may be related to the swelling that may occur during the moisture adsorption process. Further work is needed to characterize packaging requirements, suitable storage conditions, and shelf life of date powder.
Nomenclature
| (aw)* | = | Geometric mean water activity |
| a*, b*, L* | = | CIE System color parameters |
| A, B, C | = | Parameters of temperature incorporated modified sorption models |
| Am | = | Surface area of the water molecule, 1.06 × 10⁻¹⁹ (m2) |
| aw | = | Water activity |
| BD | = | Bulk density (kg/m3) |
| BI | = | Browning index |
| CI | = | Compressibility index (%) |
| D, K | = | Parameters of GAB sorption model |
| db | = | Dry basis |
| dm | = | Dry matter |
| HR | = | Hausner ratio |
| i | = | Number of terms |
| KB | = | Boltzman constant, 1.38 × 10⁻²³ (J/K) |
| Lw | = | Heat of vaporization or condensation of water (J/mol) |
| N | = | Number of observations |
| n | = | Number of isotherms |
| Qin | = | Integral enthalpy (kJ/mol) |
| Qst | = | Isosteric (total) heat of sorption (kJ/mol) |
| qst | = | Net isosteric heat of sorption (kJ/mol) |
| R | = | Universal gas constant (8.314 J/mol K) |
| R2 | = | Coefficient of determination |
| SC | = | Swelling capacity (ml/g) |
| Sd | = | Differential entropy of sorption (J/mol K) |
| Sin | = | Net integral entropy (J/mol K) |
| T | = | Temperature (°C) |
| Ta | = | Absolute temperature (K) |
| TD | = | Tapped density (kg/m3) |
| Thm | = | Harmonic mean temperature (K) |
| Tβ | = | Isokinetic temperature (K) |
| WAI | = | Water absorption index (g gel/g dry powder) |
| WSI | = | Water solubility index (%) |
| X | = | Moisture content (kg water/kg dm) |
| Xexp | = | Experimental moisture content (kg water/kg dm) |
| Xm | = | Monolayer moisture content (kg water/kg dm), Xm=A in EquationEquation 5 |
| Xpred | = | Predicted moisture content (kg water/kg dm) |
| Yexp,i | = | Experimental value for instant i |
| Ypred,i | = | Predicted value for instant i for the same instant N |
| ΔGβ | = | Gibbs free energy change (kJ/mol) |
| Φ | = | Spreading pressure (J/m2) |
Disclosure statement
No potential conflict of interest was reported by the authors.
Additional information
Funding
References
- Aleid, S. M., Hassan, B. H., Almaiman, S. A., Al-Kahtani, S. H., & Ismail, S. M. (2014). Microbial loads and physicochemical characteristics of fruits from four Saudi date palm tree cultivars: Conformity with applicable date standards. Food and Nutrition Sciences, 5(4), 316–327. https://doi.org/10.4236/fns.2014.54038
- Al-Mahasneh, M. A., Rababeh, T. M., Al-Udatt, M. H., & Yang, W. (2010). Moisture sorption thermodynamics of fractionated sesame hulls (Sesamum Indicum L.). Journal of Food Process Engineering, 33(5), 802–819. https://doi.org/10.1111/j.1745-4530.2008.00306.x
- Al-Mahasneh, M. A., Rababeh, T. M., & Yang, W. (2007). Moisture sorption thermodynamics of defatted sesame meal (DSM). Journal of Food Engineering, 81(4), 735–774. https://doi.org/10.1016/j.jfoodeng.2007.01.010
- Alpizar-Reyes, E., Carrillo-Navas, H., Romero-Romero, R., Varela-Guerrero, V., Alvarez-Ramirez, J., & Perez-Alonoso, C. (2017). Thermodynamic sorption properties and glass transition temperature of tamarind seed mucilage (Tamarindus indica L.). Food and Bioproducts Processing, 101, 166–176. https://doi.org/10.1016/j.fbp.2016.11.006
- Bahloul, N., Boudhrioua, N., & Kechaou, N. (2008). Moisture desorption–adsorption isotherms and isosteric heats of sorption of Tunisian olive leaves (Olea Europaea L.). Industrial Crops and Products, 28(2), 162–176. https://doi.org/10.1016/j.indcrop.2008.02.003
- Barbosa-Cánovas, G. V., Ortega-Rivas, E., Juliano, P., & Yan, H. (2005). Food powders: Physical properties, processing, and functionality. Kluwer Academic/Plenum Publishers.
- Borchani, C., Besbes, S., Masmoudi, M., Bouaziz, M. A., Blecker, C., & Attia, H. (2012). Influence of oven drying temperature on physicochemical and functional properties of date fibre concentrates. Food Bioprocess Technology, 5(5), 1541–1551. https://doi.org/10.1007/s11947-011-0549-z
- Cano-Higuita, D. M., Villa-Vélez, H. A., Telis-Romero, J., Váquiro, H. A., & Telis, V. R. N. (2015). Influence of alternative drying aids on water sorption of spray dried mango mix powders: A thermodynamic approach. Food and Bioproducts Processing, 93, 19–28. https://doi.org/10.1016/j.fbp.2013.10.005
- Carr, R. L. (1965). Evaluating flow properties of solids. Chemical Engineering-New York, 72, 163–168.
- Cervenka, L., Stepien, A., Fruhbauerova, M., Velichova, H., & Witczak, M. (2019). Thermodynamic properties and glass transition temperature of roasted and unroasted carob (Ceratonia siliqua L.) powder. Food Chemistry, 300, 125208. https://doi.org/10.1016/j.foodchem.2019.125208
- De Mesa, N. J. E., Alavi, S., Singh, N., Shi, Y., Dogan, H., & Sang, Y. (2009). Soy protein-fortified expanded extrudates: Baseline study using normal corn starch. Journal of Food Engineering, 90(2), 262–270. https://doi.org/10.1016/j.jfoodeng.2008.06.032
- Farahnaky, A., Mansoori, N., Majzoobi, M., & Badii, F. (2016). Physicochemical and sorption isotherm properties of date syrup powder: Anti-plasticizing effect of maltodextrin. Food and Bioproducts Processing, 98, 133–141. https://doi.org/10.1016/j.fbp.2016.01.003
- Fasina, O., Ajibola, O., & Tyler, R. (1999). Thermodynamics of moisture sorption in winged bean seed and gari. Journal of Food Process Engineering, 22(6), 405–418. https://doi.org/10.1111/jfpe.1999.22.issue-6
- Fasina, O., Sokhansanj, S., & Tyler, R. (1997). Thermodynamics of moisture sorption in alfalfa pellets. Drying Technology, 15(5), 1553–1570. https://doi.org/10.1080/07373939708917307
- Gabas, A. L., Telis, V. R. N., Sobral, P. J. D. A., & Telis-Romero, J. (2007). Effect of maltodextrin and arabic gum in water vapor sorption thermodynamic properties of vacuum dried pineapple pulp powder. Journal of Food Engineering, 82(2), 246–252. https://doi.org/10.1016/j.jfoodeng.2007.02.029
- Goula, A. M., Karapantsios, T. D., Achilias, D. S., & Adamopoulos, K. G. (2007). Water sorption isotherms and glass transition temperature of spray dried tomato pulp. Journal of Food Engineering, 85(1), 73–83. https://doi.org/10.1016/j.jfoodeng.2007.07.015
- Igathinathane, C., Womac, A. R., Sokhansanj, S., & Pordesimo, L. O. (2007). Moisture sorption thermodynamic properties of corn stover fractions. Transactions of the ASABE, 50(6), 2151–2160. https://doi.org/10.13031/2013.24075
- Jinapong, N., Suphantharika, M., & Jamong, P. (2008). Production of instant soy milk powders by ultrafiltration, spray drying, and fluidized bed agglomeration. Journal of Food Engineering, 84(2), 194–205. https://doi.org/10.1016/j.jfoodeng.2007.04.032
- Kaya, S., & Kahyaoglu, T. (2005). Thermodynamic properties and sorption equilibrium of pestil (grape leather). Journal of Food Engineering, 71(2), 200–207. https://doi.org/10.1016/j.jfoodeng.2004.10.034
- Koc, B., Sakin-Yilmazer, M., Kaymak-Ertekin, F., & Balkir, P. (2014). Physical properties of yogurt powder produced by spray drying. Journal of Food Science and Technology, 51(7), 1377–1383. https://doi.org/10.1007/s13197-012-0653-8
- Koc, M., Koc, B., Susyal, G., Sakin-Yilmazer, M., Kaymak-Ertekin, F., & Bağdatlioğlu, N. (2011). Functional and physicochemical properties of whole egg powder: Effect of spray drying conditions. Journal of Food Science and Technology, 48(2), 141–149. https://doi.org/10.1007/s13197-010-0159-1
- Lago, C. C., Liendo-Cardenas, M., & Norina, C. P. Z. (2013). Thermodynamic sorption properties of potato and sweet potato flakes. Food and Bioproducts Processing, 91(4), 389–395. https://doi.org/10.1016/j.fbp.2013.02.005
- Manickavasagan, A., Thangavel, K., Dev, S. R. S., Aniesrani, D. S., Nambi, E., Orsat, V., & Raghavan, G. S. V. (2015). Physicochemical characteristics of date powder produced in a pilot-scale spray dryer. Drying Technology, 33(9), 1114–1123. https://doi.org/10.1080/07373937.2015.1014045
- McLaughlin, C. P., & Magee, T. R. A. (1998). The determination of sorption isotherm and the isosteric heats of sorption for potatoes. Journal of Food Engineering, 35(3), 267–280. https://doi.org/10.1016/S0260-8774(98)00025-9
- McMinn, W. A. M., McKee, D. J., & Magee, T. R. A. (2007). Moisture adsorption behavior of oatmeal biscuit and oat flakes. Journal of Food Engineering, 79(2), 481–493. https://doi.org/10.1016/j.jfoodeng.2006.02.009
- Moreira, R., Chenlo, F., Torres, M. D., & Vallejo, N. (2008). Thermodynamic analysis of experimental sorption isotherms of loquat and quince fruits. Journal of Food Engineering, 88(4), 514–521. https://doi.org/10.1016/j.jfoodeng.2008.03.011
- Muzaffar, K., & Kumar, P. (2016). Moisture sorption isotherms and storage study of spray dried tamarind pulp powder. Powder Technology, 291, 322–327. https://doi.org/10.1016/j.powtec.2015.12.046
- Noshad, M., Mohebbi, M., Shahidi, F., & Mortazavi, S. A. (2012). Effect of osmosis and ultrasound pretreatment on the moisture adsorption isotherms of quince. Food and Bioproducts Processing, 90(2), 266–274. https://doi.org/10.1016/j.fbp.2011.06.002
- Pascual-Pineda, L. A., Flores-Andrade, E., Alamilla-Beltran, L., Chanona-Pérez, J. J., Beristain, C. I., Gutiérrez-López, G. F., & Azuara, E. (2014). Micropores and their relationship with carotenoids stability: A new tool to study preservation of solid foods. Food and Bioprocess Technology, 7(4), 1160–1170. https://doi.org/10.1007/s11947-013-1162-0
- Pathare, B. P., Opara, U. L., & Al-Said, F. A. (2013). Colour measurement and analysis in fresh and processed foods: A review. Food and Bioprocess Technology, 6(1), 36–60. https://doi.org/10.1007/s11947-012-0867-9
- Quek, S. Y., Chok, N. K., & Swedlund, P. (2007). The physicochemical properties of spray-dried watermelon powders. Chemical Engineering and Processing, 46(5), 386–392. https://doi.org/10.1016/j.cep.2006.06.020
- Quintas, M. A. C., Brabdao, T. R. S., & Silva, C. L. M. (2007). Modeling colour changes during the caramelization reaction. Journal of Food Engineering, 83(4), 483–491. https://doi.org/10.1016/j.jfoodeng.2007.03.036
- Robertson, J. A., De Monredon, F. D., Dysseler, P., Guillon, F., Amado, R., & Thibault, J. F. (2000). Hydration properties of dietary fibre and resistant starch: A European collaborative study. Lebensmittel-Wis-senschaft und Tecnologie, 33(2), 72–79. https://doi.org/10.1006/fstl.1999.0595Actions
- Rodriguez-Bernal, J. M., Flores-Andrade, E., Lizarazo-Morales, C., Bonilla, E., Pascual-Pineda, L. A., Gutierrez-Lopez, G., & Quintanilla-Carvajal, M. X. (2015). Moisture adsorption isotherms of the borojo fruit (Borojoa patinoi. Cuatrecasas) and gum Arabic powders. Food and Bioproducts Processing, 94, 187–198. https://doi.org/10.1016/j.fbp.2015.03.004
- Sablani, S. S., Shrestha, A. K., & Bhandari, B. R. (2008). A new method of producing date powder granules: Physicochemical characteristics of powder. Journal of Food Engineering, 87(3), 416–421. https://doi.org/10.1016/j.jfoodeng.2007.12.024
- Sahari, M., Hamidi-Esfehani, Z., & Samadlui, H. (2008). Optimization of vacuum drying characteristics of date powder. Drying Technology, 26(6), 793–797. https://doi.org/10.1080/07373930802046476
- Saifullah, M., Yusof, Y. A., Chin, N. L., & Aziz, M. G. (2016). Physicochemical and flow properties of fruit powder and their effect on the dissolution of fast dissolving fruit powder tablets. Powder Technology, 301, 396–404. https://doi.org/10.1016/j.powtec.2016.06.035
- Santhalakshmy, S., Bosco, S. J. D., Francis, S., & Sabeena, M. (2015). Effect of inlet temperature on physicochemical properties of spray-dried jamun fruit juice powder. Powder Technology, 274, 37–43. https://doi.org/10.1016/j.powtec.2015.01.016
- Seerangurayar, T., Manickavasagan, A., Al-Ismaili, A. M., & Al-Mulla, Y. A. (2017). Effect of carrier agents on flowability and microstructural properties of foam-mat freeze-dried date powder. Journal of Food Engineering, 215, 33–43. https://doi.org/10.1016/j.jfoodeng.2017.07.016
- Si, X., Chen, O., Bi, J., Wu, X., Yi, J., Zhou, L., & Li, Z. (2016). Comparison of different drying methods on the physical properties, bioactive compounds and antioxidant activity of raspberry powders. Journal of the Science of Food and Agriculture, 96(6), 2055–2062. https://doi.org/10.1002/jsfa.2016.96.issue-6
- Simal, S., Femenia, A., Castell-Palou, A., & Rossello, C. (2007). Water sorption thermodynamic properties of pineapple. Journal of Food Engineering, 80(4), 1293–1301. https://doi.org/10.1016/j.jfoodeng.2006.10.001
- Sormoli, M. E., & Langrish, T. A. G. (2015). Moisture sorption isotherms and net isosteric heat of sorption for spray-dried pure orange juice powder. LWT-Food Science and Technology, 62(1), 875–882. https://doi.org/10.1016/j.lwt.2014.09.064
- Tao, Y., Wu, Y., Yang, J., Jiang, N., Wang, Q., Chu, D. T., Han, Y., & Zhou, J. (2018). Thermodynamic sorption properties, water plasticizing effect and particle characteristics of blueberry powder produced from juices, fruits and pomaces. Powder Technology, 323, 208–218. https://doi.org/10.1016/j.powtec.2017.09.033
- Togrul, H., & Arsalan, N. (2006). Moisture sorption behavior and thermodynamic characteristics of rice stored in a chamber under controlled humidity. Biosystems Engineering, 95(2), 181–195. https://doi.org/10.1016/j.biosystemseng.2006.06.011
- Tonon, R. V., Brabet, C., Pallet, D., Brat, P., & Hubinger, M. D. (2009). Physicochemical and morphological characterization of acai (Euterpe oleraceae Mart.) powder produced with different carrier agents. International Journal of Food Science and Technology, 44(10), 1950–1958. https://doi.org/10.1111/ifs.2009.44.issue-10
- Udomkun, P., Argyropoulos, D., Nagle, M., Mahayothee, B., & Muller, J. (2015). Sorption behavior of papayas as affected by compositional and structural alteration from osmotic pretreatment and drying. Journal of Food Engineering, 157, 14–23. https://doi.org/10.1016/j.jfoodeng.2015.01.022
- Zhang, C.-R., Aldosari, S. A., Vidyasagar, P. S. P. V., Shukla, P., & Nair, M. G. (2015). Determination of the variability of sugars in date fruit varieties. Journal of Plantation Crops, 43(1), 53–61.