
ABSTRACT
In this study the volatile composition of six samples of dark chocolates varying in the cocoa roasting time (30.5, 34.5 and 38.5 min) and geographical origin (Ecuador and Ghana) was characterized by headspace solid-phase microextraction (HS-SPME) followed by gas chromatography-mass spectrometry (GC-MS). One hundred and twenty-one different compounds were identified using a carboxen/polydimethylsiloxane (CAR-PDMS) fiber comprising acids, alcohols, aldehydes, alkanes, esters, furans, ketones, nitrogen compounds, pyran derivatives, pyrazines, pyrroles and thiazoles. The effect of roasting time on the volatile composition of chocolates depended on their geographical origin. Principal component analysis (PCA) was applied to volatile composition of the six dark chocolate samples. Eight different groups of compounds were established according to the position of the aroma compounds on the PC plot and accordingly to variation among samples. Therefore, volatile compounds that appeared or disappeared during roasting of cocoa from each origin or both origins were identified.
RESUMEN
En este estudio, la composición volátil de seis muestras de chocolate negro con distinto tiempo de tostado del cacao (30.5, 34.5 y 38.5 min) y origen geográfico (Ecuador y Ghana), se caracterizaron con micro extracción en fase sólida en el espacio de cabeza (HS-SPME), seguida de cromatografía de gases-espectrometría de masas (GC-MS). Se identificaron ciento veintiún compuestos diferentes utilizando una fibra de carboxeno-polidimetilsiloxano (CAR-PDMS) englobando ácidos, alcoholes, aldehídos, alcanos, ésteres, furanos, cetonas, compuestos nitrogenados, derivados de piranos, pirazinas, pirroles y tiazoles. Se demostró que el efecto del tiempo de tostado sobre la composición volátil de los chocolates depende de su origen geográfico. El análisis de componentes principales (PCA) se utilizó para valorar la composición volátil de las seis muestras de chocolate negro. Se establecieron ocho grupos de compuestos de acuerdo con la posición de éstos en el gráfico de componentes principales, de acuerdo a la variación entre las muestras. Así, se identificaron compuestos volátiles que aparecían o desaparecían durante el tostado del cacao para cada origen o ambos orígenes geográficos.
1. Introduction
Chocolate is one of the most appealing foods world-wide due to its organoleptic properties, and has traditionally been consumed mainly for its unique taste and flavour. The secret of the great popularity of chocolate flavour resides mainly in its volatile aromatic fraction, with flavour being one of the most important criteria for quality evaluation of chocolate (Hernández & Rutledge, Citation1994). Volatile compounds are strongly correlated with the characteristic aroma of chocolate (Cambrai et al., Citation2010; Toker et al., Citation2020). The aroma of chocolate is related to cocoa bean genotype, each variety having unique potential flavour traits (Bailey et al., Citation1962; Clapperton et al., Citation1994). But cocoa bean growing conditions (climate, the amount and timing of sunshine, soil conditions, ripening or harvesting) and manufacturing process (fermentation, drying, roasting and conching conditions) also affect and contribute to the final flavour of chocolate (Clapperton et al., Citation1994; Counet et al., Citation2004; Jinap et al., Citation1995; Kattenberg & Kemmink, Citation1993; Kongor et al., Citation2016; Luna et al., Citation2002). Furthermore, other studies also showed the impact of pod storage (PS) on the flavour potential of cocoa beans (Afoakwa et al., Citation2011b; Hinneh et al., Citation2018).
Fermentation of cocoa beans, lasting from 1 to 3 days for Criollo beans and from 5 to 6 days for Forastero beans, is of ethanolic, acetic and lactic type, with the consequent acidification of beans’ pH (Afoakwa et al., Citation2008). The final pH of beans is crucial for optimum flavour formation and beans with a final pH between 4.75 and 5.19 are considered to be well-fermented (Biehl & Voigt, Citation1999). During this stage of the process, there is a significant increase in volatile compounds (alcohols, organic acids and aldehydes) and also some aroma precursors (free amino acids, short-chain peptides and reducing sugars) develop (Misnawi et al., Citation2003; Schwan & Wheals, Citation2004). Unfermented cocoa beans do not deliver the characteristic cocoa aroma when roasted, while off-flavours are generated in over fermented cocoa beans (Fowler, Citation1999; Reineccius, Citation2006). Additionally, it is of primary importance that beans must have reached maturity; otherwise, no other processing steps can produce the desired flavours. Beans are dried after fermentation, which is also an important step in the process for flavour precursors to develop. During drying, moisture is removed to about 7–8%. The Maillard reaction takes place and the first intermediates of the reaction (Amadori compounds of the reaction of free amino acids and glucose) are generated (Heinzler & Eichner, Citation1992). Indicators of well-dried beans are: good brown colour, low astringency and bitterness, absence of off-flavours such as smoky notes and excessively acidity (Afoakwa et al., Citation2008).
Roasting is the most important technological operation during chocolate processing and is responsible for the formation of the characteristic chocolate flavour. Aldehydes and pyrazines are the major compounds formed through the Maillard reaction and Strecker degradation of amino acids and sugars (Dimick & Hoskin, Citation1981; Heinzler & Eichner, Citation1992). The roasting process not only generates new volatile compounds but also involves the decrease and loss of undesired compounds that affect the final chocolate flavour, such as acetic, oxalic, citric, succinic and lactic acids (Jinap & Dimick, Citation1991; Jinap et al., Citation1998; Keeney, Citation1972). The loss of this volatile compounds has an impact on reducing acidity and astringency of the cocoa, which has a positive effect in the final flavour of the chocolate (Aprotosoaie et al., Citation2016).
Cocoa beans are roasted at temperatures between 120°C and 150°C and the extent of the chemical changes depends mainly on the temperature and time applied during the process. Cocoa beans that are over-roasted due to an excess in temperature and roasting time, develop flavours with a significant burnt and coffee-like taste, diminishing the quality of the final product.
Conching is the next stage in the chocolate manufacturing process that plays a role in determining final chocolate flavour traits. As in the roasting process, flavour development during conching depends on the interaction between time and temperature. During conching no new key odorants are formed; however, some compounds increase significantly and others are lost by evaporation especially off-flavours (Counet et al., Citation2002; J. Hoskin & Dimick, Citation1983); thus, the final flavour of the chocolate may be improved.
Therefore, the characteristic aroma of cocoa and chocolate products is due to a complex mixture of several different compounds present at variable concentration (from mg kg−1 to ng kg−1), and each of them has its own chemical properties and makes its particular contribution to the whole aroma (Frauendorfer & Schieberle, Citation2006; Plumas et al., Citation1996). To fully understand the variations in chocolate flavour the aim of this study is to characterize the effect of different roasting time on volatile flavour compounds of dark chocolates with different geographical origin of cocoa by gas chromatography-mass spectrometry (GC-MS) previous to headspace-solid phase microextraction (HS-SPME).
2. Materials and methods
2.1. Preparation of samples
Two groups of three dark chocolate samples with different geographical origin Forastero cocoa beans (Ecuador and Ghana), varying in roasting conditions (three roasting times: R1 = 30.5, R2 = 34.5 and R3 = 38.5 min) and conched during 24 hours were used in this study. Chocolates containing 510 g kg−1 (w/w) of cocoa were prepared in a chocolate factory (Chocolates Simón Coll, S.A. from Sant Sadurní d’Anoia, Barcelona, Spain) following a traditional chocolate manufacturing process (Beckett, Citation2008) as described in a previous study (Torres-Moreno et al., Citation2012). First, cocoa beans were roasted in a ball roaster. After roasting, beans were submitted to winnowing and the cocoa nibs obtained were milled. The cocoa mass obtained was mixed with sucrose and then refined using a five-roll refiner to reduce particle size. The refined mixture was melted at 40–45 ◦C and the conching process was carried out in a longitudinal conche. To improve viscosity and liquefaction, lecithin (0.10 g kg−1) and cocoa butter (40 g kg−1) were added (Barry Callebaut). Samples were incubated at 32 ◦C for melting and tempering. Finally, chocolate samples were moulded using polycarbonate moulds and kept at 12–21 ◦C and 70% relative humidity.
2.2. Determination of volatile compounds by headspace-solid phase microextraction and gas-chromatography mass-spectrometry analysis
Static headspace extraction of volatile compounds was performed using solid-phase microextraction (SPME) in a static headscape sampler (SHS 5068, Teknokroma 2 t®) using two fibres: 65 µm polydimethylsiloxane-divinylbenzene coating (PDMS-DVB) and 75 µm carboxen/polydimethylsiloxane coating (CAR-PDMS), provided by Supelco (Bellafonte, PA, USA). The extraction conditions were previously optimized combining different exposure time and temperatures of the fibres. The final conditions selected were: equilibrium time 30 minutes at 55ºC (~2 g chocolate), 40 minute extraction time at 55ºC (extraction temperature) with fibre exposition.
Extractions were carried out in 10 mL PTFE/Silicone septa vials (Supelco, Bellafonte, PA, USA). After absorption, the volatiles extracted by the fibres were thermally desorbed for 5 minutes into the splitless injector (230ºC) of a GC8000 Thermo Quest gas chromatograph coupled to a Voyager MD800 Finnigam Mass Spectrometer Detector and separated on a fused-silica TRB-WAX polyethyleneglycol capillary column (60 m x 0.25 mm I.D., 0.2 µm film thickness; Teknokroma, Barcelona, Spain). The GC was setup with a constant flow of 1.2 mL/min (helium), the oven temperature program was: 60ºC (5 min); 3ºCmin−1 to 200ºC; 200ºC (6 min); 4ºCmin−1 to 250ºC and finally 7 min at 250ºC. Detection was carried out in an MD800 mass-selective single quadrupole, using electron-impact ionization (70 eV), detector at 550 V, source temperature at 200ºC, a scan range of 50–450 amu (scan time of 0.9 s and an interscan delay of 0.1 s). Three replicates were injected for each sample.
Components identification was based on comparison of its mass spectra with those of the US National Institute of Standards and Technology (NIST) database-98 library of mass spectra considering peak base, molecular masses, characteristic mass loses and by comparing the retention index with literature data. Quantification was carried out from peak areas of the components.
2.3. Data analysis
ANOVA of two factors with interactions was used to study the effect of cocoa origin and roasting time on flavour compounds. Significance of differences among means was established using Tukey’s Test (α ≤ 0.05). Principal component analysis was used to evaluate relationships among selected flavour volatiles obtained by GC-MS data and influential factors. Previously, Kaiser Meyer Olkin test (KMO ≥ 0.7) and the Bartlett test (p-value ≤0.05) were applied to data matrix to confirm its suitability for conducting this factorial analysis.
All the analysis were carried out with XLSTAT Pro software version 2011 (Addinsoft, France).
3. Results and discussion
3.1. Identification of volatile compounds
To select the best conditions, we evaluated both chromatographic areas, number and intensity of compounds extracted. Thus, the first parameter considered was the choice of SPME fibre coating. The results showed that when using CAR-PDMS up to 100 peaks were detected with more intensity, whereas with PDMS-DVB the number of peaks in the chromatogram and their intensity was quite low (peak number <75). Thus, the former fibre was selected as optimum for the extraction of volatile compounds.
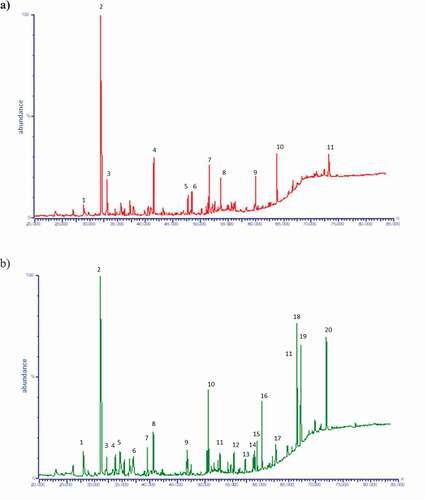
Volatile compounds of the different chocolate samples under study were extracted by HS-SPME and identified by GC-MS analyses. The key volatiles were selected according to their presence in chromatogram peak areas at >105 abundant units quantified by GC-MS. One hundred and twenty-one compounds were identified in the studied samples as illustrated in the typical chromatograms in . Compounds with the most abundant peaks are displayed in the chromatograms showing that in chocolates from Ecuador more volatile compounds are identified and in greater quantities than in those from Ghana. Thus, the flavour of chocolate from Ecuador is more complex since it is due to a wide matrix of volatiles than Ghanaian one. In both samples, acetic acid is the most abundant compound and the rest of compounds are a mixture of compounds from very diverse families (acids, alcohols, pyrans, aldehydes, esters, furans or pyrazines).
Figure 1. Characteristic chromatograms of the volatile compounds obtained using chromatography-mass spectrometry: (a) Ghana and (b) Ecuador. Identification of volatile compounds in .
Figura 1. Cromatograma de los compuestos volátiles característicos obtenido mediante cromatografía de gases-espectrometría de masas: (a) Ghana y (b) Ecuador. Identificación de compuestos volátiles en la .
Table 1. Two-way analysis of variance (origin and roasting time) with interactions for volatile compounds identified in dark chocolates samples.
Tabla 1. Análisis de la varianza de dos factores (origen y tiempo de tostado) con interacciones para los compuestos volátiles identificados en las muestras de chocolate negro
Volatiles are shown by functional chemical group order in , comprising acids (12), alcohols (15), aldehydes (11), alkanes (5), esters (24), furans (13), ketones (10), nitrogen compounds (7), pyran derivatives (5), pyrazines (12), pyrroles (6) and thiazoles (1).
Some of these compounds identified have been reported previously and indicated as responsible for the note flavours and off flavours during fermentation, drying of cocoa beans, or during roasting and conching of chocolates, as summarized in (Afoakwa, Paterson, Fowler & Ryan, Citation2009; Counet et al., Citation2002; Ducki et al., Citation2008; Frauendorfer & Schieberle, Citation2008; Hashim & Chaveron, Citation1994; Hashim et al., Citation1997; Huang & Barringer, Citation2010; Nazaruddin et al., Citation2006; Perego et al., Citation2004; Rodriguez-Campos et al., Citation2011; Serra-Bonvehí, Citation2005; Vítová et al., Citation2009). Among the compounds identified, some compounds have not been as widely described and are not as characteristic of the aroma of chocolate: acids (A6, A8 and A10), alcohols (OH2, OH5, OH7, OH9, OH11, OH12 and OH13), aldehydes (AD2, AD3, AD4 and AD8), alkanes (AK1, AK3, AK4 and AK5), esters (E3, E4, E6, E7, E9, E11, E12, E13, E14, E15, E16, E17, E18, E19, E20, E21, E22, E23 and E24), furans (F2, F3, F4, F5, F6, F7, F8, F9, F11 and F12), ketones (K1, K3, K4, K5, K6, K7, K8, K9 and K10), nitrogen compounds (N1, N2, N3, N4, N5 and N7), pyran derivatives (P1, P2, P3 and P6), pyrazines (PZ12) and pyrroles (PY1, PY3, PY4, PY5 and PY6).
Table 2. Volatile compounds identified and odour description in cocoa beans and chocolates.
Tabla 2. Compuestos volátiles identificados y descripción de su olor en semillas de cacao y chocolate
The results showed that acid concentrations were high in the studied samples, especially acetic acid, which was the most abundant. The presence of acetic acid in such high concentrations in cocoa and chocolate products has been reported in previous research (Frauendorfer & Schieberle, Citation2008; Nazaruddin et al., Citation2006). Those acids are produced in the cocoa bean pulp during fermentation, and are responsible for the acidic and sour flavours that raw cocoa has prior to roasting. Odour notes described for acid compounds in cocoa and chocolate products are: rancid, pungent and sour (Frauendorfer & Schieberle, Citation2008; Rodriguez-Campos et al., Citation2011; Serra-Bonvehí, Citation2005). Our results indicate that Ecuadorian chocolates have a higher acid content than Ghanaian ones, although, acetic acid it’s the main volatile compound in both samples. During fermentation, acid content affects pH value and consequently enzymatic reactions and flavour precursor formation. In this sense, the results obtained in this study agree with those reported by Jinap and Dimick (Citation1990) who indicated that cocoa beans from West Africa or Indonesia had medium pH and those from Ecuador, which had higher acid contents, had much more acidic pH values.
In our chocolate samples, there was a significant increase in the concentration of pyrazines, aldehydes, furans and pyrroles the main compounds formed through the reactions that occur during roasting, such as Strecker degradation and Maillard reaction (Bonvehí & Coll, Citation2002; Dimick & Hoskin, Citation1999; Granvogl et al., Citation2006). Aldehydes are compounds synthesized during the Maillard reaction, derived by the Strecker degradation of amino acids that play an important role in chocolate flavour balance. Therefore, the amino acid structure dictates the resulting aldehydes, the amine and acid that can be produced from the amino acid degradation and also the resulting volatiles such as alcohols and esters (Ziegleder, Citation2009). Odour notes typically reported from aldehydes are chocolate, malty, nutty and cocoa flavours (Afoakwa, Paterson, Fowler & Ryan, Citation2009; Counet et al., Citation2002; Serra-Bonvehí, Citation2005). In the final Maillard reaction stages aldol condensation and cyclisation lead to formation of heterocyclic aroma volatiles such as pyrazines (Afoakwa, Citation2010). The most abundant pyrazines were PZ1 (methylpyrazine), PZ2 (2,5-dimethylpyrazine), PZ3 (2,6-dimethylpyrazine), PZ4 (2,3,5-trimethylpyrazine-TrMP) and PZ5 (tetramethylpyrazine-TMP). Pyrazines also are produced due to aldehydes from Strecker degradation of amino acids and further heterocyclic compounds, which are dominant in cocoa flavour. Results showed an especially high average concentration of tetramethylpyrazine for both cocoa origins under study (Ecuador and Ghana), which could be due to a high concentration of this compound in the raw cocoa beans because it is biosynthesized during cocoa fermentation. These results agree with data reported previously by Perego et al. (Citation2004) and Reineccius et al. (Citation1972). Also, Ziegleder (Citation1982) evaluated roasted cocoa flavour from the methylpyrazine fraction, showing that a concentration ratio of TMP/TrMP between about 1.5 and 2.5 was obtained when the degree of roasting was normal. In agreement with these values all studied samples were correctly roasted (ratio TMP/TrMP >1.5). Pyrazine compounds are reported to produce odour notes such as: cocoa, nutty, roasted, cooked, milk coffee, hazelnut or praline (Afoakwa, Paterson, Fowler & Ryan, Citation2009; Counet et al., Citation2002; Serra-Bonvehí, Citation2005) on flavour quality, which are desirable for cocoa and chocolate products.
Some pyran derivatives had already been formed at earlier moderate temperatures and relatively high humidity, and as reported by Ziegleder (Citation1991). This makes these volatiles a useful indicator, whose level can be used to monitor the early stages of roasting. These compounds stem from the degradation of sugar precursors in cocoa and decrease during roasting, probably as a result of their chemical reactivity. Their odour notes, as described by Serra-Bonvehí (Citation2005), were malt, roasted and roasted nuts flavour.
Alcohols are common compounds in food flavour, which in chocolate are produced during fermentation of sugars present in cocoa beans (Rodriguez-Campos et al., Citation2011) and have also been related to volatile compounds of amino acid thermal degradation (Nazaruddin et al., Citation2006). Additionally, the alcohols produced react as precursors to other compounds such a 2,3-butanediol to 2,3-butanedione or phenylethyl alcohol to phenylacetaldehyde, and some alcohols are partially esterified with acetic acid; so, several acetate esters were found. In the studied chocolates, Ecuadorian samples had higher alcohol contents than the Ghanaian ones. These results are in accordance with Ziegleder (Citation1990) and Pino et al. (Citation1993), who reported that cocoas harvested in South-America (Ecuador, Trinidad or Venezuela) reveal a flowery and tea-like aroma and contain significant concentrations of some alcohols, like linalool or other terpenoids, which contribute to pleasant chocolate notes. However, bulk cocoas from West Africa or Malaysia carry a fairly strong inherent flavour and have low contents of these compounds. Due to their volatility, alcohols are compounds with a strong flavour and odour notes reported as: flowery, rose, citrus, green, fruity or herbaceous, which could contribute to the cocoa bean and chocolate flavour (Rodriguez-Campos et al., Citation2011; Serra-Bonvehí, Citation2005).
A minimum concentration of alkanes (C10-C20) was identified in accordance with Serra-Bonvehí (Citation2005) and to J.C. Hoskin and Dimick (Citation1984) in less roasted samples from both origins. Those alkanes come from the decarboxylation occurring during roasting of the fatty acids present in raw cocoa beans. Thiazoles, like alkanes, were also present in low concentrations, and are considered to be products originating from amino acids (J.C. Hoskin & Dimick, Citation1984; Reineccius, Citation2006). N-compounds are also present in low amounts in the studied samples and are compounds from the Maillard reaction, taking place during roasting with sugars.
Finally, an important number of esters were identified in the studied samples during roasting, which have basically fruity odour notes, although some esters also have important flowery notes (Frauendorfer & Schieberle, Citation2008; Rodriguez-Campos et al., Citation2011; Serra-Bonvehí, Citation2005) and are important flavour components of natural products and fermented foods.
3.2. Roasting time effect on volatile compounds of dark chocolates from different geographical origins
A two-factor ANOVA (origin and roasting time) with interactions was performed in order to determine whether the considered factors had an effect on the peak areas of volatile constituents in the studied chocolate samples. Results of the ANOVA are shown in displaying that for most of the studied compounds the interaction between the two effects was significant, indicating that the effect of roasting time on the peak area of the volatile compounds depended on the cocoa origin and vice versa. This has been demonstrated in previous research by Hernández and Rutledge (Citation1994), who differentiate cocoa masses by geographical origin and roasting conditions by using gas chromatography. For four compounds, only the origin effect was significant: nonanal (AD1), 2-phenylethyl acetate (E5), 3-hydroxy-2-butanone (K2) and acetophenone (K8). In five other compounds differences were only due to the roasting time effect: 2-nonanol (OH4), 2methyl hexadecanoate (E11), 5,6-dihydro-6-pentyl-2 H-yran-2-one (P3), 2,5-dimethylpyrazine (PZ2) and tetramethylpyrazine (PZ5). Finally, there were six compounds whose concentration was not significantly affected by the studied factors: undecanoic acid (A10), 2,6-bis(1,1-dimethylethyl)-4-(1-methylpropyl) phenol (OH12), methyl 7-octadecanoate (E13), phenylmethyl 9-octadecenoate (E17), 5-phenyl-2-pentanone (K5), and 2-ethylpyrazine (PZ6). As for the other compounds identified, differences were found to be due to the effects of origin and roasting time or an interaction of the two (origin x roasting time).
The volatile profile was compared by principal component analysis (PCA) to study the variability in volatile compounds among the studied samples. The compounds listed in chosen for the multivariate analysis were those that varied significantly in the factors under study (origin, roasting time or interaction). The three first principal components (PCs), which explained 78.1% of total variability, were considered ().
Figure 2. Principal component analysis of the variation of volatile compounds in the dark chocolate samples, (PC1 and PC2): a) score plot b) loading plot. Code of samples: origin (E = Ecuador and G = Ghana) and roasting time (R1 = 30.5 minutes; R2 = 34.5 minutes and R3 = 38.5 minutes). Identification of volatile compounds in .
Figura 2. Análisis de componentes principales de la variación de compuestos volátiles en las muestras de chocolate negro, (PC1 y PC2): a) score plot b) loading plot. Código de muestras: origen (E = Ecuador y G = Ghana) y tiempo de tostado (R1 = 30,5 minutos; R2 = 34,5 minutos y R3 = 38,5 minutos). Identificación de compuestos volátiles en la
Figure 3. Principal component analysis of the variation of volatile compounds in the dark chocolate samples, (PC1 and PC3): a) score plot b) loading plot. Code of samples: origin (E = Ecuador and G = Ghana) and roasting time (R1 = 30.5 minutes; R2 = 34.5 minutes and R3 = 38.5 minutes). Identification of volatile compounds in .
Figura 3. Análisis de componentes principales de la variación de compuestos volátiles en las muestras de chocolate negro, (PC1 y PC3): a) score plot b) loading plot. Código de muestras: origen (E = Ecuador y G = Ghana) y tiempo de tostado (R1 = 30,5 minutos; R2 = 34,5 minutos y R3 = 38,5 minutos). Identificación de compuestos volátiles en la
showed the loadings and score plots for the first two principal components. The loading plots show each compound located according to its relationship with the components and can be used to explain how it varied among samples. Thus, the volatile compounds were grouped according to their position on the PC plots. Only those compounds with a correlation coefficient with at least one of the components (rPC1, rPC2 or rPC3) higher than 0.60 or lower than −0.60 were taken into account and the rest (n = 25) were not considered as they did not display a clear variation. As a result, five groups of compounds were identified when considering the two first principal components, and three more groups appeared when considering also the third principal component. The groups are graphically shown on the plots and circles gather all of the compounds corresponding to a group. The groups obtained with the multivariate analysis are indicated with the identification code (ID) for each compound, as shown in .
PC1, which explained 32.9% of variability, separated samples according to roasting time, from samples with short roasting time (ER1 and GR1) on the right-hand side from samples with a longer roasting time (ER3 and GR3) on the left-hand side.
Regarding compounds correlated with PC1, there is a group of compounds (Group 1, n = 27) that appeared on the right-hand side of PC1 with rPC1 > 0.60. These compounds were those present in the slightly roasted chocolates, especially in the Ghanaian ones, and on increasing roasting time the amount of these compounds diminished or even disappeared. Compounds in this group have a very different structure, but as can be seen the predominates were: acids (A2, A3, A4, A11, and A12), alcohols (OH4, OH7, OH9, OH11 and OH13) and esters (E1, E2, E11, E12, E16, E23 and E24). Thus, these compounds can be considered characteristics of the chocolate flavour made with slightly roasted Ghanaian cocoa.
On the other hand, on the left-hand side of PC1 a second group of compounds appeared (G2, n = 13) with rPC1< −0.6. These are the compounds that appeared for samples from both origins on increasing roasting time, as expected. These compounds were mainly pyrazines (PZ1, PZ2, PZ3, PZ4, PZ5, PZ7, PZ8 and PZ11) and furans (F3, F4, F8 and F13). Compounds that have a clear impact on the characteristic roasted food flavour, especially roasted cocoa flavour.
Among pyrazines, tetramethylpyrazine (PZ5) and methylpyrazine (PZ1) were the most abundant, especially in Ghanaian samples. Besides PZ5 and PZ1, other methylpyrazines such as 2,5- dimethyl (PZ2), 2,6-dimethyl (PZ3) and 2-ethyl (PZ6) were also detected in samples but in low concentrations. This group of compounds can be detected after exceeding the time and temperature of roasting or as a sign of over-roasting (Nazaruddin et al., Citation2006). In the samples these compounds were especially found again in Ghanaian samples.
The second PC, which explained 27.9%, separated the samples according to their origin with medium and long roasting time (R2 and R3), with Ecuadorian samples more roasted in the upper quadrant and Ghanaian samples also more roasted below. Thus, this second PC clearly shows the differences in the volatile profile when roasting cocoa depending on the geographical origin.
Regarding PC2, those compounds with rPC2< −0.6 (Group 3, n = 15) are located in the lower quadrant and correspond to the compounds that appeared in Ghanaian chocolates on increasing roasting time (G3). Compounds present in G3 were mainly furans (F1, F2, F5, F9 and F10), pyrazines (PZ10) and pyrroles (PY3 and PY6). The compounds in this group with the highest concentrations were F1, F9, F10, PZ10, PY3, PY6, AD5 and E6.
On the other hand, on the positive side of the PC2, the compounds with rPC2 > 0.6 were divided into two groups. One group of compounds (G4, n = 14) located on the left-hand side which appear in long-roasted Ecuadorian chocolates and are mainly represented by aldehydes (AD1, AD2, AD3, AD8, AD9 and AD11) and ketones (K1, K2, K8 and K9). The other group (G5, n = 7) is located on the right-hand side and includes those compounds that disappear in Ghanaian chocolates during roasting but remain in Ecuadorian chocolate. Compounds in this group were mainly represented by esters (E4, E5, E8 and E10) and alcohols (OH8 and OH12), compounds already found in greater quantities in lightly roasted samples from Ecuador.
Finally, the third PC, which explained 17.3% of variability, separated the Ecuadorian samples according to roasting degree (). In the top of the plot, there is a final group of compounds with rPC3 > 0.6 (Group 6, n = 13), which are the compounds identified in the slightly roasted Ecuadorian chocolates, that disappeared during roasting time. These compounds were acids (A1, A5, A7, A8 and A9), esters (E15, E19 and E20) and nitrogen compounds (N1 and N3). In Ghanaian chocolates, these compounds were found in a lower proportion or did not vary during roasting. Meanwhile, on the left side of the plot in Group 8 (n = 12) compounds identified were those characteristics of highly roasted samples from both origins, where pyrazines (PZ1, PZ2, PZ3, PZ4, PZ5 and PZ8) and furans (F3, F4, F10 and F13) are especially present, as mentioned previously in G2. Compounds located in Group 7 (n = 28) are those present mainly in samples slightly roasted, especially in Ghanaian ones, characterised by esters (E1, E2, E11, E12, E16, E23 and E24), alcohols (OH4, OH7, OH9, OH11 and OH13) and acids (A2, A3, A4 and A12).
summarizes the distribution of volatile compounds in the established groups for each family of compounds. As shown, acids, alcohols, nitrogen compounds, pyranones and thiazoles fall within the groups G1, G5 and G6. These are compounds that appeared in dark chocolates made with slightly roasted cocoa and whose concentration decreased on increasing roasting time. These compounds, as demonstrated by Counet et al. (Citation2002) or Jinap and Dimick (Citation1991), are removed from the final product by the thermal treatments performed during the chocolate manufacturing process. Furans, pyrazines and pyrans appeared in groups G2, G3 and G4, which included those compounds that increased with roasting time; therefore, they are compounds responsible for the typical intense aroma of chocolate products. In some aldehydes and ketones, the concentration decreased during roasting (G1), but most of them fell within group 4, comprising those compounds that appear on increasing roasting time in Ecuadorian chocolates.
Figure 4. Distribution of volatile compounds in the groups established according to the position in the PC plots for each family of compounds.
Figura 4. Distribución de compuestos volátiles en los grupos establecidos según la posición en los gráficos de componentes principales (PC) para cada familia de compuestos
4. Conclusions
It has been shown that flavour profile of Ghanaian and Ecuadorian chocolates has characteristic components considering roasting conditions. The volatile compounds identified in samples and variations in concentration with roasting time depended on the geographical origin of the cocoa beans. The multivariate analysis could identify different groups of volatile compounds according to variation among the studied samples and, therefore, according to the effects of roasting time and geographical origin. Each compound was ascribed to one of the following traits: compounds whose concentration decreased with roasting time in samples from Ghana, Ecuador or in samples from both origins, and those compounds whose concentration increased with roasting time for one or both origins. The principal component analysis is a useful tool to deal with the large amount of data obtained from the volatile composition analysis of complex products like chocolate. As shown in this work, PCA allows not only differences in volatile compounds to be characterized among samples, but also to systematically classify the compounds according to their variation among samples and the studied factors: roasting time and the geographical origin of cocoa beans.
Acknowledgments
To Chocolates Simón Coll S.A. for providing free samples of cocoa and chocolate.
Disclosure statement
No potential conflict of interest has been reported by the authors.
References
- Afoakwa, E. O. (2010). The chemistry of flavour development during cocoa processing and chocolate manufacture. In E. Afoackwa (Ed.), Chocolate science and technology (pp. 58–72). Wiley-Blackwell.
- Afoakwa, E. O., Paterson, A., Fowler, M., & Ryan, A. (2008). Flavor formation and character in cocoa and chocolate: A critical review. Critical Reviews in Food Science and Nutrition, 48(9), 840–857. https://doi.org/https://doi.org/10.1080/10408390701719272
- Afoakwa, E. O., Paterson, A., Fowler, M., & Ryan, A. (2009). Matrix effects on flavour volatiles release in dark chocolates varying in particle size distribution and fat content using GC–mass spectrometry and GC-olfactometry. Food Chemistry, 113(1), 208–215. https://doi.org/https://doi.org/10.1016/j.foodchem.2008.07.088
- Afoakwa, E. O., Quao, J., Budu, A. S., Takrama, J., & Saalia, F. K. (2011). Effect of pulp preconditioning on acidification, proteolysis, sugars and free fatty acids concentration during fermentation of cocoa (Theobroma cacao) beans. International Journal of Food Sciences and Nutrition, 62(7), 755–764. https://doi.org/https://doi.org/10.3109/09637486.2011.581224
- Aprotosoaie, A. C., Vlad Luca, S., & Miron, A. (2016). Flavor chemistry of cocoa and cocoa products – An overview. Comprehensive Reviews in Food Science and Food Safety, 15(1), 73–91. https://doi.org/https://doi.org/10.1111/1541-4337.12180
- Bailey, S., Mitchell, D., Bazinet, M., & Weurman, C. (1962). Studies on the volatile components of different varieties of cocoa beans. Journal of Food Science, 27(2), 165–170. https://doi.org/https://doi.org/10.1111/j.1365-2621.1962.tb00076.x
- Beckett, S. T. (2008). Cocoa bean processing. In S. T. Beckett (Ed.), The science of chocolate (pp. 39–58). RSC Publishing.
- Biehl, B., & Voigt, J. (1999). Biochemistry of cocoa flavour precursors. In Proceedings of the 12th International Cocoa Research Conference, Salvador, Brazil Lagos, Nigeria: Cocoa Producers Alliance, 1996 (pp. 929–938).
- Bonvehí, J. S., & Coll, V. (2002). Factors affecting the formation of alkylpyrazines during roasting treatment in natural and alkalinized cocoa powder. Journal of Agricultural and Food Chemistry, 50(13), 3743–3750. https://doi.org/https://doi.org/10.1021/jf011597k
- Cambrai, A., Marcic, C., Morville, S., Houer, P., Bindler, F., & Marchioni, E. (2010). Differentiation of chocolates according to the cocoa’s geographical origin using chemometrics. Journal of Agricultural and Food Chemistry, 58(3), 1478–1483. https://doi.org/https://doi.org/10.1021/jf903471e
- Clapperton, J., Yow, S., Chan, J., Lim, D., Lockwood, R., Romanczyk, L., & Hammerstone, J. (1994). The contribution of genotype to cocoa (Theobroma cacao L) flavour. Tropical Agriculture (Trinidad), 71, 303–308.
- Counet, C., Callemien, D., Ouwerx, C., & Collin, S. (2002). Use of gas chromatography-olfactometry to identify key odorant compounds in dark chocolate. Comparison of samples before and after conching. Journal of Agricultural and Food Chemistry, 50(8), 2385–2391. https://doi.org/https://doi.org/10.1021/jf0114177
- Counet, C., Ouwerx, C., Rosoux, D., & Collin, S. (2004). Relationship between procyanidin and flavour contents of cocoa liquors from different origins. Journal of Agricultural and Food Chemistry, 52(20), 6243–6249. https://doi.org/https://doi.org/10.1021/jf040105b
- Dimick, P. S., & Hoskin, J. C. (1999). The chemistry of flavour development in chocolate. In S. T. Beckett (Ed.), Industrial chocolate manufacture and use (pp. 137–152). Blackwell Science.
- Dimick, P. S., & Hoskin, J. M. (1981). Chemico-physical aspects of chocolate processing - a review. Canadian Institute of Food Science and Technology Journal, 4, 269–282. https://doi.org/https://doi.org/10.1016/S0315-5463(81)72927-4
- Ducki, S., Miralles-Garcia, J., Zumbé, A., Tornero, A., & Storey, D. M. (2008). Evaluation of solid-phase micro-extraction coupled to gas chromatography-mass spectrometry for the headspace analysis of volatile compounds in cocoa products. Talanta, 74(5), 1166–1174. https://doi.org/https://doi.org/10.1016/j.talanta.2007.08.034
- Fowler, M. S. (1999). Cocoa beans: From tree to factory. In S. Beckett (Ed.), Industrial chocolate manufacture and use (pp. 8–35). Blackwell Science.
- Frauendorfer, F., & Schieberle, P. (2006). Identification of the key aroma compounds in cocoa powder based on molecular sensory correlations. Journal of Agricultural and Food Chemistry, 54(15), 5521–5529. https://doi.org/https://doi.org/10.1021/jf060728k
- Frauendorfer, F., & Schieberle, P. (2008). Changes in key aroma compounds of Criollo cocoa beans during roasting. Journal of Agricultural and Food Chemistry, 56(21), 10244–10251. https://doi.org/https://doi.org/10.1021/jf802098f
- Granvogl, M., Bugan, S., & Schieberle, P. (2006). Formation of amines and aldehydes from parent amino acids during thermal processing of cocoa and model systems: New insights into pathways of the Strecker reaction. Journal of Agricultural and Food Chemistry, 54(5), 1730–1739. https://doi.org/https://doi.org/10.1021/jf0525939
- Hashim, L., & Chaveron, H. (1994). Extraction and determination of methylpyrazines in cocoa beans using coupled steam distillation-microdestillator. Food Research International, 27(6), 537–544. https://doi.org/https://doi.org/10.1016/0963-9969(94)90139-2
- Hashim, L., Hudiyono, S., & Chaveron, H. (1997). Volatile compounds of oxidized cocoa butter. Food Research International, 30(3–4), 163–169. https://doi.org/https://doi.org/10.1016/S0963-9969(97)00039-2
- Heinzler, M., & Eichner, K. (1992). The role of amodori compounds during cocoa processing - formation of aroma compounds under roasting conditions. Zeitschrift für Lebensmitteluntersuchung und -Forschung A, 192, 445–450. https://doi.org/https://doi.org/10.1007/BF01193145
- Hernández, C. V., & Rutledge, D. N. (1994). Multivariate statistical analysis of gas chromatograms to differentiate cocoa masses by geographical origin and roasting conditions. The Analyst, 119(6), 1171–1176. https://doi.org/https://doi.org/10.1039/AN9941901171
- Hinneh, M., Semanhyia, E., Walle, V. D., De Winne, A., Tzompa-Sosa, A., Scalone, G. L. L., De Meulenaer, B., Messens, K., Van Durme, J., Afoakwa, E. O., De Cooman, L., & Dewettinck, K. (2018). Assessing the influence of pod storage on sugar and free amino acid profiles and the implications on some Maillard reaction related flavour volatiles in Forastero cocoa beans. Food Research International, 111, 607–620. https://doi.org/https://doi.org/10.1016/j.foodres.2018.05.064
- Hoskin, J., & Dimick, P. (1983). Role of nonenzymatic browning during the processing of chocolates. A review. Process Biochemistry, 11, 92–104. ISSN 0032-9592
- Hoskin, J. C., & Dimick, P. S. (1984). Role of sulphur compounds in the development of chocolate flavour-a review. Process Biochemistry, 19, 150–156. ISSN 0032-9592
- Huang, Y., & Barringer, S. A. (2010). Alkylpyrazines and other volatiles in cocoa liquors at pH 5 to 8, by selected ion flow tube-mass spectrometry (SIFT-MS). Journal of Food Science, 75(1), C121–C127. https://doi.org/https://doi.org/10.1111/j.1750-3841.2009.01455.x
- Jinap, S., & Dimick, P. S. (1990). Acidic characteristics of fermented and dried cocoa beans from different countries of origin. Journal of Food Science, 55(2), 547–550. https://doi.org/https://doi.org/10.1111/j.1365-2621.1990.tb06806.x
- Jinap, S., & Dimick, P. S. (1991). Effect of roasting on acidic characteristics of cocoa beans. Journal of the Science of Food and Agriculture, 54(2), 317–321. https://doi.org/https://doi.org/10.1002/jsfa.2740540220
- Jinap, S., Dimick, P. S., & Hollender, R. (1995). Flavour evaluation of chocolate formulated from cocoa beans from different countries. Food Control, 6(2), 105–110. https://doi.org/https://doi.org/10.1016/0956-7135(95)98914-M
- Jinap, S., Rosli, W. I. W., Russly, A. R., & Nordin, L. M. (1998). Effect of roasting time and temperature on volatile component profiles during nib roasting of cocoa beans (Theobroma cacao). Journal of the Science of Food and Agriculture, 77, 441–448. https://doi.org/https://doi.org/10.1002/(SICI)1097-0010(199808)77:4<441::AID-JSFA46>3.0.CO;2-%23
- Kattenberg, H. R., & Kemmink, A. (1993). The flavor of cocoa in relation to the origin and processing of the cocoa beans. In G. Charalambous (Ed.), Food Flavors Ingredients and Composition (pp. 1–22). Elsevier Science.
- Keeney, P. G. (1972). Various interactions in chocolate flavour. Journal of the American Oil Chemists’ Society, 49(10), 567–572. https://doi.org/https://doi.org/10.1007/BF02609228
- Kongor, J. E., Hinneh, M., Van de Walle, D., Afoakwa, E. O., Boeckx, P., & Dewettinck, K. (2016). Factors influencing quality variation in cocoa (Theobroma cacao) bean flavour profile - A review. Food Research International, 82, 44–52. https://doi.org/https://doi.org/10.1016/j.foodres.2016.01.012
- Luna, F., Crouzillat, D., Cirou, L., & Bucheli, P. (2002). Chemical composition and flavour of Ecuadorian cocoa liquor. Journal of Agricultural and Food Chemistry, 50(12), 3527–3532. https://doi.org/https://doi.org/10.1021/jf0116597
- Misnawi, S., Jinap, B., Jamilah, N., & Nazamid, S. (2003). Effects of incubation and polyphenol oxidase enrichment on colour, fermentation index, procyanidins and astringency of unfermented and partly fermented cocoa beans. International Journal of Food Science and Technology, 38(3), 285–295. https://doi.org/https://doi.org/10.1046/j.1365-2621.2003.00674.x
- Nazaruddin, R., Osman, H., Mamot, S., Wahid, S., & Nor, A. (2006). Influence of roasting conditions on volatile flavor of roasted malaysian cocoa beans. Journal of Food Processing and Preservation, 30(3), 280–298. https://doi.org/https://doi.org/10.1111/j.1745-4549.2006.00065.x
- Perego, P., Fabiano, B., Cavicchioli, M., & Del Borghi, M. (2004). Cocoa quality and processing. A study by solid-phase microextraction and gas chromatography analysis of methylpyrazines. Food and Bioproducts Processing, 82(4), 291–297. https://doi.org/https://doi.org/10.1205/fbio.82.4.291.56402
- Pino, J., Nuñez de Villavicencio, M., & Roncal, E. (1993). Pattern recognition of GC profiles for classification of cocoa butter of Ghanaian and Cuban cultivars. Journal of Food Quality, 16(2), 125–132. https://doi.org/https://doi.org/10.1111/j.1745-4557.1993.tb00355.x
- Plumas, B., Hashim, L., & Chaveron, H. (1996). Measurement of the olfactive intensity of chocolates by differential olfactometry. Food Control, 7(3), 117–120. https://doi.org/https://doi.org/10.1016/0956-7135(96)00013-8
- Reineccius, G. (2006). Flavorings materials made by processing. In G. Reineccius (Ed.), Flavour Chemistry and Technology (pp. 261–298). CRC Press.
- Reineccius, G. A., Keeney, P. G., & Weissberger, W. (1972). Factors affecting the concentration of pyrazines in cocoa beans. Journal of Agricultural and Food Chemistry, 20(2), 202–206. https://doi.org/https://doi.org/10.1021/jf60180a032
- Rodriguez-Campos, J., Escalona-Buendía, H. B., Orozco-Avila, I., Lugo-Cervantes, E., & Jaramillo-Flores, M. E. (2011). Dynamics of volatile and non-volatile compounds in cocoa (Theobroma cacao L.) during fermentation and drying processes using principal components analysis. Food Research International, 44(1), 250–258. https://doi.org/https://doi.org/10.1016/j.foodres.2010.10.028
- Schwan, R. F., & Wheals, A. E. (2004). The microbiology of cocoa fermentation and its role in chocolate quality. Critical Reviews in Food Science and Nutrition, 44(4), 205–221. https://doi.org/https://doi.org/10.1080/10408690490464104
- Serra-Bonvehí, J. (2005). Investigation of aromatic compounds in roasted cocoa powder. European Food Research and Technology, 221(1–2), 19–29. https://doi.org/https://doi.org/10.1007/s00217-005-1147-y
- Toker, O. S., Palabiyik, I., Pirouzian, H. R., Aktar, T., & Konar, N. (2020). Chocolate aroma: Factors, importance and analysis. Trends in Food Science & Technology, 99, 580–592. https://doi.org/https://doi.org/10.1016/j.tifs.2020.03.035
- Torres-Moreno, M., Tarrega, A., Costell, E., & Blanch, C. (2012). Dark chocolate acceptability: Influence of cocoa origin and processing conditions. Journal of the Science of Food and Agriculture, 92(2), 404–411. https://doi.org/https://doi.org/10.1002/jsfa.4592
- Vítová, E., Loupancová, B., Stoudková, H., Macku, I., Zemanová, J., & Babak, L. (2009). Effect of fat composition on some physic-chemical parameters and sensorial evaluation of dark chocolate. Journal of Food and Nutrition Research, 48(2), 72–79.
- Ziegleder, G. (1982). Gaschromatographische Röstgradbestimmung von kakao über methylierte pyrazine. Deutsche Lebensmittel Rundschau, 78, 77–81. http://publica.fraunhofer.de/dokumente/PX-15740.html
- Ziegleder, G. (1990). Linalool contents as characteristic of some flavour grade cocoas. Zeitschrift für Lebensmitteluntersuchung und -Forschung A, 191(4–5), 481–485. https://doi.org/https://doi.org/10.1007/BF01202432
- Ziegleder, G. (1991). Composition of flavor extracts of raw and roasted cocoas. Zeitschrift für Lebensmitteluntersuchung und -Forschung A, 192(6), 512–525. https://doi.org/https://doi.org/10.1007/BF01202506
- Ziegleder, G. (2009). Flavour development in cocoa and chocolate. In S. Beckett (Ed.), Industrial chocolate manufacture and use (pp. 169–191). Wiley-Blackwell.