
ABSTRACT
Deoxynivalenol (DON) is a mycotoxin commonly found in cereals and animal feeds, which also is a carcinogen easily soluble in water. So it has drawn considerable interest in food safety. In this study, a specific aptamer named DON-A16 was developed from an immobilized ssDNA library by affinity chromatography column-based the SELEX. The complementary chain competition method for DON detection was established, and its limit of detection (LOD) was 488 ng/mL. Graphene oxide-based fluorescence quenching was developed using DON-A16 with fluorescein (FAM) label; its LOD was 200 ng/mL, and the detection time was 3 h. The recovery rate of fluorescence quenching was also detected in different samples (oat, wheat flour, corn), which showed the commercial DON ELISA kit led to an increase in repeatability, satisfactory recovery and consistency. The three-dimensional structure and the main binding site of of DON-A16 was ultimately obtained by molecular docking simulation.
El deoxinivalenol (DON) es una micotoxina que se encuentra comúnmente en cereales y alimentos para animales; además, es un carcinógeno fácilmente soluble en agua. Por ello ha despertado gran interés en el ámbito de la seguridad alimentaria. En el presente estudio, a partir de una biblioteca de ADNss inmovilizada mediante el SELEX basado en una columna de cromatografía de afinidad, se desarrolló un aptámero específico llamado DON-A16. Así, se estableció el método de competencia de cadenas complementarias para la detección de DON, registrándose su límite de detección (LOD) en 488 ng/mL. Posteriormente, se desarrolló la desactivación de fluorescencia basada en óxido de grafeno utilizando DON-A16 con etiqueta de fluoresceína (FAM); su LOD fue de 200 ng/mL y el tiempo de detección fue de tres horas. Además, se registró la tasa de recuperación de la desactivación de fluorescencia en diferentes muestras (avena, harina de trigo, maíz), lo que demostró que el kit comercial de ELISA DON provocó un aumento de la repetibilidad, la recuperación satisfactoria y la consistencia. Finalmente, mediante simulación de acoplamiento molecular se obtuvieron la estructura tridimensional y el principal sitio de unión de DON-A16.
1. Introduction
Deoxynivalenol (DON), a fungal toxin belonging to trichothecenes, is widely distributed in cereal and feedstuffs such as millet and barley (Bryla et al., Citation2018; Krysinska-Traczyk et al., Citation2007; Rodríguez-Carrasco et al., Citation2014). DON is caused by the rapid propagation of Fusarium, Fusarium graminearum, and other pathogenic microorganisms after DON contaminates food. Thus, DON is a foodborne mycotoxin closely associated with food safety. People or animals who accidentally ingest foods or animal feed contaminated with DON tend to develop symptoms such as nausea, vomiting, gastrointestinal disorders, or enteritis (Maresca, Citation2013; Pestka, Citation2010).Owing to good hydrophilicity, water resources and aquatic organisms are also easily contaminated with DON (Pietsch et al., Citation2015). Daily drinking water and domestic water contaminated with DON can expose individuals to the mycotoxin via skin contact or ingestion. DON exhibits high-temperature resistance, high stability, and low degradability in food. European Commission Regulation No. 574/2011 limits DON content to 5 mg/kg in farm animal feeds and 1.25 mg/kg in cereal foods. Urinary analysis of DON in adults in the United Kingdom reveals the exposure of most adults to DON (Turner et al., Citation2008). Thus, DON is a high-risk toxin that has attracted attention in local food safety monitoring in various countries worldwide. Thus, rapid DON detection is important for food safety.
Conventional methods that are currently used for DON detection include instrumental analyses and immunoassay, which consist of gas chromatography–mass spectrometry (GC–MS) (Cunha & Fernandes, Citation2010; Rodríguez-Carrasco et al., Citation2017), high-performance liquid chromatography (HPLC) (Huang et al., Citation2020), thin-layer chromatography (TLC), electrochemical immunosensing, chemiluminescence enzyme immunoassay, gold nanoparticle-based lateral flow immunoassay, and enzyme-linked immunosorbent assay (ELISA) (Clemente et al., Citation2019). GC–MS, HPLC, and TLC show satisfactory sensitivity in food sampling analysis (Tegegne et al., Citation2019). These techniques require large-scale testing equipment and technical expertise and entail high testing costs (K. Wang et al., Citation2009). An electrochemical immunosensor with a limit of detection (LOD) equal to 5 pg/mL for DON has been reported (Valera et al., Citation2019). Competitive indirect chemiluminescence enzyme immunoassay (CLEIA) can rapidly quantify trace levels of DON. Developed using a monoclonal antibody of DON, CLEIA with a LOD of 0.49 μg/mL can determine the amount of DON. A lateral flow immunoassay with silver staining has also been proposed for the simultaneous DON detection in maize samples. With a cutoff value of 40 ng/mL, this approach is based on the competition between target mycotoxins and corresponding coating antigens immobilized on test lines for binding to limited gold nanoparticle (AuNP)-labeled antibodies (Yu et al., Citation2015). DON detection by ELISA with a LOD of 0.15 mg/kg in real samples has also been developed (Righetti et al., Citation2017). The aforementioned methods require monoclonal antibodies, which are susceptible to environmental and storage conditions (Dai et al., Citation2017; Maragos, Citation2011). Thus, the use of antibodies impedes the application of these detecting methods.
Aptamers are biomolecular ligands composed of single-stranded DNA (ssDNA) or RNA oligonucleotides. They are developed using an in vitro selection process referred to as the systematic evolution of ligands by exponential enrichment (SELEX). SELEX involves multiround polymerase chain reaction (PCR) amplification of target-bound oligonucleotides. Low-affinity oligonucleotides may be selected because they exhibit more efficient amplification, compared with high-affinity oligonucleotides. They are commonly known as chemical antibodies that can be used as biosensors instead of antibodies. They also have more advantages than antibodies, such as cost efficiency, small size, ease of synthesis, good reproducibility, and ease of modification (Hong & Sooter, Citation2017; Setlem et al., Citation2016). GO–SELEX and Capture-SELEX are the typically used methods (Nutiu & Li, Citation2005; Park et al., Citation2012) in selecting aptamers. Meanwhile, aptasensors continue to evolve. Xu et al. (Citation2019) proposed a structure-guided post-SELEX approach, which is an optimization method based on the precise secondary structure of the aptamer–ligand complex. An aptamer-based assay for fumonisin B1 determination was proposed by He et al. (Citation2020); this approach was bimodal in that both surface-enhanced Raman spectroscopy and fluorometry were used for quantitation. Strauss et al. (Citation2018) introduced slow off-rate modified aptamers as small and specific labeling reagents to be combined with DNA point accumulation in nanoscale topography.
A DON aptamer referred to as DON-A16 was obtained by 8 rounds of screening. The sensitivity and affinity of this aptamer were verified by enzyme-linked oligonucleotide assay (ELONA), complementary strand competition, and GO fluorescence quenching. Our simple and time-efficient development of DON detection exhibits a LOD of 200 ng/mL. Therefore, it has good detection potential.
2. Material and methods
2.1. Reagents
DON was purchased from Wuhan Bio Purity Company (Wuhan Co). Ochratoxin A (OTA), zearalenone (ZEN), aflatoxin B1 (AFB1), and biotin were supplied by Sigma. Graphene oxide (GO) was provided by Nanjing Xianfeng Nano Material Technology, Co. Horseradish peroxidase (HRP)–, Streptavidin (SA) was provided by TaKaRa, Streptavidin was purchased from (Biotopped), and Bovine serum albumin (BSA) was supplied by Sinopharm Group Pharmaceutical, Co.
2.2. Screening and appraisal of aptamer DON-A16
With reference to the literature (Y. Wang et al., Citation2018), the aptamer library of Wang’s article was used for amplification. Aptamers with affinity to DON were selected using the modified immune affinity-based SELEX. The specificity, sensitivity, and affinity of DON were verified using the ELONA method. The specific steps of ELONA are as follows: Dilute DON connected with BSA to the working concentrations: 125 μg/mL, the coating solution was added to the microplate. Then the microplate was incubated and washed. The blocking solution was used to block unbound sites, and then DON-A16 labeled with biotin at a concentration of 320 nM was added to the microtiter plate. The plates were washed with 1× PBST prior to incubation with the 1:1000 diluted HRP–streptavidin at 37°C for 45 min. The plate was washed thoroughly and color was developed using TMB. The reaction was ended using 2 M H2SO4, and the absorbance was measured at 450 nm with a microplate reader. Each experimental group has two parallel experiments.
2.3. Identification of DON by aptamer complementary strand competition
Streptavidin was diluted with a 0carbonate buffer (pH 9.0) and then coated with 200 μL per well. It was then reacted at 37°C. After 2 h, the 96-well plates were washed with pH 7.4 phosphate-buffered saline [1× phosphate buffer (PBS)+0.05 mL/100 mL Tween 20] about 3 times and then patted dry. Subsequently, 200 μL of 5 g/100 g BSA solution was added to block the microplates that were not completely coated with avidin, held at 37°C for 2 h, and patted dry. The 96-well plates were washed 3 times with a washing buffer and then patted dry. Up to 100 μL of the biotinylated aptamer DON-A16 was added to the microplate; 20 nM biotinylated DON-A16 com and 1:1000 diluted HRP–streptavidin were also added to the 96-well plates (). They were incubated at 37°C for 1 h. The plates were washed with 1× PBST prior to incubation with the mixture at 37°C for 45 min. The plates were washed thoroughly and color was developed using TMB. The reaction was ended using 2 M H2SO4, and the absorbance was measured at 450 nm with a microplate reader.
Table 1. The aptamers with higher frequency were obtained by sequencing: DON-A15, DON-A16.
Tabla 1. Los aptámeros con mayor frecuencia se obtuvieron por secuenciación: DON-A15, DON-A16
Table 2. Every synthetic sequence.
Tabla 2. Cada una de las secuencias sintéticas
2.4. Identification of aptamers by graphene oxide quenching fluorescence
The aptamer DON-A16 with the fluorescein amidite (FAM) label was dissolved in Tris–HCl buffer (pH 7.4), and the mixed solution was heated to 90°C for 5 min in a metal bath. After cooling to room temperature, a DON standard solution with a final concentration of 0.2 μg/mL was added to the FAM-labeled aptamer (200 nM) for 2 h. A GO buffer solution with a final concentration of 60 μg/mL was added and incubated at 37°C with shaking at 300 rpm for 60 min. After the reaction, the fluorescence intensity was determined to be 518 nm (emission wavelength) at an excitation wavelength of 479 nm.
3. Results and discussion
3.1. SELEX, cloning, sequencing, and structural analysis of DON-specific aptamers
Synthesis of the ssDNA library, optimization of PCR conditions, and modified immunoaffinity column-based SELEX are vital (Y. Wang et al., Citation2018). PCR was used to amplify the recovered products of SELEX 1–8 and verified by 2% agarose gel electrophoresis. The results showed that the bands were correct, clear, and bright, indicating that specific identifications aptamers were successfully screened. After connecting to pMD 18-T vector, the products were transformed to Escherichia coli receptive cells, and 50 monoclonals were randomly selected for sequencing. Aptamers with increased frequency were obtained by sequencing: DON-A15 and DON-A16 (). The obtained aptamer DON-A16 was predicted using the NUPACK software at 26°C (see Fig. S1 in the online supplement).
3.2. Enzyme-linked oligonucleotide assay
The specificity of the screened DON aptamers was calculated using the ELONA method. DON–BSA was used as a positive control; skim milk was used as a blank control; and AFB1, AFB2, ZEN, and OTA were designated as negative controls. DON-A16 specifically binds DON with high affinity compared with other targets, indicating increased specificity toward the target DON ()). The sequences of the DON-A16 aptamer are listed in .
Figure 1. (a) Increased specificity of the aptamer DON-A16 toward the target deoxynivalenol (DON); (b) Addition of DON-A16 aptamer at different concentrations to the DON to determine the binding affinity Kd values; (c) Limit of detection of DON at 31.25 μg/mL.
Figura 1. (a) Aumento de la especificidad del aptámero DON-A16 hacia el objetivo: deoxinivalenol (DON); (b) Adición del aptámero DON-A16 en diferentes concentraciones al DON para determinar los valores Kd de la afinidad de unión; (c) Límite de detección del DON a 31.25 μg/mL
To determine the binding affinity Kd values of DON-A16, different concentrations of aptamer DON-A16 were added to the DON ()). The binding affinity was determined by ELONA. GraphPad was used to perform nonlinear curve fitting analysis for Kd calculation. The strength of the binding affinity between the aptamer and the target molecule can be expressed by the dissociation constant Kd value. The smaller the Kd value, the greater the affinity between the aptamer and the target molecule. In this study, the concentration of the target molecule was used as the quantification, and the concentration of the nucleic acid aptamer was used as the variable. The affinity analysis of the aptamer DON-A16, which is the corresponding nucleic acid aptamer, was performed by ELONA. With the aptamer concentration as the abscissa and the absorbance at 450 nm as the ordinate, a nonlinear fitting curve was generated, and the Kd value was determined to be Kd = 110.9 ± 29.39 nM. When the aptamer concentration reached 320 nM, the affinity reached saturation. Thus, DON-A16 showed good affinity to the target DON.
The ELONA experiments revealed that 200 nM aptamer binds significantly to DON–BSA (0–500 μg/mL) at increasing concentrations, and the detection limit was 31.25 μg/mL) ()). ELONA requires DON at an increased concentration and has low sensitivity. Therefore, further research needs to be conducted to improve the sensitivity of DON.
3.3. Detection of DON by complementary strand competition
The aptamer is immobilized on the microplate by the biotin–streptavidin attachment. The amount of streptavidin coated on the microplate directly affects the number of binding aptamers at the bottom of the plate. Thus, the concentration of the prime coating determined the success of testing (the results are presented in Fig. S2 in the online supplement). As shown in ), when the streptavidin concentration is 10–20 μg/mL, the difference in OD 450 nm is basically saturated. This finding indicates that streptavidin exhibits the highest detection efficiency at the aforementioned concentration. To reduce the amount of anti-streptavidin, the optimal streptavidin concentration use for coating in this experiment was 10 μg/mL.
Figure 2. (a) Optimal coating concentration of streptavidin, 10 μg/mL; (b) Optimal aptamer concentration, 200 nmol/L; (c) Complementary strand concentration, 15 nM; (d) Good specificity exhibited by the aptamer (deoxynivalenol).
Figura 2. (a) Concentración óptima de recubrimiento de estreptavidina, 10 μg/mL; (b) Concentración óptima del aptámero, 200 nmol/L; (c) Concentración del filamento complementario, 15 nM; (d) Buena especificidad exhibida por el aptámero (deoxinivalenol)
The biotin-labeled aptamer concentration directly affects the amount of aptamers attached to the bottom of the plate. To evaluate the effect of aptamer concentration on the test results, the aptamer concentration was optimized. The test results are presented in ). As shown in ), as the aptamer concentration increases, the HRP content of the complementary strand and the amount of HRP introduced to the detection system increase as well. Therefore, the OD450 nm value also increases. However, when the aptamer concentration reaches 200 nM, the OD450 nm value almost reaches saturation, confirming that the aptamer is saturated at this point. Therefore, the aptamer concentration selected in the experiment was 200 nM.
The complementary strand concentration affects the amount of HRP enzyme that is ultimately attached to the bottom of the plate. To evaluate the effect of the complementary strand concentration of the aptamer on the test results, the complementary strand concentration is optimized. The experimental results are presented in ). As shown in the figure, as the complementary chain concentration increases, the OD450 nm value rises as well. When the complementary chain concentration reaches 10 nM, the OD450 nm value almost becomes saturated, confirming that the complementary chain is saturated at this point. The selected complementary strand concentration was 10 nM.
To verify the specificity of this detection method, several similar toxins (Rhodamine B, Borax, AFB1, and ZEN), skimmed milk, and DON were selected for testing under optimal conditions. The concentrations of DON and other control samples were 62.5 ng/μL. Differences in the results among the blanks, negative control wells, and positive wells were compared. As shown in ), the difference between DON and other controls is apparent. The occurrence can be observed with the naked eye during the experiment, indicating that the method exhibits good specificity.
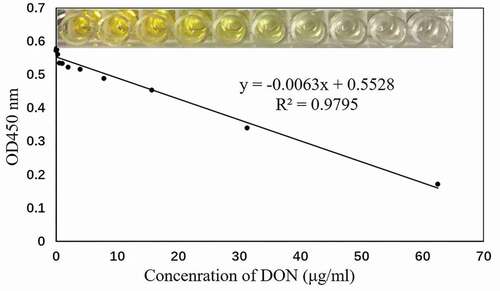
Under the optimal test conditions, the detection method in this study was applied to detect the presence of cadmium ion standard solutions at different concentrations but the same volume. The results revealed that cadmium ion concentration and OD450 nm exhibited good linearity at 0.2–62.5 ng/μL. The calibration curve equation was y = −0.0063x +0.5528, and the detection limit was 488 ng/μL ().
Figure 3. Linear range and limit of detection of deoxynivalenol.
Figura 3. Rango lineal y límite de detección del deoxinivalenol
3.4. GO fluorescence quenching and DON detection in food samples
We developed a FAM-labeled fluorescent aptamer sensor and GO for DON detection by GO quenching (see Fig. S3 in online supplement). After DON was added to the mixture, the FAM-labeled aptamer was converted from a single-stranded structure to a DON/DON-A16 aptamer after the target attached to the DON-A16 aptamer. Consequently, the FAM-labeled nucleic acid aptamer DON was released from the GO surface. When the FAM-labeled aptamer was released, the fluorescence of the FAM-labeled aptamer was recovered. This recovery was attributed to the quenching effect between GO fluorescence and FAM labeling. Meanwhile, the addition of other aflatoxins induced no structural changes in the DON aptamer, and the DON-A16 aptamer remained adsorbed on the GO surface, rendering the FAM-labeled aptamer unrecoverable. Thus, DON can be detected by monitoring the change in the fluorescence intensity of the FAM-labeled aptamer.
To determine whether GO was uniformly dispersed, transmission electron microscopy, ultraviolet spectroscopy, infrared spectroscopy, and X-ray diffraction were conducted. The dispersion was highly uniform (). shows that the prepared GO has a layered microstructure with nonuniform thickness; the higher the transparency, the thinner the GO-layered microstructures. Thus, we chose these parts as the basis of the experiment.
Figure 4. Evaluation of graphene oxide (a) transmission electron microscopy; (b) ultraviolet spectroscopy; (c) infrared spectroscopy; (d) X-ray diffraction.
Figura 4. Evaluación del óxido de grafeno (a) microscopía electrónica de transmisión; (b) espectroscopia ultravioleta; (c) espectroscopia infrarroja; (d) difracción de rayos X
The introduction of GO into the fluorescence detection platform result in a lower background with reduced fluorescence; meanwhile, increased GO concentrations may result in reduced fluorescence recovery. Therefore, the regulation of the amount of GO by FAM-labeled aptamers and DON was also investigated. The figure shows the change in fluorescence signal of the FAM-labeled aptamers as the GO concentration varies. As the GO suspension is added to the aptamer (FAM) and toxin in the solution, the aptamer fluorescence signal is rapidly quenched. As the GO content increases, the fluorescence signal of the fluorescent aptamer declines markedly and then stabilizes when the GO volume reaches 200 μL. The results ()) indicated that GO (60 μg/mL) could sufficiently quench the fluorescence intensity of the DON-based complex. Therefore, the experimental GO concentration of 60 μg/mL was used in the assay.
Figure 5. (a) Experimental volume of graphene oxide in the assay, 60 μg/mL; (b) Good relationship of deoxynivalenol (DON) with concertation at 0–4 μg/mL; (c) Sensing properties of FAM-labeled aptamer DON-A16 on DON; (d) Fluorescent aptamer DON-A16 specific to DON.
Figura 5. (a) Volumen experimental del óxido de grafeno en el ensayo, 60 μg/mL; (b) Buena relación del deoxinivalenol (DON) con la concentración a 0-4 μg/mL; (c) Propiedades de detección del aptámero DON-A16 etiquetado con FAM en DON; (d) Aptámero fluorescente DON-A16 específico para DON
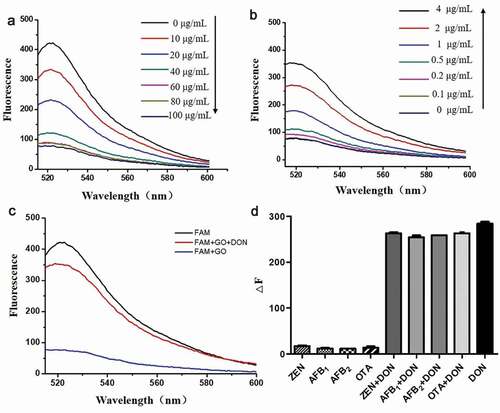
Sensitivity is a key parameter in determining the utility of an aptamer. To assess the sensitivity of the DON assay, DON at different concentrations was added to the mixture of FAM-labeled aptamers and GO. The fluorescence intensity of the FAM-labeled aptamer gradually increased as DON concentration increased, and a good relationship was observed when the concentration was in the 0–4 μg/mL range ()). This DON detection method had a LOD of 200 ng/mL.
Fluorescence experiments were performed to obtain the best sensing platform. The fluorescence intensity of the FAM-labeled aptamer with the target DON was significantly higher than the system without DON ()). The FAM-labeled aptamer was absorbed on the GO surface and quenched in the system without the target DON, significantly reducing the fluorescence intensity.
To study the specificity of the aptamer, sensors were identified by exposing the sensor to structurally similar mycotoxins. The fluorescence intensity of the FAM aptamer DON-A16 was measured in the presence of ZEN, AFB1, AFB2, and OTA under similar conditions ()). In contrast to the fluorescence intensity of the remaining structural analogs, only DON could cause a significant increase in fluorescence. The fluorescence intensity almost remained unchanged when DON was added to a mixture of ZEN, AFB1, AFB2, and OTA. Therefore, the FAM-labeled fluorescent aptamer sensor demonstrates good specificity for DON detection, indicating its potential application in complex sample analysis.
To confirm the feasibility of using fluorescence in DON detection in food samples, Avena sativa L, wheat, and corn were pre-treated. The food samples were ground, shaken, and centrifuged. The supernatant was extracted, and the double solution was mixed with it. For comparison (), the DON–ELISA method and the fluorescence method were used. The results showed that the recovery of the kit method ranged from 88% to 93%, and that of the fluorescent method ranged from 84% to 92%. No significant difference was observed between the two experimental methods. Therefore, this fluorescence method was a feasible method for detecting actual samples.
Table 3. Detection of DON in samples by Kit and Fluorescence method.
Tabla 3. Detección de DON en las muestras usando los métodos del kit y la fluorescencia
3.5. Molecular docking simulation
The lowest conformational energy is −5.42 kal/M, as determined by analysis of the results for 100 dockings (shown in Figure S4 in online supplement).
The DON ligand enters the target DNA binding site mainly via hydrophobic and van der Waals forces; the small molecule mainly interacts with the base sites of T14, G15, A16, C17, T36, G37, and T38 at the DNA active site.
The oxygen atoms on the DON ligand form hydrogen bonds with the hydrogen atoms on the T14, A16, and C17 bases, respectively. These hydrogen bonds are 2.1, 2.0, and 2.2 A in length, respectively.
4. Conclusion
In recent decades, aptasensors have drawn interest in the scientific community because of their simple, fast, and low-cost detection, in addition to their high sensitivity and good selectivity. DON-A16 is relatively fast and inexpensive to produce and can be chemically synthesized. This study outlines the use of aptamers in DON biosensors.
Currently, some biosensors combined with excellent nanomaterials such as graphene, metal nanoparticles, quantum dots, and so on are widely used in optical and electrochemical biosensors (Subak et al., Citation2020). Nanomaterials have a large surface-to-volume ratio and thus can achieve efficient target interaction(He & Wang, Citation2021). In addition, the development of nanocomposites can combine the advantages of multiple nanomaterials to develop new assays with ultrasensitivity and multiparameter functionality. With the combination of nanomaterials, biosensors exhibit considerably optimized and improved performance, enhancing the sensitivity and specificity of detection. Conventional biosensors have been miniaturized and are cost-efficient, but they have not achieved in vitro detection and are not easy to use and not suitable for home use. In addition, most biosensors lack relevant research for complex environmental detection. To date, commercial DON biosensors are still in their early stages of development. These concerns have yet to be explored.
Credits
QH and MQ conceived and designed research; XZ conducted experiments; XZ analyzed and arranged the experimental data; YS and JZ contributed new reagents and analytical tools; QH analyzed and wrote the manuscript.
Geolocation information
Kunming University of Science and Technology, Chenggong District, Kunming City, Yunnan Province, China.
Supplemental Material
Download MS Word (564 KB)Acknowledgments
To Kunming University of Science and Technology for providing all the facilities for this research and to Science and technology program of Yunnan Province (No. 201901T070129), Yunnan Biomedical Major Science and Technology project (No. 2019ZF004-1), Development project of Chinese Herbal Pieces Industry (No. 2019-YZ-029) for financial support.
Supplementary material
Supplemental data for this article can be accessed on the publisher’s website.
Additional information
Funding
References
- Bryla, M., Ksieniewicz-Wozniak, E., Waskiewicz, A., Szymczyk, K., & Jedrzejczak, R. (2018). Natural occurrence of nivalenol, deoxynivalenol, and Deoxynivalenol-3-Glucoside in polish winter wheat. Toxins (Basel), 10(2), 81–92. https://doi.org/https://doi.org/10.3390/toxins10020081
- Clemente, A. P. B., Kuang, H., Shabana, A. M., Labuza, T. P., & Kokkoli, E. (2019). Design of an aptamer-amphiphile for the detection of beta-lactoglobulin on a liquid crystal interface. Bioconjugate Chemistry, 30(11), 2763–2770. https://doi.org/https://doi.org/10.1021/acs.bioconjchem.9b00412
- Cunha, S. C., & Fernandes, J. O. (2010). Development and validation of a method based on a QuEChERS procedure and heart-cutting GC-MS for determination of five mycotoxins in cereal products. Journal of Separation Science, 33(4–5), 600–609. https://doi.org/https://doi.org/10.1002/jssc.200900695
- Dai, S., Wu, S., Duan, N., Chen, J., Zheng, Z., & Wang, Z. (2017). An ultrasensitive aptasensor for Ochratoxin A using hexagonal core/shell upconversion nanoparticles as luminophores. Biosensors and Bioelectronics, 91, 538–544. https://doi.org/https://doi.org/10.1016/j.bios.2017.01.009
- He, B., & Wang, K. (2021). A “signal off” aptasensor based on NiFe2O4 NTs and Au@Pt NRs for the detection of deoxynivalenol via voltammetry. Microchimica Acta, 188(1), 23. https://doi.org/https://doi.org/10.1007/s00604-020-04666-0
- He, D., Wu, Z., Cui, B., & Xu, E. (2020). Aptamer and gold nanorod-based fumonisin B1 assay using both fluorometry and SERS. Microchimica Acta, 187(4), 215. https://doi.org/https://doi.org/10.1038/s41592-018-0105-0
- Hong, K. L., & Sooter, L. J. (2017). In vitro selection of a single-stranded DNA molecular recognition element against the pesticide fipronil and sensitive detection in river water. International Journal of Molecular Sciences, 19(1), 85. https://doi.org/https://doi.org/10.3390/ijms19010085
- Huang, X., Huang, T., Li, X., & Huang, Z. (2020). Flower-like gold nanoparticles-based immunochromatographic test strip for rapid simultaneous detection of fumonisin B1 and deoxynivalenol in Chinese traditional medicine. Journal of Pharmaceutical and Biomedical Analysis, 177, 112895. https://doi.org/https://doi.org/10.1016/j.jpba.2019.112895
- Krysinska-Traczyk, E., Perkowski, J., & Dutkiewicz, J. (2007). Levels of fungi and mycotoxins in the samples of grain and grain dust collected from five various cereal crops in eastern Poland. Annals of Agricultural and Environmental Medicine, 14(1), 159–167.
- Maragos, C. M. (2011). Detection of deoxynivalenol using biolayer inter-ferometry. Mycotoxin Research, 27(3), 157–165. https://doi.org/https://doi.org/10.1007/s12550-011-0090-y
- Maresca, M. (2013). From the gut to the brain: Journey and pathophysiological effects of the food-associated trichothecene mycotoxin deoxynivalenol. Toxins (Basel), 5(4), 784–820. https://doi.org/https://doi.org/10.3390/toxins5040784
- Nutiu, R., & Li, Y. (2005). In vitro selection of structure-switching signaling aptamers. Angewandte Chemie International Edition, 44(7), 1061–1065. https://doi.org/https://doi.org/10.1002/anie.200461848
- Park, J. W., Tatavarty, R., Kim, D. W., Jung, H. T., & Gu, M. B. (2012). Immobilization-free screening of aptamers assisted by graphene oxide. Chem. Commun., 48(15), 2071–2073. https://doi.org/https://doi.org/10.1039/c2cc16473f
- Pestka, J. J. (2010). Deoxynivalenol: Mechanisms of action, human exposure, and toxicological relevance. Archives of Toxicology, 84(9), 663–679. https://doi.org/https://doi.org/10.1007/s00204-010-0579-8
- Pietsch, C., Katzenback, B. A., Garcia-Garcia, E., Schulz, C., Belosevic, M., & Burkhardt-Holm, P. (2015). Acute and subchronic effects on immune responses of carp (Cyprinus carpio L.) after exposure to deoxynivalenol (DON) in feed. Mycotoxin Research, 31(3), 151–164. https://doi.org/https://doi.org/10.1007/s12550-015-0226-6
- Righetti, L., Galaverna, G., & Dall’Asta, C. (2017). Group detection of DON and its modified forms by an ELISA kit. Food Additives & Contaminants. Part A, Chemistry, Analysis, Control, Exposure & Risk Assessment, 34(2), 248–254. https://doi.org/https://doi.org/10.1080/19440049.2016.1265671
- Rodríguez-Carrasco, Y., Moltó, J. C., Berrada, H., & Mañes, J. (2014). A survey of trichothecenes, zearalenone and patulin in milled grain-based products using GC-MS/MS. Food Chemistry, 146, 212–219. https://doi.org/https://doi.org/10.1016/j.foodchem.2013.09.053
- Rodríguez-Carrasco, Y., Moltó, J. C., Manes, J., & Berrada, H. (2017). Development of microextraction techniques in combination with GC-MS/MS for the determination of mycotoxins and metabolites in human urine. Journal of Separation Science, 40(7), 1572–1582. https://doi.org/https://doi.org/10.1002/jssc.201601131
- Setlem, K., Mondal, B., Ramlal, S., & Kingston, J. (2016). Immuno affinity SELEX for simple, rapid, and cost-effective aptamer enrichment and identification against aflatoxin B1. Frontiers in Microbiology, 7(26), 1909. https://doi.org/https://doi.org/10.3389/fmicb.2016.01909
- Strauss, S., Nickels, P. C., Strauss, M. T., Jimenez Sabinina, V., Ellenberg, J., Carter, J. D., Gupta, S., Janjic, N., & Jungmann, R. (2018). Modified aptamers enable quantitative sub-10-nm cellular DNA-PAINT imaging. Nature Methods, 15(9), 685–688. https://doi.org/https://doi.org/10.1038/s41592-018-0105-0
- Subak, H., Selvolini, G., Macchiagodena, M., Ozkan-Ariksoysal, D., Pagliai, M., Procacci, P., & Marrazza, G. (2020). Mycotoxins aptasensing: From molecular docking to electrochemical detection of deoxynivalenol. Bioelectrochemistry, 138, 107691. https://doi.org/https://doi.org/10.1016/j.bioelechem.2020.107691
- Tegegne, W. A., Mekonnen, M. L., Beyene, A. B., Su, W. N., & Hwang, B. J. (2019). Sensitive and reliable detection of deoxynivalenol mycotoxin in pig feed by surface enhanced Raman spectroscopy on silver nanocubes@polydopamine substrate. Spectrochimica Acta Part A: Molecular and Biomolecular Spectroscopy, 229, 117940. https://doi.org/https://doi.org/10.1016/j.saa.2019.117940
- Turner, P. C., Rothwell, J. A., White, K. L., Gong, Y., Cade, J. E., & Wild, C. P. (2008). Urinary deoxynivalenol is correlated with cereal intake in individuals from the United kingdom. Environmental Health Perspectives, 116(1), 21–25. https://doi.org/https://doi.org/10.1289/ehp.10663
- Valera, E., Garcia-Febrero, R., Elliott, C. T., Sanchez-Baeza, F., & Marco, M. P. (2019). Electrochemical nanoprobe-based immunosensor for deoxynivalenol mycotoxin residues analysis in wheat samples. Analytical and Bioanalytical Chemistry, 411(9), 1915–1926. https://doi.org/https://doi.org/10.1007/s00216-018-1538-0
- Wang, K., Huang, B., Zhang, J., Zhou, B., Gao, L., Zhu, L., & Jin, J. (2009). A novel and sensitive method for the detection of deoxynivalenol in food by time-resolved fluoroimmunoassay. Toxicology Mechanisms and Methods, 19(9), 559–564. https://doi.org/https://doi.org/10.3109/15376510903380720
- Wang, Y., Li, J., Qiao, P., Jing, L., song, Y. Z., Zhang, J. Y., Chen, Q., & Han, Q. Q. (2018). Screening and application of a new aptamer for the rapid detection of Sudan Dye III. European Journal of Lipid Science and Technology, 120(6), 1700112. https://doi.org/https://doi.org/10.1002/ejlt.201700112
- Xu, G., Zhao, J., Liu, N., Yang, M., Zhao, Q., Li, C., & Liu, M. (2019). Structure-guided post-SELEX optimization of an ochratoxin A aptamer. Nucleic Acids Research, 47(11), 5963–5972. https://doi.org/https://doi.org/10.1093/nar/gkz336
- Yu, Q., Li, H., Li, C. L., Zhang, S. X., Shen, J. Z., & Wang, Z. H. (2015). Gold nanoparticles-based lateral flow immunoassay with silver staining for simultaneous detection of fumonisin B 1 and deoxynivalenol. Food Control, 54, 347–352. https://doi.org/https://doi.org/10.1016/j.foodcont.2015.02.019