
 ?Mathematical formulae have been encoded as MathML and are displayed in this HTML version using MathJax in order to improve their display. Uncheck the box to turn MathJax off. This feature requires Javascript. Click on a formula to zoom.
ABSTRACT
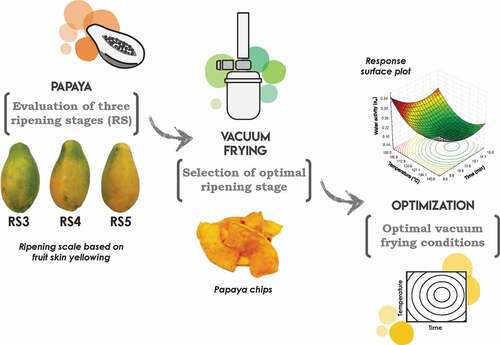
The aim of this study was to compare the physicochemical characteristics of papaya fruits from Costa Rica (Carica papaya L. cv Pococí) and vacuum-fried chips obtained from these fruits at three different postharvest ripening stages (RS3, RS4, and RS5) and select the optimal stage for vacuum frying. In addition, response surface methodology was used to optimize vacuum frying conditions (temperature and time) to obtain papaya chips with desirable characteristics. RS4 was found the most adequate ripening stage for processing papaya fruits to obtain vacuum-fried chips with suitable physicochemical characteristics and good sensory acceptance. The optimal vacuum frying conditions at 25 kPa were: 120 °C and 13.1 min. Vacuum frying caused 40 and 60% degradation of β-carotene and β-cryptoxanthin, respectively, and a 1.5-fold increase in the extractability of lycopene. The total carotenoid content of the vacuum-fried papaya chips was 381 mg/kg chips fresh weight.
GRAPHICAL ABSTRACT
RESUMEN
El objetivo de este estudio fue comparar las características fisicoquímicas de papaya de Costa Rica (Carica papaya L. cv Pococí) y chips fritos al vacío obtenidos de estos frutos en tres diferentes estados de maduración postcosecha (RS3, RS4 y RS5) y seleccionar el estado óptimo para freír al vacío. Además, se utilizó la metodología de superficie de respuesta para optimizar las condiciones de fritura al vacío (temperatura y tiempo) para obtener chips de papaya con características deseables. Se encontró que RS4 fue el estado de maduración más adecuado para procesar las papayas y así obtener los chips fritos al vacío con características fisicoquímicas adecuadas y con buena aceptación sensorial. Las condiciones óptimas de fritura al vacío a 25 kPa fueron: 120 °C y 13,1 min. La fritura al vacío provocó una degradación del 40 y 60% de β-caroteno y β-criptoxantina, respectivamente, y un aumento de 1,5 veces en la extractabilidad del licopeno. El contenido de carotenoides totales en los chips de papaya fritos al vacío fue de 381 mg/kg de chips.
1. Introduction
Papaya (Carica papaya L.) is a fruit native to America (possibly southern Mexico and neighboring Central America) belonging to the family Caricaceae (Saran et al., Citation2016). Papaya fruits are widely produced and consumed in almost all tropical and subtropical regions, the main producers being India, Brazil and Mexico (Food and Agriculture Organization [FAO], Citation2019). According to FAO statistics, about 13.02 million tons of papaya were produced in 2017 on 440,629 ha in different countries (FAO, Citation2019). In addition to its economic value, papaya is a valuable source of bioactive compounds, in particular provitamin A carotenoids, such as β-carotene (BC) and β-cryptoxanthin (BCX), and lycopene (LYC) (in red-fleshed papaya fruits) (United States Department of Agriculture Agricultural Research Service [USDA], Citation2020). Several epidemiological studies have concluded that diets rich in LYC foods are associated with a reduced risk of diseases including cancer (especially prostate cancer) and cardiovascular disease (Müller et al., Citation2016; Rao & Agarwal, Citation2000; Willcox et al., Citation2003). Papaya cultivars from Costa Rica and specially Pococí cultivar have been reported to contain high amounts of BC, BCX and LYC (Schweiggert et al., Citation2012).
Fruit quality is influenced greatly by fruit maturity at harvest. Changes in fruit skin color has been used as criterion during harvest to judge ripening. For instance, papaya fruit should be harvested when skin color changes from dark green to light green or when some skin yellowing develops (Saran et al., Citation2016). In many fruits, the physicochemical composition and micronutrient content vary with ripening. In papaya, total soluble solids, pulp firmness, color values, pigment contents, and carotenoid profiles change significantly during ripening (Schweiggert et al., Citation2011).
Papaya is sold primarily as a fresh product; however, it is a highly perishable fruit and about 30% of the production is compromised due to postharvest losses (Albertini et al., Citation2016). Commercially ripe fruits find possible applications in the preparation of syrups, dried products, yogurt, jam, jellies, nectars and sweets, among other foods (Annegowda & Bhat, Citation2016). Vacuum frying is an alternative technology for production of fruit snacks with higher sensory and nutritional quality than traditional fried snacks. This process is performed at pressures below atmospheric levels, which decreases the boiling points of the frying oil and the water in the product. The absence of air during the process inhibits lipid and pigment oxidation and preserves the natural color and nutrients of fried fruits (Andrés-Bello et al., Citation2011; Dueik & Bouchon, Citation2011; Da Silva & Moreira, Citation2008).
The application of vacuum frying for the development of papaya chips constitutes a promising option for processing this fruit, thus generating a novel product (that meets consumer expectations) and creating added value to this crop. There are a few studies about vacuum frying of papaya fruit. For instance, Wexler et al. (Citation2016) optimized the vacuum frying conditions for unripe papaya (green skin), a food matrix that does not present carotenoids and has lower moisture and sugar content than ripe papaya. Likewise, other authors have studied the effect of pretreatments of ripe papaya such as partial drying and freezing (Pandey et al., Citation2020) and the effect of frying temperature, time, and thickness of papaya slices (Pandey & Chauhan, Citation2019) on physicochemical and sensory properties of vacuum-fried papaya chips. However, in these latest studies only one ripening stage of papaya was evaluated.
Under this context, the present study compared the physicochemical characteristics and carotenoid profile of fresh Pococí papaya and vacuum-fried papaya chips obtained from these fruits at three different postharvest ripening stages (based on their skin yellowing). In addition, the sensory acceptance of papaya chips and the process yield were considered. Looking into above mentioned gaps this study was conducted to find out optimum ripening stage and frying conditions for making papaya chips.
2. Materials and methods
2.1. Materials
Red-fleshed papaya fruits (Carica papaya L.) from hermaphrodite plants of the commercial Costa Rican Pococí hybrid were acquired from OroFruits (Orotina, Alajuela, Costa Rica: 9°54ʹ45.8”N 84°30ʹ21.7”W) in August 2017 at three different postharvest ripening stages. Commercial palm olein frying oil D’orofrit (Grupo NUMAR, Costa Rica) was used.
2.2. Chemicals
The following chemicals were used: SigmaUltra standards for glucose, fructose, and sucrose from Sigma-Aldrich (St. Louis, MO, USA); β-carotene, β-cryptoxanthin and lycopene standards from Sigma-Aldrich (St. Louis, MO, USA). Other analytical grade chemicals and HPLC grade solvents were purchased from JT Baker Inc. (Phillipsburg, NJ, USA).
2.3. Characterization of papaya fruits at three postharvest ripening stages
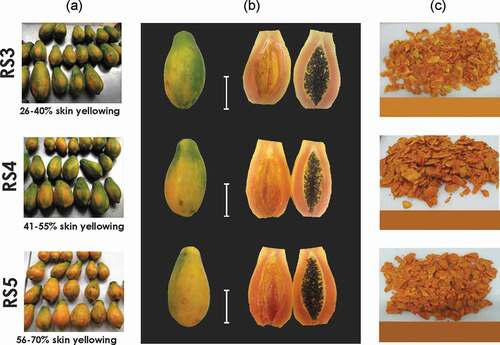
Papaya fruits at three postharvest ripening stages were evaluated for physicochemical characteristics and suitability for use in a vacuum frying process to obtain papaya chips. Fruit skin color was used as criterion to determine different ripening stages. This was assessed as a percentage of yellowing on the whole fruit (0–100%), using a ripening scale with seven categories or stages developed at Laboratorio de Tecnología Poscosecha (CIA, Universidad de Costa Rica): RS1 (0–15% yellowing), RS2 (16–25% yellowing), RS3 (26–40% yellowing), RS4 (41–55% yellowing), RS5 (56–70% yellowing), RS6 (71–80% yellowing), and RS7 (81–100% yellowing). The ripening stages used in the study, RS3, RS4 and RS5, are shown in . Preharvest RS2 papaya fruits (n = 75) were harvested manually and selected for color, elongated shape, and absence of physical or microbiological damage. Then, the fruits were stored at 25 °C for ripening until obtaining the skin color corresponding to the three ripening stages (RS3, RS4 and RS5), 25 fruits for each stage.
Figure 1. Papaya fruits (Carica papaya L., cv Pococí) at three ripening stages according to the percentage of skin yellowing: (a) batches of papaya fruits, (b) entire and halved fruits, (c) papaya chips obtained by vacuum frying. White bars mark 10 cm.
Figura 1. Papaya en tres estados de maduración según el porcentaje de color amarillo de la cáscara: (a) lotes de papaya fresca, (b) frutas enteras y en mitades, (c) chips de papaya obtenidos por fritura al vacío. Las barras blancas indican 10 cm
In order to characterize and standardize the three ripening stages, the following physicochemical properties were evaluated: skin and pulp firmness, pulp color (parameters L*, C* and h°), total soluble solids, proximal composition (moisture, protein, lipids, ash, total fiber), sugars, organic acids, and carotenoid content.
2.4. Effect of ripening stage on properties of vacuum-fried papaya chips
2.4.1. Sample preparation
Papaya fruits at the three postharvest ripening stages were washed and peeled manually. Each fruit was cut vertically into 4 pieces and the seeds were removed. The pre-cut pieces were then cut into 4-mm thick slices (dimensions of approximately 3 cm x 3 cm x 6 cm) using a slicing machine (FP-100 Hobart, CA, USA) prior to vacuum frying.
2.4.2. Vacuum frying
The papaya chips were obtained using a vacuum frying system (Auriol, Marmande, France) as shown in . The system consisted of a stainless-steel vessel (capacity of 80 L), electric heat resistors for heating the oil, a lid with a rotary axis coupled to a piston where a stainless-steel basket was placed, a temperature transducer, a filter, a heat exchanger to condense the water vapor generated during the process, a condensate vessel and a liquid ring vacuum pump. The frying process consisted of heating the oil (55 L) to the target temperature, loading the papaya slices (about 1 kg) into the basket, closing the lid, and depressurizing the vessel. Once the pressure reached 25 kPa, the basket was immersed into the oil for the predefined time to obtain the chips. When the frying step was completed, the basket was raised, and the centrifuging system was applied at 300 rpm (16.6 x g) for 3 min to control the oil absorption by the samples. Finally, the vessel was pressurized, and the papaya chips were removed from the fryer and cooled to ambient temperature prior to packaging ().
Figure 2. Sketch of the vacuum frying system used for obtaining the papaya chips: (a) basket in “bottom” position, (b) basket in “top” position.
Figura 2. Esquema del sistema de fritura al vacío utilizado para la obtención de los chips de papaya: (a) canasta en posición “inferior,” (b) canasta en posición “superior.”
2.4.3. Study design
In order to select the most promising ripening stage in papaya fruits for vacuum-fried chips, a random unrestricted design with a single factor (postharvest ripening stage: RS3, RS4 and RS5) was applied. Chips were obtained by vacuum frying under fixed conditions (25 kPa, 120 °C, 12 min) using the central point of central composite design described below. The physicochemical properties measured in the papaya chips were moisture, aw, lipid content, color difference and browning index. Sensory acceptance of the chips was also evaluated. Yields for each step in the process to obtain the papaya chips were determined for each ripening stage. Data for physicochemical properties, sensory panel acceptance, and yields were statistically analyzed with an analysis of variance (ANOVA) (p < .05). Significantly different means were further compared using Tukey’s test. The final goal was to select the ripening stage in papaya fruits that resulted in chips with the lowest aw, moisture and lipid content, color difference and browning index, and the highest sensory acceptance and yield.
2.5. Optimization of vacuum frying conditions
Response surface methodology (RSM) was used to optimize the vacuum frying process for papaya at the most promising ripening stage. A central composite design (CCD) with two independent variables was used: temperature/X1 (100–140°C) and time/X2 (9–15 min). The range of values for the selected variables was determined in preliminary RSM experiments. The two independent variables were coded at five levels (−1.414, −1.0, 0, +1, +1.414), which resulted in an experimental design of 11 experimental points including three replicates of the central point. Regression analysis was performed on data for dependent variables affected by the vacuum frying conditions (moisture content, aw, color difference, browning index, and lipid content) using the second order polynomial model shown in the following equation:
where Y represents the response variable; β0, βi, βii and βij are regression coefficients of variables for intercept, linear, quadratic and interaction terms, respectively; and Xi and Xj are independent variables. ANOVA, regression analysis, and plotting of response surfaces were performed using Statistica 7.0 (Statsoft Inc., USA). Models and regression coefficients with p-values below 0.05 were considered significant. The adequacy of the models was verified in extra experimental runs (three replicates) at optimal conditions (120°C, 13.1 min) selected from contour surfaces for the different response variables. The model was considered adequate if confidence intervals for experimental data and predicted values overlapped.
2.6. Characterization of vacuum-fried papaya chips
The impact of the vacuum frying process was evaluated using papaya chips obtained from papaya fruits at the most promising ripening stage and processed at optimized vacuum frying conditions. The following physicochemical properties of the chips were evaluated and compared to raw material (fresh papaya): color (parameters L*, C*, h°, color difference (ΔE) and browning index (BI)), proximal composition (moisture, protein, lipids, ash, dietary fiber), sugars, aw, and carotenoid content. The sorption isotherm of papaya chips at 25 °C was also determined.
2.7. Physicochemical analyses
Moisture, ash, protein, and total dietary fiber contents were determined by standard AOAC methods 920.151, 940.26, 920.152, and 985.29, respectively (Association of Official Analytical Chemists [AOAC], Citation2015). A nitrogen conversion factor of 6.25 was used to calculate protein content. Lipid content was determined by the method described by Carpenter et al. (Citation1993). Sugars (sucrose, glucose, and fructose) were determined by HPLC using a Shimadzu LC-6A (Kyoto, Japan) equipped with an EconosphereTM NH2 column (Alltech Associates, Deerfield, IL, USA) and a Shimadzu RID-6A refractive index detector (Kyoto, Japan), using conditions described previously (Gancel et al., Citation2011).
Total soluble solids (TSS, expressed as ◦Brix) were measured on a refractometer with a digital thermometer (model NAT-1T, Atago Co., Ltd., Tokyo, Japan) and automatic temperature compensation. Water activities of the samples at 25 °C were determined in triplicate using a water activity meter (Aqualab, model CX-2, Decagon Devices, Inc., Pullman, WA).
Color was measured in fresh papaya pulp on the whole fruit with a portable digital colorimeter WR-10 (Iwave, China), and in papaya chips with a color measurement spectrophotometer (model ColorFlex, HunterLab,Virginia, USA). For color determinations in both pulp fruit and papaya chips, color parameters were expressed in CIELab units L*, a* and b* using illuminant D65 and a 10◦ observer angle. Chroma (C*), and hue angle (h°) were calculated from a* and b* values as follows:
The color difference (ΔE) was calculated using positions in the three-dimensional (3-D) L*a*b* color space for papaya before (fresh papaya) and after (papaya chips) vacuum frying as shown in EquationEquation (4)(4)
(4) .
where L0*, a0*and b0* represented the values from fresh papaya, and L*, a* and b* represented the values from papaya chips, after vacuum frying. The browning index (BI)was calculated as follows (Pathare et al., Citation2013):
where L*, a* and b* represented the values from papaya chips, after vacuum frying. Skin and pulp firmness, expressed in Newtons (N), were determined in papaya fruits (n = 25) with a penetrometer (Chatillon, NY, USA) using a tooth-shaped tip. All measurements were performed at three points in the equatorial zone of each papaya. All physicochemical analyses were done in triplicate except for determination of pulp color parameters, TSS, and skin and pulp firmness in fresh papaya (n = 25).
2.8. Carotenoid analyses
Extraction procedures and conditions for analysis were described previously by Schweiggert et al. (Citation2012). Sample preparation was carried out under dim light. Samples were ground and weighed (3 g for papaya fruit and 2 g for papaya chips) in a 50 mL Pyrex flask and 0.1 g of NaCO3 was added. Carotenoids were extracted in 15 mL of a mixture (1:1:1, v/v/v) of methanol, ethyl acetate and light petroleum containing 0.1 g/L of BHT and 0.1 g/L of BHA (LP/BHT/BHA) using an IKA® Ultra-Turrax® (Merck KGaA, Darmstadt, Germany). The suspension was filtered through a Buchner funnel with Whatman qualitative filter paper No.1, and the recovered solids were re-extracted 2–3times until a colorless filtration residue was obtained. Filtrates were transferred to a separatory funnel with 15 mL H2O and 15 mL LP/BHT/BHA, and the upper fraction was washed with 15 mL H2O and recovered. For quantitative carotenoid extraction, the lower aqueous fraction was re-extracted 2–3 times with 10 mL LP/BHT/BHA. The combined upper fractions were dried with 5 g Na2SO4 and evaporated to complete dryness under reduced pressure at ≤25°C using a parallel evaporation system (Büchi MultivaporTM P-6, Flawil, Switzerland). The remaining residue was mixed with 5 mL of MTBE/methanol (9:1 v/v), membrane filtered (0.45 μm) and stored at −80°C in amber glass vials until HPLC analysis.
Carotenoid were identified using a reverse-phase HPLC-DAD Shimadzu system (Shimadzu Manufacturing, Inc., Canby, Oregon, USA) equipped with a SPD-M20A diode array detector, a DGU-20A5 degasser, a SIL-20AHT autosampler, a CTO-20A column oven and a LC-20AT binary gradient pump. Carotenoids were separated using a C30 column (150 x 4.6 mm i.d., 3 µm) (YMC America Inc., PA, USA) with a guard column. The mobile phase was methanol as eluent A and MTBE as eluent B. Operation temperature was set at 30°C. The flow rate was set at 0.6 mL/min and the injection volume was 10 μL. A solvent gradient was programmed as follows: 0–5 min, isocratic 80% A (initial conditions); 5–7 min, 73% A; 7–15 min, 62.5% A; 15–20 min, isocratic 62.5% A; 20–30 min, 45% A; 30–35 min, 10% A; 35–40 min, isocratic 10% A; 40–45 min, 80% A with a return to the initial conditions for rebalancing. All-E-β-cryptoxanthin (free form and ester forms), all-E-β-carotene and its isomers were detected at 450 nm, and all-E-lycopene and their isomers were detected at 470 nm (Dhuique-Mayer et al., Citation2007). Z-β-carotene and Z-lycopene contents were expressed as the sum of all Z-β-carotene and all Z-lycopene isomers, respectively. Isomers were identified by relative retention times, i.e. elution order and combined spectral data, based on previously published data obtained with the same mobile phase (MTBE/methanol) and detection wavelength range (Achir et al., Citation2015, Citation2010; Chanforan et al., Citation2012; Martins et al., Citation2016; Schweiggert et al., Citation2012, Citation2011). Analyses were done in triplicate and results were expressed in mg/kg.
2.9. Sensory acceptance
In order to evaluate the sensory acceptance of papaya chips prepared from fruits at different ripening stages, a sensory test was applied to regular consumers of snacks and fruits. The participants (n = 100) were between 18 and 60 years of age (40 men and 60 women). A hybrid hedonic scale was used with verbal affective anchors in the middle and extreme regions of the scale (0 = disliked extremely, 5 = neither liked nor disliked; 10 = liked extremely). This scale was used because it is more consumer-friendly than other unstructured scales (Villanueva et al., Citation2005). Papaya chips were prepared and packaged in PET-m/PE bags one week before the sensory test. Samples were removed from the bags 15 min prior to evaluation and 3–4 chips were placed on white plates coded with random 3-digit numbers and maintained at room temperature (25°C). Samples were presented randomly, and the participants were asked to drink water between samples.
2.10. Process yield
The yield for the process to obtain papaya slices prior to vacuum frying was determined by measuring the mass of the whole fresh papayas (mpapaya) and the mass of the papaya slices (mslices) after the peeling, deseeding and slicing (EquationEquation (6))(6)
(6) . The frying yield was calculated using the mass of papaya slices prior to frying and the mass of fried chips (mchips) (EquationEquation (7))
(7)
(7) . Finally, the overall process yield was determined as shown in EquationEquation (8)
(8)
(8) .
2.11. Water sorption isotherm
Papaya chips were blended and approximately 5 g of sample were placed in weighing capsules. Samples were transferred to vacuum desiccators containing saturated solutions of different salts to generate the desired water activity in the papaya chips at equilibrium. The desiccators were kept in ovens at 25°C. The weighing capsules containing the samples were hermetically sealed before transfer to the desiccators containing the saturated solutions. The saturated salt solutions and the aw at equilibrium were: LiCl (0.113), CaCl2 (0.280), K2CO3 (0.436), NaNO2 (0.640), NaCl (0.756), MgCl, (0.326), KNO3 (0.946). Samples (5 replicates for each aw at equilibrium) were considered to have reached the equilibrium point when the weight remained constant for three consecutive determinations. The equilibrium moisture content of the sample was determined using the AOAC method 920.151 (AOAC, Citation2015). A test tube containing thymol was placed inside the jars of higher water activity to prevent mold growth during storage. The Guggenheim-Anderson-de Boer (GAB) model shown in EquationEquation (9)(9)
(9) was applied to predict the sorption isotherm of papaya chips.
where Mw is the moisture content (g water/g dry solids); Mg is the GAB monolayer moisture content (g water/g dry solids); C is a constant related to the monolayer heat of sorption and K is a factor related to the heat of sorption of the multilayer.
2.12. Statistical analyses
The physicochemical characteristics of papaya fruits at three ripening stages were analyzed by one-way ANOVA and the post hoc Tukey-HSD test to detect significant differences (p < .05). Data obtained from the sensory panel, color evaluations and yield data were also analyzed by one-way ANOVA and post hoc Tukey-HSD (p < .05). The influence of vacuum frying on carotenoid content was evaluated using the Student’s t-test to detect significant differences (p < .05) between fresh papaya and papaya chips. Data were presented as mean ± standard deviation of replicates. Statistical analyses were performed using JMP 8.0 (SAS Institute, Inc., Cary, NC).
3. Results and discussion
3.1. Characterization of papaya fruits at three postharvest ripening stages
Papaya fruits at ripening stages RS3, RS4 and RS5 are shown in . These ripening stages were selected after preliminary analyses (data not shown), because they presented the most promising sensory and physicochemical features for production of papaya chips. The proximal composition (moisture, lipids, protein, ash, dietary fiber) of fresh papaya fruits at the three ripening stages is shown in . The results from proximal composition were similar to those reported for red-fleshed papaya fruit (USDA, Citation2020). Lipid content in Pococí papaya at the three ripening stages was below the detection limit of 0.10 g/100 g fresh weight (FW).
Table 1. Physicochemical properties and carotenoid contents of papaya Pococí (Carica papaya L.) at three ripening stages.
Tabla 1. Propiedades fisicoquímicas y contenido de carotenoides en papaya Pococí (Carica papaya L.) en tres estados de maduración
also shows organic acid content, total soluble solids (TSS), and sugar contents of papaya fruits. Glucose and fructose were the sugars present in fresh Pococí papaya, whereas sucrose was not detected (limit detection of 0.25 g/100 g FW). TTS content (expressed as °Brix), and organic acids presented in Pococí papaya, citric and succinic acids, were consistent with values reported by USDA (Citation2020) but were slightly higher than those reported for other papaya cultivars from Costa Rica and Mexico (Sancho et al., Citation2011; Schweiggert et al., Citation2011).
Color parameters in papaya pulp were similar to those reported previously for Pococí papaya (Schweiggert et al., Citation2012, Citation2011). Skin firmness values were higher than those reported by Schweiggert et al. (Citation2011) for Pococí papaya (14–16 N for fruits at ripening stages from RS3 to RS5). Pulp firmness in Pococí papaya was comparable to that reported by Barragán-Iglesias et al. (Citation2018) for Maradol papayas at ripening stages similar to those in our study.
also shows the carotenoid content of papaya fruit pulp. Ten carotenoids were identified in fresh papaya ( and ) based on standard retention times and combined spectral data (Chanforan et al., Citation2012; Martins et al., Citation2016; Schweiggert et al., Citation2012; Soto et al., Citation2020). β-carotene was presented as all-E-form (BC) and as a Z-isomer tentatively identified as 13Z-β-carotene (peak 2, and ). All-E-β-cryptoxanthin (BCX) was detected as free form and the corresponding caprate, laurate and myristate esters, peaks 5, 6 and 7, respectively ( and ). All-E-lycopene (LYC) was identified and three of its Z-isomers were detected and identified, namely 13Z-, 9Z- and 5Z-lycopene based on the III/II ratio, cis peak intensity, and absorption wavelength (peaks 8, 11 and 13, and ). The total carotenoid content of papaya fruits was 32.72–55.73 mg/kg FW; these results were similar to those reported for other varieties of papaya fruits from Costa Rica (Schweiggert et al., Citation2012), but higher than values reported for Maradol papaya from Mexico (Sancho et al., Citation2011), papaya from Sri Lanka (Chandrika et al., Citation2003) and Formosa papaya from Brazil (Soto et al., Citation2020). LYC was the main carotenoid in papaya fruits, representing 62.8–77.1% of total carotenoids, followed by BCX (free and ester forms) which, represented 18.9–23.2%. Laurate ester was the BCX form in the highest amounts. BC was found in lower amounts than the other all-E-carotenoids (2.9–6.1%). The relative proportion of Z-LYC (sum of Z-isomers) and Z-BC in papaya fruits was 4.0–5.2% and 1.2–2.8%, respectively.
Table 2. UV-Vis spectra of analyzed carotenoids in fresh papaya and papaya chips.
Tabla 2. Espectros UV-Vis de los carotenoides analizados en papaya fresca y en chips de papaya
Figure 3. HPLC separation of analyzed carotenoids monitored at 450 nm from: (a) fresh papaya, (b) papaya chips. For peak assignment, see .
Figura 3. Separación por HPLC de los carotenoides analizados y monitoreados a 450 nm: (a) papaya fresca, (b) chips de papaya. Para la asignación de picos, consultar la
There were no significant differences (p < .05) in proximal composition, TSS or succinic acid content among papaya fruits from different ripening stages. In contrast, skin and pulp firmness, L* and C* pulp color parameters and carotenoid content were significantly different (p < .05) in papaya fruits at the different ripening stages evaluated. Skin firmness was significantly lower at RS5 than at RS4 and RS3, while pulp firmness decreased at each successive ripeness stage. Fruit softening during ripening results from degradation of cell wall components through hydrolysis of pectin and hemicellulose caused by increased activity of polygalacturonase, β-galacatosidase and pectinesterase (Fabi et al., Citation2009; Manrique & Lajolo, Citation2004). shows a decrease of L* (lightness) and an increase of C* (color saturation) parameters with increasing ripeness. These differences were significant (p < .05) between RS3 and RS5. Color differences (ΔE) were less obvious between consecutive ripening stages RS3-RS4(ΔERS3 to RS4 = 3.5) and RS4-RS5(ΔERS4 to RS5 = 2.1) than between RS3 and RS5 (ΔERS3 to RS5 = 5.4). According to Obón et al. (Citation2009), ΔE values greater than 5 represent evident color differences that can be observed visually. Color changes in pulp during ripening are expected and result from changes in carotenoid accumulation.
Analysis of carotenoid content showed that all BCX ester forms, BC and LYC increased significantly (p < .05) in papaya fruits during the RS3-RS5 ripening stage. Z-isomer forms were not significantly different. Total BC (sum of all-E- and Z-forms) showed the greatest increase and was 3.7-fold higher in RS5 than at RS3. Total BCX and total LYC (sum of all-E- and Z-forms) contents were 2.1 and 1.5-fold higher, respectively. All-E-lycopene and β-cryptoxanthin laurate were the most abundant pigments in papaya pulp at the studied ripening stages. These results are consistent with those previously reported for Pococí papaya (Schweiggert et al., Citation2011). Skin/pulp firmness, pulp color parameters and carotenoid content were the parameters that differed among the Pococí papaya fruits at the different ripening stages of our study.
3.2. Effect of ripening stage on properties of vacuum-fried papaya chips
Papaya fruits at three ripening stages were vacuum fried to obtain papaya chips. Physicochemical properties (moisture, aw, lipids, color parameters) and sensory acceptance of papaya chips were analyzed. Yields were calculated to evaluate the feasibility of processing each ripening stage (). There were no significant differences (p > .05) in aw, moisture or lipid contents among papaya chips at different ripening stages produced under the vacuum frying conditions described in Section 2.4.2 (120 °C, 12 min, 25 kPa). However, color parameters in papaya chips showed significant differences (p < .05). this was expected because of the color differences in the fresh papaya pulp at different ripening stages. The color parameters L*, C* and h° were significantly higher (p < .05) for RS3 chips than for RS5 (). Likewise, ΔE (color difference relative to fresh papaya) was significantly higher (p < .05) for RS3 papaya chips than for RS5. The BI did not differ significantly among papaya chips obtained from different ripening stages. Color variation in papaya chips was most influence by L* (lightness). Papaya chips at RS3 were lighter in color than chips obtained from RS4 and RS5 fruits ()). Color differences between RS3 and RS5 papaya chips could be explained by the differences in the carotenoid content of the fresh papaya fruits before vacuum frying. Carotenoid content was higher in fresh papaya fruits at RS5 (55.74 ± 3.08 mg/kg FW) than at RS3 (32.72 ± 2.81 mg/kg FW).
Table 3. Physicochemical properties and sensory acceptance of vacuum-fried papaya chips, and yield process according to each ripening stage of papaya Pococí (Carica papaya L.).
Tabla 3. Propiedades fisicoquímicas y aceptación sensorial de chips de papaya fritos al vacío, y rendimiento del proceso según cada estado de maduración de papaya Pococí (Carica papaya L.)
The overall sensory acceptance of papaya chips by regular consumers of snacks and fruits ranged from 5.9–6.6 (). A score of 5 indicated that the evaluator neither liked nor disliked the product. Sensory acceptance was lower for RS3 chips than for RS4 and RS5 (p < .05). The purpose of this evaluation was to determine whether consumers liked the papaya chips and whether they preferred a specific ripening stage. Further sensory evaluations should be conducted to determine consumer preferences regarding appearance, aroma, taste, flavor, mouthfeel, and texture.
Overall process yields and yields for the operations for obtaining papaya slices (peeling+deseeding+slicing) and papaya chips (vacuum frying) are shown for each ripening stage in . Overall yields were lowest (p < .05) for RS5 papaya fruit. Overall yields for RS3 and RS4 fruit were not significantly different (p > .05). Skin and pulp firmness of papaya fruits were lowest at RS5. Fruit softening at this ripeness stage caused losses during the peeling and slicing steps; further losses occurred during vacuum frying due to the RS5 papaya slices sticking to the basket. Considering the physicochemical properties, sensory acceptance and overall process yield, the RS4 ripeness stage (41–55% skin yellowing) was selected for processing to obtain vacuum-fried papaya chips.
3.3. Optimization of vacuum frying conditions
3.3.1. Influence of vacuum frying conditions on physicochemical properties of papaya chips
Response surface methodology (RSM) was used to optimize vacuum frying conditions to obtain papaya chips from fruits at RS4. Temperature (X1) and time (X2) of the frying process were evaluated using a central composite design (CCD). Results of the RSM experiments on moisture content, lipid content, water activity, color change (∆E), and browning index (BI) of vacuum‐fried papaya chips are shown in . Moisture ranged from 0.45 to 2.25 g/100 g FW, aw ranged from 0.177 to 0.270, lipid content ranged from 20.57 to 39.43 g/100 dry weight (DW), ∆E from 11.45 to 31.92 and BI ranged from 162.97 to 227.35 (). All of the models were significant (p < .05) with R2 and R2-adj values higher than 0.87 and 0.81, respectively, for all models except lipid content (R2 = 0.74, R2-adj = 0.63) (). Lack of fit was non-significant for all of the models (p > .05).
Table 4. Two factor-five level central composite design and experimental data for the responses.
Tabla 4. Diseño compuesto central de dos factores y cinco niveles y datos experimentales para las respuestas
Table 5. Regression coefficients and analysis of the model for response variables.
Tabla 5. Coeficientes de regresión y análisis del modelo para las variables respuesta
As shown in , the moisture content of papaya chips was significantly (p < .05) affected by frying temperature and frying time. The contour plot () for moisture revealed that the moisture content of papaya chips decreased with increasing temperature and increased slightly with shorter frying times at all temperatures. As seen in , aw was significantly affected (p < .05) by frying temperature and frying time (both linear and quadratic effects). The lowest values for aw were reached at high temperatures and long vacuum frying times (). This was expected since frying is a dehydration/cooking process; higher temperatures and longer times cause more evaporation in the sample and result in lower food product moisture content and aw. These results are consistent with those reported for other food products obtained by vacuum frying: carrot (Fan et al., Citation2005), pineapple (Perez‐Tinoco et al., Citation2008), gold kiwi (L. Diamante et al., Citation2011), apple (Bravo et al., Citation2011), and apricot (L. M. Diamante et al., Citation2012).
Figure 4. Response surface plots for moisture (a), aw (b), lipids, dry weight (c), color difference (d) and browning index (e) as function of temperature and time of vacuum frying.
Figura 4. Gráficos de superficie de respuesta para humedad (a), aw (b), lípidos, base seca (c), diferencia de color (d) e índice de pardeamiento (e) en función de la temperatura y el tiempo de fritura al vacío
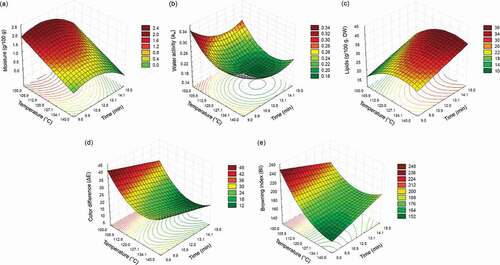
shows that lipid content of papaya chips (expressed as dry weight) increased with increasing temperatures and longer frying times. The final oil content of fried products can be affected by product shape, temperature and frying time, moisture content, porosity, pore-size distribution, and pre- and post-treatments (Moreira, Citation2012). Oil absorption results from competition between drainage and suction into the porous crust once the food is removed from the frying medium and cooling begins (when the temperature decreases and the gas pressure inside the pores is lower than outside) (Moreira, Citation2012). Transport phenomena during food processing are greatly influenced by product microstructure. Dueik et al. (Citation2012) found a good correlation between porosity and final oil content in vacuum-fried products; oil absorption was highest in products with the highest accumulative pore volume. Mass transfer phenomenon (water loss and oil uptake) not only depends on the process conditions (oil temperature, frying time, and pressure) but also on other factors related to the food product, such as its size, shape, and thickness (Moreira, Citation2012).
shows the surface plot for color difference (ΔE) of papaya chips as affected by frying temperature (linear and quadratic effects) and frying time (linear effect). The color difference of vacuum-fried papaya chips decreased with increasing frying time and temperature (). These results are similar to those reported for vacuum-fried apricot slices (L. Diamante et al., Citation2011). Changes in papaya chip color with respect to fresh papaya were expected due to carotenoid degradation and non-enzymatic browning reactions (e.g., Maillard reaction, caramelization reaction) (Andrés-Bello et al., Citation2011). shows the surface plot for the browning index (BI) of papaya chips as affected by frying temperature (linear and quadratic effects) (). BI in papaya chips increased with decreasing temperature and was highest at low temperature and short frying times (temperature-time interaction effect) as shown in . Similar results were observed by Ihns et al. (Citation2011) for apricot slices dried at different temperatures. Reducing sugars could be related to Maillard or caramelization reactions producing colored compounds. However, further studies are needed to identify the specific compounds involved in browning and elucidate the mechanisms involved in sugar reactions during the frying of papaya.
3.3.2. Optimum vacuum frying conditions and model verification
RSM showed that the moisture content, aw, and color difference in papaya chips decreased at high temperatures (120–140 °C) and long frying times (12–15 min). The browning index was lower at short frying times (9–13.1 min) at high temperatures (120–140 °C), while lipid content was lower at short frying times (9–13.1 min) at low temperatures (100–120 °C). For chips, color and texture (crispiness) are quality factors that must be considered. Loss of crispiness during storage of dried chips is related to an increase in moisture content; therefore, moisture content and water activity in these products must be low enough to ensure adequate shelf life (Wexler et al., Citation2016). In addition, low lipid content is desirable in fried products as current consumer trends require food products with better nutritional profiles. shows the verification of models using the optimum conditions (120 °C and 13.1 min) selected after the RSM analysis. The confidence intervals (α = 5%) overlapped for experimental and predicted values for moisture, aw, lipid content, ΔE and BI. This indicates that the regression models can predict response variables for any combination of frying temperature and frying time in the experimental ranges tested in this study.
Table 6. Experimental and predicted values of responses under optimum vacuum frying conditions.
Tabla 6. Valores experimentales y predichos de las variables respuesta en las condiciones óptimas de fritura al vacío
3.4. Characterization of vacuum-fried papaya chips
shows the proximal composition (moisture, lipids, protein, ash, and dietary fiber), total sugar content, aw, color parameters (L*, C*, h°, ΔE, and BI) and carotenoid contents of fresh papaya at ripening stage RS4 and papaya chips obtained from RS4 Pococí papaya by vacuum frying at optimized conditions. The values for moisture content (<2 g/100 g) and aw (<0.2) of the papaya chips were typical for dried snack products. These results are similar to those obtain for vacuum-fried papaya chips made with Coorg honey dew variety (Pandey & Chauhan, Citation2019; Pandey et al., Citation2020) and Formosa variety (Soto et al., Citation2020).
Table 7. Physicochemical properties and carotenoid contents of papaya Pococí (Carica papaya L.) at RS4 and papaya chips obtained at optimum vacuum frying conditions.
Tabla 7. Propiedades fisicoquímicas y contenido de carotenoides en papaya Pococí RS4 (Carica papaya L.) y en chips de papaya obtenidos en condiciones óptimas de fritura al vacío
shows the moisture sorption isotherm for papaya chips at 25 °C, which is the average daytime storage temperature in tropical conditions. The sorption isotherm shown in corresponds to the type III behavior found in sugar-rich foods (e.g., dried fruit products) due to the solubility of sugars in water (Al-Muhtaseb et al., Citation2002). The GAB model adequately fit the experimental data (R2 = 0.999, R2-adj = 0.998) to describe the adsorption behavior of vacuum-fried papaya chips at 25 °C. The GAB model better described the moisture content in papaya chips than the regression model obtained by RSM. Predicted values for moisture content in papaya chips (aw = 0.170 ± 0.025, moisture = 1.90 ± 0.55 FW) were 1.62 ± 0.28 g/100 g FW (GAB model) and 1.14 ± 0.28 g/100 g FW (RSM-regression model). The GAB model is widely used because this 3-parameter equation provides estimates of the monolayer moisture content (Mg), which is defined as the water necessary to cover the entire food surface by absorption to hydrophilic and polar groups. From a practical point of view, the Mg value is the moisture content for maximum product stability (Caballero-Cerón et al., Citation2015). In papaya chips, this value was 0.0929 g water/g DW. In dried foods with a high sugar content such as papaya chips (~43 g sugars/100 g chips FW), values lower than the monolayer moisture content are recommended to improve food stability (Welti-Chanes et al., Citation2007). The final moisture content of the papaya chips (0.0194 g water/g DW) was lower than the Mg given by the model. Dried products with aw values between 0.1 and 0.3 are microbiologically stable and have a long shelf-life as long as there is no change in moisture content during storage (Labuza & Altunakar, Citation2007).
Figure 5. Experimental data for vacuum-fried papaya chips and predicted sorption isotherm using GAB equation at 25 °C. Mg, C and K are the parameters obtained from GAB equation (see Section 2.11), the standard error for these parameters is expressed in brackets (n = 5).
Figura 5. Datos experimentales para chips de papaya fritos al vacío e isoterma de sorción predicha utilizando la ecuación GAB a 25 °C. Mg, C y K son los parámetros obtenidos de la ecuación GAB (ver sección 2.11), el error estándar para estos parámetros se expresa entre paréntesis (n = 5)
The lipid content was ~29 g/100 g FW (~30 g/100 g dry weight, DW). The oil content of papaya chips obtained in this study was higher than that reported by Pandey et al. (Citation2020). These authors found an oil content that ranged from 19.61 ± 0.08 to 25.45 ± 0.14 g/100 DW. In order to reduce the oil content in the chips, it is necessary to allow adequate oil drainage (using a centrifuge) when the product is removed from the fryer under vacuum (before pressurization of the vessel). For instance, by applying a higher speed of centrifugation to the fried product the more oil on the surface product could be removed (Moreira, Citation2012). In addition, partial drying before vacuum frying and an increase in the thickness of slices reduce the oil uptake in papaya chips (Pandey & Chauhan, Citation2019; Pandey et al., Citation2020).
Protein, ash, and dietary fiber contents in papaya chips were 7, 6 and 8-fold higher than in fresh papaya. The increase in these parameters was expected and is a consequence of dehydration during vacuum frying. The sugar content was less than 10% of the fresh weight of fresh papayas and almost 43% of the fresh weight of papaya chips. Similar results were obtained previously by Soto et al. (Citation2020) for vacuum-fried papaya chips obtained from Formosa papaya at the same ripening stage (RS4).
shows that the color parameters for papaya chips and fresh papaya pulp were similar. The color difference (ΔE) in papaya chips with respect to fresh papaya was 15.43. ΔE values greater than 5 represent an evident color difference for human visual observation (Obón et al., Citation2009). L. Diamante et al. (Citation2011) suggested that a ΔE of 20 or less was acceptable for vacuum-fried gold kiwi, but this value depends on each food product. The browning index (BI) in papaya chips was ~172. BI is defined as brown color purity and is one of the most common indicators of browning in food products containing sugars (Pathare et al., Citation2013). In general, vacuum-fried fruit snacks retain more of their natural color due to lesser oxidation and lower frying temperatures (Andrés-Bello et al., Citation2011) as shown in ).
Thirteen carotenoids were identified in papaya chips () and ). Three additional carotenoids not found in fresh papaya were present in papaya chips due to the formation of Z- β-carotene isomer (peak 4, tentatively identified as 9Z-β-carotene) and Z-lycopene isomers (peaks 9 and 10, tentatively identified as 5Z-13ʹZ- and DiZ-lycopene, respectively) shown in ). The 9Z-β-carotene is usually formed under severe process conditions such as thermal treatments above 100°C, while 13Z-β-carotene is predominant at lower temperatures (Pénicaud et al., Citation2011). Mono-Z-lycopene isomers (such as 5Z-,9Z-, and 13Z-lycopene) can be present in fresh fruits, whereas di-Z-lycopene isomers are more likely to be in processed food products (Chanforan et al., Citation2012). Fresh papaya and papaya chips obtained from fruits at RS4 contained 45.67 ± 2.50 mg/kg FW and 381.06 ± 41.17 mg/kg FW of total carotenoids, respectively. The carotenoid content in papaya chips was comparable to other similar products such as non-fat orange sweet potato chips (Bechoff et al., Citation2010), but was 2, 2.4 and 26-fold higher than that of fried orange sweet potato chips (Da Silva & Moreira, Citation2008), fried papaya chips obtained from Formosa papaya fruits (Soto et al., Citation2020), and fried mango chips (Da Silva & Moreira, Citation2008), respectively. These results confirm that papaya chips are a good source of carotenoids, especially lycopene.
The carotenoids in papaya chips identified by HPLC-DAD were, in descending order by content, all-E-lycopene (LYC), Z-lycopene (Z-LYC), all-E-β-cryptoxanthin (BCX, free and ester forms, primarily laurate ester), Z-β-carotene (Z-BC) and all-E-β-carotene (BC). LYC was the main carotenoid in both fresh papaya and chips, representing 68.8 and 69.4% of total carotenoids, respectively. The relative proportion of BCX and BC decreased after vacuum frying, from 20.7% to 6.0% (BCX) and 4.2% to 1.8% (BC). The relative proportion of Z-LYC increased from 4.0% (fresh papaya) to 20.5% (chips). There was no change in Z-BC (2.3% in both fresh papaya and chips).
compares the carotenoid content expressed as non-fat dry weight of fresh papaya and papaya chips. There was a significant effect of vacuum frying on BCX, BC and Z-LYC content, according to Student’s test (p < .05). Under the optimized conditions (T = 120 °C, t = 13.1 min, P = 25 kPa), BCX and BC were degraded by 60% and 40%, respectively, whereas LYC content was 1.5-fold higher after vacuum frying. LYC has poor solubility and accumulates in the papaya matrix as crystals associated with plastid membranes. Oil absorption in chips increases the dissolution of lycopene crystalline structures and enhances its extractability. The Z-forms, Z-BC and Z-LYC increased 1.4 and 7.4-fold, respectively. This agrees with previous reports that thermal processes favor isomerization of carotenoids from all-E to Z-forms, especially at temperatures higher than 100°C when these compounds are dissolved in lipids (Achir et al., Citation2011; Ahmed et al., Citation2002; Ayari et al., Citation2015).
Figure 6. Carotenoid concentrations in fresh papaya and papaya chips. Bars are expressed as the mean ± standard deviation (n = 3). For each carotenoid means with the same letter are not significantly different (Student’s t-test, p < 0.05). RS4, ripening stage 4; NF-DW, non-fat dry weight. BCX, all-E-β-cryptoxanthin, sum of free and esters forms; BC, all-E-β-carotene; LYC, all-E-lycopene; Z-BC, Z-β-carotene; Z-LYC, Z-lycopene.
Figura 6. Concentración de carotenoides en papaya fresca y chips de papaya. Las barras se expresan como la media ± desviación estándar (n = 3). Para cada carotenoide, los valores con la misma letra no son significativamente diferentes (prueba t de Student, p < 0,05). RS4, etapa de maduración 4; NF-DW, base seca no grasa. BCX, all-E-β-criptoxantina, suma de formas libres y ésteres; BC, all-E-β-caroteno; LYC, all-E-licopeno; Z-BC, Z-β-caroteno; Z-LYC, Z-licopeno
4. Conclusions
Differences in physicochemical composition were found among Costa Rican papaya fruits (Carica papaya L., cv Pococí) at three ripening stages (RS3, RS4, and RS5), such as skin and pulp firmness, color parameters, and carotenoid content. Pococí papaya fruits at ripening stage RS4 were the most suitable for vacuum frying to obtain chips with acceptable physicochemical and sensory characteristics. At an operating pressure of 25 kPa, the optimum oil temperature was 120°C and the optimum frying time was 13.1 min. These frying conditions allowed us to obtain quality vacuum-fried papaya chips. Concerning the carotenoid content, at optimal frying conditions, degradation of 40% and 60% for BC and BCX occurred, respectively, and there was a 1.5-fold increase in LYC extractability. These results showed that papaya chips are a good source of carotenoids, especially LYC, and could be an alternative source for vitamin A, as BC and BCX provide retinol activity. Further research is needed to understand the physical and chemical phenomena involved in carotenoid reactivity during vacuum frying of papaya fruits.
Acknowledgments
The authors thank Daniela Salazar for her collaboration in the development of the ripening scale for Pococí papaya, and Geovanny Peraza from OroFruits for providing fresh papaya fruits.
Disclosure statement
No potential conflict of interest was reported by the authors.
Additional information
Funding
References
- Achir, N., Hadjal, T., Madani, K., Dornier, M., & Dhuique-Mayer, C. (2015). Carotene reactivity in pink grapefruit juice elucidated from model systems and multiresponse modeling. Journal of Agricultural and Food Chemistry, 63(15), 3970–3979. https://doi.org/https://doi.org/10.1021/acs.jafc.5b00509
- Achir, N., Pénicaud, C., Avallone, S., & Bohuon, P. (2011). Insight into β-carotene thermal degradation in oils with multiresponse modeling. JAOCS: Journal of the American Oil Chemists’ Society, 88(12), 2035–2045. https://doi.org/https://doi.org/10.1007/s11746-011-1864-2
- Achir, N., Randrianatoandro, V. A., Bohuon, P., Laffargue, A., & Avallone, S. (2010). Kinetic study of β-carotene and lutein degradation in oils during heat treatment. European Journal of Lipid Science and Technology, 112(3), 349–361. https://doi.org/https://doi.org/10.1002/ejlt.200900165
- Ahmed, J., Shivhare, U. S., & Sandhu, K. S. (2002). Thermal degradation kinetics of carotenoids and visual color of papaya puree. Journal of Food Science, 67(7), 2692–2695. https://doi.org/https://doi.org/10.1111/j.1365-2621.2002.tb08800.x
- Albertini, S., Reyes, A. E. L., Trigo, J. M., Sarriés, G. A., & Spoto, M. H. F. (2016). Effects of chemical treatments on fresh-cut papaya. Food Chemistry, 190, 1182–1189. https://doi.org/https://doi.org/10.1016/J.FOODCHEM.2015.06.038
- Al-Muhtaseb, A. H., McMinn, W. A. M., & Magee, T. R. A. (2002). Moisture sorption isotherm characteristics of food products: A review. Food and Bioproducts Processing, 80(2), 118–128. https://doi.org/https://doi.org/10.1205/09603080252938753
- Andrés-Bello, A., García-Segovia, P., & Martínez-Monzó, J. (2011). Vacuum frying: An alternative to obtain high-quality dried products. Food Engineering Reviews, 3(2), 63–78. https://doi.org/https://doi.org/10.1007/s12393-011-9037-5
- Annegowda, H. V., & Bhat, R. (2016). Composition of papaya fruit and papaya cultivars. In M. S. J. Simmonds & V. R. Preedy (Eds.), Nutritional composition of fruit cultivars (pp. 497–516). Academic Press.
- Association of Official Analytical Chemists (AOAC). (2015). Official methods of analysis.
- Ayari, A., Achir, N., Servent, A., Ricci, J., & Brat, P. (2015). Development of a nutritional profile predicting tool for fresh and processed tomato-based products. International Journal of Food Science and Technology, 50(7), 1598–1606. https://doi.org/https://doi.org/10.1111/ijfs.12811
- Barragán-Iglesias, J., Méndez-Lagunas, L. L., & Rodríguez-Ramírez, J. (2018). Ripeness indexes and physicochemical changes of papaya (Carica papaya L. cv. Maradol) during ripening on-tree. Scientia Horticulturae, 236, 272–278. https://doi.org/https://doi.org/10.1016/j.scienta.2017.12.012
- Bechoff, A., Dhuique-Mayer, C., Dornier, M., Tomlins, K. I., Boulanger, R., Dufour, D., & Westby, A. (2010). Relationship between the kinetics of β-carotene degradation and formation of norisoprenoids in the storage of dried sweet potato chips. Food Chemistry, 121(2), 348–357. https://doi.org/https://doi.org/10.1016/j.foodchem.2009.12.035
- Bravo, J., Sanjuán, N., Clemente, G., & Mulet, A. (2011). Pressure effect on deep fat frying of apple chips. Drying Technology, 29(4), 472–477. https://doi.org/https://doi.org/10.1080/07373937.2011.560801
- Caballero-Cerón, C., Guerrero-Beltrán, J. A., Mújica-Paz, H., Torres, J. A., & Welti-Chanes, J. (2015). Moisture sorption isotherms of foods: Experimental methodology, mathematical analysis, and practical applications. In G. F. Gutiérrez-López, L. Alamilla-Beltrán, M. P. Buera, J. Welti-Chanes, & G. V. Barbosa-Cánovas (Eds.), Water stress in biological, chemical, pharmaceutical and food systems (pp. 187–214). Springer.
- Carpenter, D. E., Ngeh-Ngwainbi, J., & Lee, S. (1993). Lipid analysis. In D. M. Sullivan & D. E. Carpenter (Eds.), Methods of analysis for nutritional labeling (pp. 84–105). Association of Official Analytical Chemists.
- Chandrika, U. G., Jansz, E. R., Wickramasinghe, S. N., & Warnasuriya, N. D. (2003). Carotenoids in yellow‐and red‐fleshed papaya (Carica papaya L). Journal of the Science of Food and Agriculture, 83(12), 1279–1282. https://doi.org/https://doi.org/10.1002/jsfa.1533
- Chanforan, C., Loonis, M., Mora, N., Caris-Veyrat, C., & Dufour, C. (2012). The impact of industrial processing on health-beneficial tomato microconstituents. Food Chemistry, 134(4), 1786–1795. https://doi.org/https://doi.org/10.1016/j.foodchem.2012.03.077
- Da Silva, P. F., & Moreira, R. G. (2008). Vacuum frying of high-quality fruit and vegetable-based snacks. LWT - Food Science and Technology, 41(10), 1758–1767. https://doi.org/https://doi.org/10.1016/j.lwt.2008.01.016
- Dhuique-Mayer, C., Tbatou, M., Carail, M., Caris-Veyrat, C., Dornier, M., & Amiot, M. J. (2007). Thermal degradation of antioxidant micronutrients in citrus juice: Kinetics and newly formed compounds. Journal of Agricultural and Food Chemistry, 55(10), 4209–4216. https://doi.org/https://doi.org/10.1021/jf0700529
- Diamante, L., Presswood, H., Savage, G. P., & Vanhanen, L. P. (2011). Vacuum fried gold kiwifruit: Effects of frying process and pre-treatment on the physico-chemical and nutritional qualities. International Food Research Journal, 18, 632–638. https://doi.org/https://doi.org/10.182/7061
- Diamante, L. M., Savage, G. P., Vanhanen, L. E. O., & Ihns, R. (2012). Vacuum‐frying of apricot slices: Effects of frying temperature, time and maltodextrin levels on the moisture, color and texture properties. Journal of Food Processing and Preservation, 36(4), 320–328. https://doi.org/https://doi.org/10.1111/j.1745-4549.2011.00598.x
- Dueik, V., & Bouchon, P. (2011). Vacuum frying as a route to produce novel snacks with desired quality attributes according to new health trends. Journal of Food Science, 76(2), 1–8. https://doi.org/https://doi.org/10.1111/j.1750-3841.2010.01976.x
- Dueik, V., Moreno, M. C., & Bouchon, P. (2012). Microstructural approach to understand oil absorption during vacuum and atmospheric frying. Journal of Food Engineering, 111(3), 528–536. https://doi.org/https://doi.org/10.1016/j.jfoodeng.2012.02.027
- Fabi, J. P., Cordenunsi, B. R., Seymour, G. B., Lajolo, F. M., & Do Nascimento, J. R. O. (2009). Molecular cloning and characterization of a ripening-induced polygalacturonase related to papaya fruit softening. Plant Physiology and Biochemistry, 47(11–12), 1075–1081. https://doi.org/https://doi.org/10.1016/J.PLAPHY.2009.08.002
- Fan, L. P., Zhang, M., Xiao, G. N., Sun, J. C., & Tao, Q. (2005). The optimization of vacuum frying to dehydrate carrot chips. International Journal Of Food Science & Technology, 40(9), 911–919. https://doi.org/https://doi.org/10.1111/j.1365-2621.2005.00985.x
- Food and Agriculture Organization (FAO). (2019). FAOSTAT database. Food and Agriculture Organization of the United Nations. http://www.fao.org/faostat/en/#data/QC/visualize
- Gancel, A. L., Feneuil, A., Acosta, O., Pérez, A. M., & Vaillant, F. (2011). Impact of industrial processing and storage on major polyphenols and the antioxidant capacity of tropical highland blackberry (Rubus adenotrichus). Food Research International, 44(7), 2243–2251. https://doi.org/https://doi.org/10.1016/j.foodres.2010.06.013
- Ihns, R., Diamante, L. M., Savage, G. P., & Vanhanen, L. (2011). Effect of temperature on the drying characteristics, colour, antioxidant and beta‐carotene contents of two apricot varieties. International Journal of Food Science & Technology, 46(2), 275–283. https://doi.org/https://doi.org/10.1111/j.1365-2621.2010.02506.x
- Labuza, T. P., & Altunakar, B. (2007). Water activity prediction and moisture sorption isotherms. In G. V. Barbosa-Cánovas, A. J. Fontana, S. J. Schmidt, & T. P. Labuza (Eds.), Water activity in foods: Fundamental and applications (pp. 215–237). Blackwell Publishing.
- Manrique, G. D., & Lajolo, F. M. (2004). Cell-wall polysaccharide modifications during postharvest ripening of papaya fruit (Carica papaya). Postharvest Biology and Technology, 33(1), 11–26. https://doi.org/https://doi.org/10.1016/J.POSTHARVBIO.2004.01.007
- Martins, G. F., Fabi, J. P., Mercadante, A. Z., & De Rosso, V. V. (2016). The ripening influence of two papaya cultivars on carotenoid biosynthesis and radical scavenging capacity. Food Research International, 81, 197–202. https://doi.org/https://doi.org/10.1016/J.FOODRES.2015.11.027
- Moreira, R. G. (2012). Vacuum frying of fruits applications in fruit processing. In S. Rodrigues & F. A. N. Fernandes (Eds.), Advances in fruit processing technologies (pp. 331–344). CRC Press.
- Müller, L., Caris-Veyrat, C., Lowe, G., & Böhm, V. (2016). Lycopene and its antioxidant role in the prevention of cardiovascular diseases—A critical review. Critical Reviews in Food Science and Nutrition, 56(11), 1868–1879. https://doi.org/https://doi.org/10.1080/10408398.2013.801827
- Obón, J. M., Castellar, M. R., Alacid, M., & Fernández-López, J. A. (2009). Production of a red–purple food colorant from Opuntia stricta fruits by spray drying and its application in food model systems. Journal of Food Engineering, 90(4), 471–479. https://doi.org/https://doi.org/10.1016/j.jfoodeng.2008.07.013
- Pandey, A. K., & Chauhan, O. P. (2019). Process optimization for development of vacuum fried papaya (Carica papaya) chips using response surface methodology. Agricultural Research, 8(3), 364–373. https://doi.org/https://doi.org/10.1007/s40003-018-0375-x
- Pandey, A. K., Kumar, S., Ravi, N., Chauhan, O. P., & Patki, P. E. (2020). Use of partial drying and freezing pre-treatments for development of vacuum fried papaya (Carica papaya L.) chips. Journal of Food Science and Technology, 57(6), 2310–2320. https://doi.org/https://doi.org/10.1007/s13197-020-04269-w
- Pathare, P. B., Opara, U. L., & Al-Said, F. A. J. (2013). Colour measurement and analysis in fresh and processed foods: A review. Food and Bioprocess Technology, 6(1), 36–60. https://doi.org/https://doi.org/10.1007/s11947-012-0867-9
- Pénicaud, C., Achir, N., Dhuique-Mayer, C., Dornier, M., & Bohuon, P. (2011). Degradation of β-carotene during fruit and vegetable processing or storage: Reaction mechanisms and kinetic aspects: A review. Fruits, 66(6), 417–440. https://doi.org/https://doi.org/10.1051/fruits/2011058
- Perez‐Tinoco, M. R., Perez, A., Salgado‐Cervantes, M., Reynes, M., & Vaillant, F. (2008). Effect of vacuum frying on main physicochemical and nutritional quality parameters of pineapple chips. Journal of the Science of Food and Agriculture, 88(6), 945–953. https://doi.org/https://doi.org/10.1002/jsfa.3171
- Rao, A. V., & Agarwal, S. (2000). Role of antioxidant lycopene in cancer and heart disease. Journal of the American College of Nutrition, 19(5), 563–569. https://doi.org/https://doi.org/10.1080/07315724.2000.10718953
- Sancho, L. E. G. G., Yahia, E. M., & González-Aguilar, G. A. (2011). Identification and quantification of phenols, carotenoids, and vitamin C from papaya (Carica papaya L., cv. Maradol) fruit determined by HPLC-DAD-MS/MS-ESI. Food Research International, 44(5), 1284–1291. https://doi.org/https://doi.org/10.1016/j.foodres.2010.12.001
- Saran, P. L., Solanki, I. S., & Choudhary, R. (2016). Papaya: Biology, cultivation, production and uses. CRC Press.
- Schweiggert, R. M., Steingass, C. B., Esquivel, P., & Carle, R. (2012). Chemical and morphological characterization of Costa Rican papaya (Carica papaya L.) hybrids and lines with particular focus on their genuine carotenoid profiles. Journal of Agricultural and Food Chemistry, 60(10), 2577–2585. https://doi.org/https://doi.org/10.1021/jf2045069
- Schweiggert, R. M., Steingass, C. B., Mora, E., Esquivel, P., & Carle, R. (2011). Carotenogenesis and physico-chemical characteristics during maturation of red fleshed papaya fruit (Carica papaya L.). Food Research International, 44(5), 1373–1380. https://doi.org/https://doi.org/10.1016/j.foodres.2011.01.029
- Soto, M., Dhuique-Mayer, C., Servent, A., Jiménez, N., Vaillant, F., & Achir, N. (2020). A kinetic study of carotenoid degradation during storage of papaya chips obtained by vacuum frying with saturated and unsaturated oils. Food Research International, 128, 108737. https://doi.org/https://doi.org/10.1016/j.foodres.2019.108737
- United States Department of Agriculture Agricultural Research Service (USDA). (2020). USDA food composition databases. https://fdc.nal.usda.gov/
- Villanueva, N. D., Petenate, A. J., & Da Silva, M. A. (2005). Performance of the hybrid hedonic scale as compared to the traditional hedonic, self-adjusting and ranking scales. Food Quality and Preference, 16(8), 691–703. https://doi.org/https://doi.org/10.1016/j.foodqual.2005.03.013
- Welti-Chanes, J., Pérez, E., Guerrero-Beltrán, J. A., Alzamora, S. M., & Vergara-Balderas, F. (2007). Applications of water activity management in the food industry. In G. V. Barbosa-Cánovas, A. J. Fontana, S. J. Schmidt, & T. P. Labuza (Eds.), Water activity in foods: Fundamental and applications (pp. 341–357). Blackwell Publishing.
- Wexler, L., Perez, A. M., Cubero-Castillo, E., & Vaillant, F. (2016). Use of response surface methodology to compare vacuum and atmospheric deep-fat frying of papaya chips impregnated with blackberry juice. CyTA-Journal of Food, 14(4), 578–586. https://doi.org/https://doi.org/10.1080/19476337.2016.1180324
- Willcox, J. K., Catignani, G. L., & Lazarus, S. (2003). Tomatoes and cardiovascular health. Critical Reviews in Food Science and Nutrition, 43(1), 1–18. https://doi.org/https://doi.org/10.1080/10408690390826437