
 ?Mathematical formulae have been encoded as MathML and are displayed in this HTML version using MathJax in order to improve their display. Uncheck the box to turn MathJax off. This feature requires Javascript. Click on a formula to zoom.
ABSTRACT
The use of non-dairy matrices for probiotic delivery can be beneficial for vegetarian, vegan and lactose intolerant consumers. Stevia rebaudiana extract can be used as sweetener to replace sucrose for glucose intolerants. This research evaluated the use of kefir grains to prepare a low-calorie, fruit-based kefir beverage. Fermentation was carried out by inoculating kefir grains into a mixture of mango and umbu pulps. Two beverages, one containing sucrose, and the other, stevia, were characterized according to their proximate composition and submitted to a 30-day shelf-life period at 5°C, evaluating lactic acid bacteria, yeasts, pH, acidity, color parameters, soluble solids, ascorbic acid, sensory acceptance, and purchase intention every 10 days. Lactic and acetic acids were analyzed at the beginning and end of the shelf-life. Both beverages showed probiotic potential. The stevia-sweetened beverage had lower calorie content and good sensory acceptance. These results support the possibility to develop low-calorie, fruit-based kefir beverages.
RESUMEN
El uso de matrices no lácteas para la administración de probióticos puede ser beneficioso para consumidores vegetarianos, veganos e intolerantes a la lactosa. El extracto de Stevia rebaudiana puede utilizarse como edulcorante sustituto de la sacarosa en el caso de intolerantes a la glucosa. Esta investigación se propuso evaluar el uso de granos de kéfir para preparar una bebida de kéfir baja en calorías y a base de frutas. La fermentación se llevó a cabo inoculando granos de kéfir en una mezcla de pulpas de mango y umbú. Posteriormente, se caracterizaron dos bebidas, una con sacarosa y otra con stevia, según su composición proximal, sometiéndolas a un periodo de vida útil de 30 días a 5°C. Luego, se evaluaron cada 10 días las bacterias lácticas, las levaduras, el pH, la acidez, los parámetros de color, los sólidos solubles, el ácido ascórbico, la aceptación sensorial y la intención de compra. Asimismo, se analizó el contenido de ácidos láctico y acético al inicio y al final de la vida útil. Se constató que ambas bebidas mostraron potencial probiótico. La bebida endulzada con stevia posee menor contenido calórico y buena aceptación sensorial. En conclusión, estos resultados fundamentan la posibilidad de elaborar bebidas de kéfir bajas en calorías y a base de frutas.
1. Introduction
Kefir is a fermented, probiotic beverage from eastern Europe (Arslan, Citation2015). Kefir grains are an aggregation of yeasts, lactic acid and acetic acid bacteria that coexist in symbiosis and are enveloped by a matrix of polysaccharides (Alsayadi et al., Citation2014). The most common substrates utilized for kefir are water with brown sugar and cow’s milk. On the other hand, few studies have evaluated the viability of fermenting alternative substrates such as fruit juices for those that suffer from intolerance to dairy products (Laureys & De Vuyst, Citation2017). Umbu (Spondias tuberosa) and mango (Mangifera indica L.) are common fruits in the northeast region of Brazil, are rich in nutrients such as carotenoids and ascorbic acid, and are used to produce juices for their highly appreciated sensory characteristics (Jahurul et al., Citation2015; Teixeira et al., Citation2019). The use of such tropical fruits as fermentation substrates has the potential to insert new kefir beverages onto the food market.
The development of new beverages by combining prebiotic carbohydrates with probiotic microorganisms shows potential on the food market. Fructooligosaccharides (FOS) are considered as prebiotic carbohydrates for their potential to serve as substrates for gut microbiome and for the probiotic microorganisms present in food products, when used in combination (Freire et al., Citation2017). Elaborating a synbiotic beverage by combining FOS with kefir shows the promise to provide the food market with a product rich in beneficial effects.
The high consumption of sugar-sweetened beverages is a result of the abundant use of sucrose in the Brazilian diet and is associated with the risk of developing obesity. Studies have found that the use of artificially sweetened beverages could reduce weight and promote overall health (Borges et al., Citation2017) since artificial sweeteners usually have a zero-calorie content.
Stevia rebaudiana is a plant found in South America that contains glycosides, which has sweetening potential up to 300 times higher than that of sucrose and a zero-calorie content (Narayanan et al., Citation2014). Weber and Hekmat (Citation2013) evaluated the influence of stevia extract on the survival of lactobacillus in yogurt and found that the presence of the sweetener did not result in impairment of the probiotic potential of the beverage. On the other hand, Denina et al. (Citation2014) found that stevia had inhibitory potential in the multiplication of Lactobacillus reuteri, which leads to the need for further evaluation of the use of stevia in probiotic foods.
To ensure the probiotic effects of a product, a minimum value of viable cells is recommended, ranging from 106 to 107 CFU−1 at the expiry date (Shori, Citation2016), which can be a challenge when using a dairy-free food matrix. Therefore, the objective of the present work was to evaluate the viability of producing low-calorie, synbiotic mixed fruit flavored kefir beverages with umbu and mango.
2. Materials and methods
Pasteurized umbu and mango pulps were bought from Doce Mel (Brazil), Fructooligosaccharide was bought from New Nutrition (Brazil), sucrose (União, Brazil) was bought from the local market, water kefir grains were donated by the Federal University of Bahia Recôncavo (Brazil), stevia powder extract (96.50% total stevioside, 60% rebaudioside A) was donated by Sweetmix (Brazil), xantham gum and ascorbic acid were donated by Sigma-Aldrich (United States of America) and Granolab (Brazil), respectively.
2.1. Preparation of the kefir beverages
Each beverage formulation was prepared according to the fruit pulp proportions (). The frozen pasteurized fruit pulps were thawed and homogenized with the water volume defined for each beverage (). The substrates were packed in sterile glass vials, sealed with screw caps and refrigerated for further fermentation. Cultivation of the kefir grains was carried out according to Tavares et al. (Citation2018). During a seven-day period, the water kefir grains were activated at room temperature in a solution containing water and brown sugar at 12 °Bx. After this period, the grains were inoculated in a proportion equivalent to 10% of the volume of the beverages and allowed to ferment at 25°C in a biological oxygen demand (BOD) incubator (CE-300/350 model, Cienlab, Brazil) for a period of 24 hours. After the fermentation process, the water kefir grains were removed from the fermented beverages and the remaining ingredients (sucrose/stevia, xanthan gum, fructooligosaccharide and ascorbic acid) were added and homogenized. The xanthan gum was added to avoid phase separation, fructooligosaccharide was added to provide the beverages with synbiotic potential (Brazilian Health Regulatory Agency (Anvisa), Citation2019), and ascorbic acid was added as a preservative. Stevia was added considering its maximum daily ingestion of 4 mg/kg of body weight, as proposed by Food and Agriculture Organization of the United Nations (FAO) (Citation2019).
Table 1. Final formulations for the kefir beverages.
Tabla 1. Formulaciones finales de las bebidas de kéfir
2.2. Acceptance test
The sensory analysis of the kefir beverages was carried out by 65 untrained tasters, both male and female. The tasters were asked to indicate how much they liked or disliked each beverage on a hybrid 10 cm hedonic scale (Villanueva et al., Citation2005). The samples were served in clear, 50 mL tulip-shaped glasses. The two beverages with the highest acceptance scores were chosen to carry out the following analyses as shown below (one sample from each group).
2.3. Proximate composition
The two most accepted kefir samples were characterized for their moisture, ash, carbohydrate, protein, fat, and total calories contents, according to the techniques established by Association of Official Analytical Chemists (AOAC) (Citation2019). The moisture content was determined using an infrared moisture analyzer (IV3100 model, Gehaka, Brazil). For the ash content, the samples were incinerated and then weighed. The protein content was determined by the Kjeldahl method and the fat content was determined using the Bligh and Dyer (Citation1959) method. The carbohydrates were measured as the difference from 100% of the sum of the other macromolecules and the calories were calculated considering 4 kcal per 1 g of carbohydrates and proteins and 9 kcal per 1 g of fat.
2.4. Shelf-life analysis
The two most accepted kefir beverages were evaluated for their physicochemical, microbial, and sensory stability during a 30-day period. Each beverage was produced, packed in sterile glass vials and maintained under refrigeration at 5°C in a BOD incubator (CE-300/350 model, Cienlab, Brazil). Samples were taken every 10 days to carry out the following analyses: pH, titratable acidity, vitamin C, total soluble solids, color (AOAC, Citation2019), lactic acid bacteria count, yeast count (American Public Health Association [APHA], Citation2015), sensory acceptance and purchasing intent (Meilgaard et al., Citation2007).
The titratable acidity was determined by titration with 0.01 N NaOH solution (AOAC, Citation2019). The pH was determined by direct reading using a potentiometer (K39-1014B model, Kasvi, Brazil). The vitamin C content was determined by a redox titration using an iodine solution (AOAC, Citation2019). The total soluble solids were determined using an analogical refractometer (DR 201–95 model, Kruss, Germany). The color was analyzed using a benchtop colorimeter (CR 5 model, Konica Minolta, Japan) in the transmittance mode, obtaining values for L*, a* and b*. The total color difference () was also calculated, using the following equation:
For the Lactic Acid Bacteria (LAB) count, serial dilutions were prepared in saline solution, inoculated onto MRS agar plates (Kasvi, Brazil) supplemented with cycloheximide (100 mg/L), incubated for 72 hours at 30°C and the colony formation units (CFU) counted. For yeasts, serial dilutions were prepared, inoculated onto Saboraud Agar (Kasvi, Brazil) containing chloramphenicol (500 mg/L) and incubated for 120 hours at 30°C.
Lactic and acetic acids were identified and quantified by High Performance Liquid Cromatography (Series 200 model, Perkin Elmer, United Kingdom) using a 220 mm × 4,6 mm × 10 μm polypore H column (Perkin Elmer, United Kingdom), injection volume: 10 μL, Uv-Vis detector at 220 nm, flow: 0.8 mL/min and mobile phase: ultra-pure water acidified with H2SO4 to pH 2.0. The peaks corresponding to each acid were identified from the retention times according to the standards.
A sensory acceptance test was carried out every 10 days by the same tasters who took part in the preliminary analysis, again using a hybrid 10 cm hedonic scale (Villanueva et al., Citation2005), and also determining the purchasing intent of the products using a hedonic scale ranging from 1 (would definitely not buy the beverage) to 5 (would definitely buy the beverage). The sensory analysis was approved by the Ethic Committee of the Nutrition School – Federal University of Bahia (project number 1.759.169).
2.5. Statistical analysis
A one-way ANOVA was carried out to compare the means of the 12 samples in the preliminary acceptance test, and to compare the mean results for each beverage individually during the shelf-life. The student T test was used to compare the mean values obtained for the samples in the physicochemical characterization, and to compare the means obtained for the two beverages at the same shelf-life time. Pearson’s correlation test was also applied between all shelf-life analyses. The software STATISTICA 7.0 was used considering a 95% significance level.
3. Results and discussion
shows the mean acceptance scores awarded to each sample in the preliminary sensory analysis. The beverages with the lowest fruit pulp and sweetener concentrations showed the worst results. Samples 6 and 12 had the highest concentrations of fruit pulp and sweetener and the highest scores amongst the samples, both with scores above 6.50 points and were therefore chosen for the characterization and shelf-life analyses.
Figure 1. Mean Scores for each beverage in the Preliminary Sensory Acceptance Test. Error bars show standard deviations. Equal lower-case letters indicate that there was no significative difference between results at p ≤ 0.05.
Figura 1. Puntuaciones medias de cada bebida en la prueba de aceptación sensorial preliminar. Las barras de error representan las desviaciones estándar. Las letras minúsculas iguales indican que no hubo diferencias significativas entre los resultados a p ≤ 0.05
The beverages sweetened with stevia obtained lower scores when compared with the beverages sweetened with sugar. This finding suggests that the sweetening capacity of stevia may incur undesirable effects such as a slight bitter taste, that could lower the overall score of the beverage (Singla & Jaitak, Citation2016).
reports the results of the proximate composition for the two beverages with highest acceptance. The results for moisture and carbohydrate showed statistical differences between the two samples, probably due to the addition of sucrose to sample 6, which impacted on the total calorie count.
Table 2. Results from the proximate composition for the two samples with the best acceptance.
Tabla 2. Resultados de la composición proximal de las dos muestras que obtuvieron mejor aceptación
The low number of calories in sample 12 is of commercial interest since the demand for sweetened beverages and low-calorie products has been increasing on the international market. Studies have also shown that a high consumption of sucrose-sweetened beverages may be associated with an increased chance of acquiring type 2 diabetes mellitus and other chronic diseases (Singh et al., Citation2015). In addition, the evidence suggests a beneficial effect on the body mass index when sucrose-sweetened beverages are replaced by lower-calorie beverages, which may contribute to a reduction in the risk of developing chronic non-communicable diseases (Zheng et al., Citation2015).
The use of stevia shows the promise of contributing to a lower energy intake and the promotion of a balanced calorie consumption, while being a relatively safe sweetener considered as GRAS (Generally Recognized as Safe) (Borges et al., Citation2017). Both samples had low fat and protein contents, since fruits are usually not rich in these nutrients (O´Shea et al., Citation2015). Kefir fermentation is known to produce peptides, which have been associated with some beneficial effects in the organism, such as the inhibition of lipogenesis and modulation of oxidative damage (Tung et al., Citation2017). Regarding the ash content, the results found were similar to those described by Natal et al. (Citation2017), while working with mango juices.
shows the physicochemical behavior of the beverages during the 30-day shelf-life period. Regarding the pH and acidity, as expected, these parameters showed opposite behaviors during the period, with a strong negative correlation between them for both the sucrose sweetened kefir (−0.97, p < .05) and the stevia sweetened kefir (−0.81, p < .05). The microorganisms present in the kefir grains are responsible for the production of acetic and lactic acids. Tavares et al. (Citation2018) reported that the production of lactic acid during the fermentation of kefir is of great importance, due to its inhibitory effect on both spoilage and pathogenic microorganisms.
Figure 2. pH (a), Acidity (b), Total Soluble Solids (TSS) (c) and Ascorbic Acid (d) concentrations during the 30 days of shelf-life. Error bars show standard deviations. Same lower-case letters indicate no significative difference for the same sample at different shelf-life periods at p ≤ 0.05. Same capital letter indicates no significative difference for the different beverages for the same shelf-life period analyzed at p ≤ 0.05. ![]()
Figura 2. Concentraciones de pH (a), acidez (b), sólidos solubles totales (TSS) (c) y ácido ascórbico (d) durante los 30 días de vida útil. Las barras de error representan las desviaciones estándar. Las mismas letras minúsculas señalan que no hay diferencias significativas para la misma muestra en distintos periodos de vida útil a p ≤ 0.05. La misma letra mayúscula indica que no hay diferencias significativas para las distintas bebidas durante el mismo periodo de vida útil analizado a p ≤ 0.05. ![]()
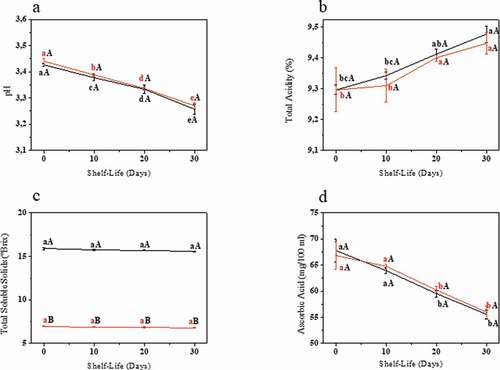
Regarding the total soluble solids (TSS), there was a significant difference between the samples, which can be explained by the fact that stevia is considered a non-caloric sweetener. On the other hand, no statistical difference was observed between different shelf-life periods for the same sample. Different results were identified by Khatoon and Gupta (Citation2015), who found a lower TSS count after 7 days of storage. A strong positive correlation with lactic-acid bacteria count (0.89, p < .05) was only observed for the stevia sweetened kefir which could be associated with the fact that the soluble solids serve as an important substrate for the survival of these microorganisms.
Regarding the ascorbic acid, Oliveira et al. (Citation2013) suggested that a loss of more than 50% of the initial content of ascorbic acid at the end of a product’s shelf-life is a determinant of low-quality storage. In the present work, the loss of ascorbic acid was lower for both beverages (23.63% for the sucrose sweetened beverage and 15.57% for the stevia sweetened beverage), which is a good predictor.
Negative correlations were observed between ascorbic acid, (−0.94 for both samples, p < .05) and total acidity (−0.92 for sucrose and −0.95 for stevia sweetened kefirs, p < .05). A positive correlation was found with pH (0.95 for sucrose and 0.90 for stevia sweetened kefirs, p < .05). These correlations are justified since ascorbic acid can degrade into browning compounds due to both aerobic and anaerobic reactions in aqueous acidic solutions (Oliveira et al., Citation2013).
shows the microbial counts during the 30-day shelf-life period and the lactic/acetic acid concentrations. Regarding the lactic acid bacteria count, for both samples, the T30 count was statistically lower than that at the other periods analyzed. The increased acidity level (correlation of −0.97 for the sucrose and −0.82 for the stevia sweetened beverages, p < .05) and the decrease in pH (correlation of 0.99 for both samples, p < .05) could justify the reducing levels of microorganisms. The counts for all the periods analyzed showed more than 7.00 log10CFU per recommended portion of the product (250 mL), and thus the products can be considered as potentially probiotic up to the end of the shelf-life period, according to Minelli and Benini (Citation2008). The main benefits associated with the consumption of the probiotic microorganisms in kefir are improved digestion, a hypocholesterolemic effect, glycemic control, an anti-hypertensive effect, anti-inflammatory effect, antioxidant activity, anti-carcinogenic activity and anti-allergenic effect (Rosa et al., Citation2017).
Figure 3. Yeast (a) and Lactic Acid Bacteria (b) count per mL and Lactic Acid Bacteria (c) count per 250 mL during the 30 days of shelf-life and lactic/acetic acid (d) concentrations (g/L) at the beginning and end of shelf-life period. Error bars show standard deviations. Same lower-case letters indicate no significative difference for the same sample at different shelf-life periods at p ≤ 0.05. Same capital letter indicates no significative difference for the different beverages for the same shelf-life period analyzed at p ≤ 0.05. For Figures a,b and c, ![]()
Figura 3. Recuento de levaduras (a) y bacterias del ácido láctico (b) por mL; recuento de bacterias del ácido láctico (c) por 250 mL durante los 30 días de vida útil y concentraciones de ácido láctico/acético (d) (g/L) al inicio y al final del periodo de vida útil. Las barras de error representan las desviaciones estándar. Las mismas letras minúsculas señalan que no hay diferencias significativas para la misma muestra en distintos periodos de vida útil a p ≤ 0.05. La misma letra mayúscula indica que no hay diferencias significativas para las distintas bebidas durante el mismo periodo de vida útil analizado a p ≤ 0.05. Para las figuras a, b y c, ![]()
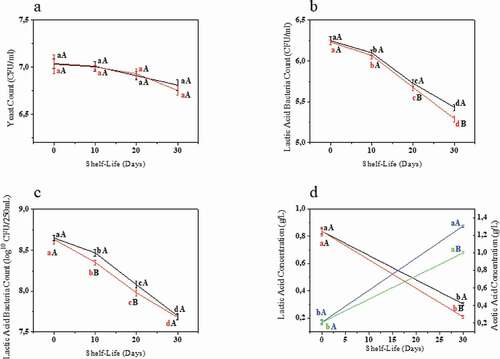
The period found for the shelf-life of the probiotics in the present work can be considered in accordance with data found in the literature, with results ranging from 7 (Nualkaekul et al., Citation2013) to 28 (Da Costa et al., Citation2017) or more days in similar studies. The use of stevia as a sweetener apparently did not affect the overall shelf-life period of the beverage studied, even though a statistical difference was observed for the LAB counts on the 20th and 30th days of analysis. Esmerino et al. (Citation2013) obtained similar results.
With respect to the behavior of the yeasts, the results obtained at the different times of analysis were similar to those obtained by other authors (Corona et al., Citation2016; Randazzo et al., Citation2016). The T30 yeast counts were also statistically lower than at the other times analyzed for both samples.
Saccharomyces cerevisiae is the most common yeast found in kefir beverages and has been associated with some beneficial effects, such as inhibition of the growth of Shigella sp. and the cytotoxicity of Clostridium difficile toxins (Bolla et al., Citation2013). Strong correlations were found with pH (0.91, p < .05) and acidity (−0.96, p < .05), but only for the sucrose-sweetened kefir, which could be due to the fact that other variables, such as the soluble solids content could have a more important correlation with the yeast count in the stevia sweetened kefir.
) shows the behavior of the lactic and acetic acids at the beginning and end of the shelf-life period. The lactic acid concentration was highest at the end of the fermentation period and decreased at the end of the shelf-life and similar results were found by Puerari et al. (Citation2012). Acetic acid showed the opposite behavior, with its concentration increasing at the end of the shelf-life for both samples. Lactic and acetic acids are responsible for the unique kefir flavor and they also protect the beverage from spoilage by microorganisms (Puerari et al., Citation2012; Viana et al., Citation2017). The modification in the concentration of these acids could be justified by the fact that some lactic acid bacteria are not only capable of producing lactic acid, but of using it as a substrate for fermentation, producing acetic acid (Elferink et al., Citation2001).
As expected, the LAB count had a strong positive correlation with the lactic acid concentration (0.99, p < .05), since they are its main producers (Magalhães et al., Citation2010), while the acetic acid concentration had strong correlations with the pH value (−0.99, p < .05) and total acidity (0.98, p < .05).
It must be pointed that the fruit juices were also evaluated before fermentation in relation to the pH, lactic acid bacteria and yeast counts. The medium value for pH was 3.81 ± 0.17 and there was no lactic acid bacteria nor yeast found. Immediately after the innoculation of the water kefir grains, the beverages, whilst not fermented, already showed microbial counts, with a 5.21 ± 0.07 log10CFU/mL of LAB and 5.79 ± 0.10 log10CFU/mL of yeast. These findings may indicate a very mild fermentation process, in comparison with results reported by Randazzo et al. (Citation2016).
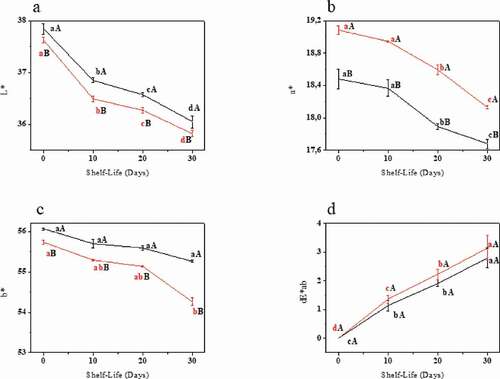
shows the results for the color parameters and total color difference for both samples during the shelf-life period. The sugar sweetened sample showed different overall color values than the stevia beverage, probably due to the different formulations, with the stevia beverage containing more water and no added sucrose. The samples presented a decrease in all the color parameters during the shelf-life period and the same result was observed by M.G.M. Costa et al. (Citation2013).
Figure 4. L* (a), a* (b), b* (c) and ΔE (d) analyses during the 30 days of shelf-life. Error bars show standard deviations. Same lower-case letters indicate no significative difference for the same sample at different shelf-life periods at p ≤ 0.05. Same capital letter indicates no significative difference for the different beverages for the same shelf-life period analyzed at p ≤ 0.05.![]()
Figura 4. Análisis de L* (a), a* (b), b* (c) y ΔE (d) durante los 30 días de vida útil. Las barras de error representan las desviaciones estándar. Las mismas letras minúsculas señalan que no hay diferencias significativas para la misma muestra en distintos periodos de vida útil a p ≤ 0.05. La misma letra mayúscula indica que no hay diferencias significativas para las distintas bebidas durante el mismo periodo de vida útil analizado a p ≤ 0.05. ![]()
shows the results obtained in the sensory analyses carried out during the shelf-life of the beverages. There was a statistical difference between the samples, with the sucrose beverage presenting greater acceptance and higher purchase intention scores, which suggests more familiarity with its taste as compared to stevia. Similar results were found by Alizadeh et al. (Citation2014).
Table 3. Results from the acceptance test and purchasing intention for the mixed fruit kefir beverages.
Tabla 3. Resultados de la prueba de aceptación e intención de compra de las bebidas de kéfir de frutas mixtas
The longer the shelf-life, the lower the score found for both beverages in both analyses. K.K.F.D. Costa et al. (Citation2017) obtained similar results studying a probiotic beverage, and some tasters described an acidic taste in both samples in the last shelf-life analysis.
The changes observed on the 10th day of the shelf-life in the instrumental color analyses did not appear to influence acceptance of the beverage, since a statistical difference was only observed for global acceptance on the last day of analysis and a noticeable difference in ΔE was already present on the 20th day. Dias et al. (Citation2012) discussed the fact that, although color is an important sensory characteristic, product flavor may have a greater impact on its acceptance.
The acidity and pH could be the parameters responsible for the decrease in beverage acceptance, since strong correlations between acceptance and acidity (−0.98 for sucrose and −0.85 for stevia, p < .05) and pH (0.99, p < .05 for both samples) could indicate that the tasters who took part in the sensory tests preferred less acidic beverages. Salmerón et al. (Citation2015) discuss that the production of acetic and lactic acids by the kefir microorganisms potentially affect both physicochemical parameters and the overall sensory characteristics of the beverages.
The stevia-sweetened kefir beverage showed global acceptance above 5.00 throughout the whole shelf-life and buying intention above 2.50 for the first three periods analyzed, which could show a willingness to accept stevia as a substitute for sucrose. Similar scores were found by Randazzo et al. (Citation2016) when testing different fruit juices as substrates for kefir fermentation. Pimentel et al. (Citation2015) also found similar values when working with probiotics sweetened with sucralose, however sucralose is derived from substances considered toxic, so the use of stevia may benefit from being a natural substance with less risk of toxicity (Tandel, Citation2011).
Functional foods are part of a new conception of food, since, in addition to their nutritional compositions, they beneficially affect one or more functions of the organism. Within this context, the relevance of the present study was to respond to an increasing demand for functional products on the food market (Markowiak & Slizewska, Citation2017). The interaction between the in vivo probiotic and prebiotic functions in a synergistic way is of interest, since prebiotics are known to increase the viability of some microbial strains (Pandey et al., Citation2015) and promote even greater beneficial effects, other than those intrinsic to them separately.
4. Conclusion
The beverages differed in their total calories, due to the non-caloric quality of the stevia extract, giving it commercial potential. Both beverages could be considered potentially probiotic due to their lactic acid bacteria and yeast count during the storage period and had good sensory acceptance. Although the instrumental color analyses showed significative differences, these differences were only perceived in the sensory evaluations after 20 days of storage. The results showed that both beverages functioned as viable matrices for kefir and could be implemented on the food market as new synbiotic products, with the stevia beverage having the advantage of its low caloric content and that it is a natural sweetener with low toxicity. The beverages could serve as promoters of a healthier diet and a balanced gut microbiome, especially to those suffering from dairy intolerance since they contain beneficial microorganisms and non-digestible carbohydrates functioning in a synergic way. The use of a fruit-based matrix can increment the daily consumption of vitamin-rich products and promote an adequate fruit ingestion.
Acknowledgments
The authors are grateful to the Graduate Program in Food Science of the Federal University of Bahia for its funding support, to the company Sweetmix for donating the powdered stevia extract, to the company Sigma-Aldrich for donating the xanthan gum, to the company Granolab for donating the ascorbic acid and to CAPES for providing a scholarship.
Disclosure statement
No potential conflict of interest was reported by the authors.
References
- Alizadeh, M., Azizi-Lalabadi, M., & Kheirouri, S. (2014). Impact of using stevia on physicochemical, sensory, rheology and glycemic index of soft ice cream. Food and Nutrition Sciences, 5(4), 390–396. https://doi.org/https://doi.org/10.4236/fns.2014.54047
- Alsayadi, M., Jawfi, Y., Belarbi, M., Soualem-Mami, Z., Merzouk, H., Sari, D., Sabri, F., & Ghalim, M. (2014). Evaluation of anti-hyperglycemic and anti-hyperlipidemic activities of water kefir as probiotic on streptozotocin-induced diabetic wistar rats. Journal of Diabetes Mellitus, 04(2), 85–95. https://doi.org/https://doi.org/10.4236/jdm.2014.42015
- American Public Health Association. (2015). Compendium of methods for the microbiological examination of foods (5th ed.). APHA Press.
- Arslan, S. (2015). A review: Chemical, microbiological and nutritional characteristics of kefir. CYTA: Journal of Food, 13(3), 340–345. https://doi.org/https://doi.org/10.1080/19476337.2014.981588
- Association of Official Analytical Chemists. (2019). Official methods of analysis of AOAC international (21st ed.). AOAC International.
- Bligh, E. G., & Dyer, W. J. (1959). A rapid method of total lipid extraction and purification. Canadian Journal of Biochemistry and Physiology, 37(8), 911–917. https://doi.org/https://doi.org/10.1139/o59-099
- Bolla, P. A., Carasi, P., Bolla, L., De Antoni, G. L., & Serradell, L. (2013). Protective effect of a mixture of kefir-isolated lactic acid bacteria and yeasts in a hamster model of Clostridium difficile infection. Anaerobe, 21, 28–33. https://doi.org/https://doi.org/10.1016/j.anaerobe.2013.03.010
- Borges, M. C., Louzada, M. L., De Sá, T. H., Laverty, A. A., Parran, D. C., Garzillo, J. M. F., Monteiro, C. A., & Millett, C. (2017). Artificially sweetened beverages and the response to the global obesity crisis. PLOS Medicine, 14(1), 1–9. https://doi.org/https://doi.org/10.1371/journal.pmed.1002195
- Brazilian Health Regulatory Agency (Anvisa). (2019). Alegações de propriedade funcional aprovadas. Retrieved April 29, 2021, from https://www.gov.br/agricultura/pt-br/assuntos/inspecao/produtos-vegetal/legislacao-1/biblioteca-de-normas-vinhos-e-bebidas/alegacoes-de-propriedade-funcional-aprovadas_anvisa.pdf
- Corona, O., Randazzo, W., Miceli, A., Guarcello, R., Francesca, N., Erten, H., Moschetti, G., & Settanni, L. (2016). Characterization of kefir-like beverages produced from vegetable juices. LWT - Food Science and Technology, 66, 572–581. https://doi.org/https://doi.org/10.1016/j.lwt.2015.11.014
- Costa, K. K. F. D., Júnior, M. S. S., Rosa, S. I. R., Caliari, M., & Pimentel, T. C. (2017). Changes of probiotic fermented drink obtained from soy and rice byproducts during cold storage. LWT - Food Science and Technology, 78, 23–30. https://doi.org/https://doi.org/10.1016/j.lwt.2016.12.017
- Costa, M. G. M., Fonteles, T. V., De Jesus, A. L. T., & Rodrigues, S. (2013). Sonicated pineapple juice as substrate for L. casei cultivation for probiotic beverage development: Process optimisation and product stability. Food Chemistry, 139(1–4), 261–266. https://doi.org/https://doi.org/10.1016/j.foodchem.2013.01.059
- Da Costa, G. M., Silva, J. V. C., Mingotti, J. D., Barão, C. E., Klososki, S. J., & Pimentel, T. C. (2017). Effect of ascorbic acid or oligofructose supplementation on L. paracasei viability, physicochemical characteristics and acceptance of probiotic orange juice. LWT - Food Science and Technology, 75, 195–201. https://doi.org/https://doi.org/10.1016/j.lwt.2016.08.051
- Denina, I., Semjonovs, P., Fomina, A., Treimane, R., & Linde, R. (2014). The influence of stevia glycosides on the growth of Lactobacillus reuteri strains. Letters in Applied Microbiology, 58(3), 278–284. https://doi.org/https://doi.org/10.1111/lam.12187
- Dias, N. A. A., Lara, S. B., Miranda, L. S., Pires, I. S. C., Pires, C. V., & Halboth, N. V. (2012). Influence of color on acceptance and identification of flavor of foods by adults. Food Science and Technology (Campinas), 32(2), 296–301. https://doi.org/https://doi.org/10.1590/S0101-20612012005000059
- Elferink, S. J. W. H., Krooneman, J., Gottschal, J. C., Spoelstra, S. F., Faber, F., & Driehuis, F. (2001). Anaerobic conversion of lactic acid to acetic acid and 1,2-propanediol by Lactobacillus buchneri. Physiology and Biotechnology, 67(1), 125–132. https://doi.org/https://doi.org/10.1128/AEM.67.1.125-132.2001
- Esmerino, E. A., Cruz, A. G., Pereira, E. P. R., Rodrigues, J. B., Faria, J. A. F., & Bolini, H. M. A. (2013). The influence of sweeteners in probiotic petit suisse cheese in concentrations equivalent to that of sucrose. Journal of Dairy Sciences, 96(9), 5512–5521. https://doi.org/https://doi.org/10.3168/jds.2013-6616
- Food and Agriculture Organization of the United Nations. (2019). Joint FAO/WHO expert committee on food additives. Retrieved February 8, 2020, from http://www.fao.org/3/ca5270en/ca5270en.pdf
- Freire, A. L., Ramos, C. L., & Schwan, R. F. (2017). Effect of symbiotic interaction between a fructooligosaccharide and probiotic on the kinetic fermentation and chemical profile of maize blended rice beverages. Food Research International, 100(Pt1), 698–707. https://doi.org/https://doi.org/10.1016/j.foodres.2017.07.070
- Jahurul, M. H. A., Zaidul, I. S. M., Ghafoor, K., Al-Juhaimi, F. Y., Nyam, K., Norulaini, N. A. N., Sahena, F., & Omar, A. K. M. (2015). Mango (Mangifera indica L.) by-products and their valuable components: A review. Food Chemistry, 183(15), 173–180. https://doi.org/https://doi.org/10.1016/j.foodchem.2015.03.046
- Khatoon, N., & Gupta, R. K. (2015). Probiotics beverages of sweet lime and sugarcane juices and its physiochemical, microbiological & shelflife studies. Journal of Pharmacognosy and Phytochemistry, 4(3), 25–34. https://www.phytojournal.com/archives/2015/vol4issue3/PartA/4-3-28.1.pdf
- Laureys, D., & De Vuyst, L. (2017). The water kefir grain inoculum determines the characteristics of the resulting water kefir fermentation process. Journal of Applied Microbiology, 122(3), 719–732. https://doi.org/https://doi.org/10.1111/jam.13370
- Magalhães, K. T., Pereira, G. V. M., Dias, D. R., & Schwan, R. F. (2010). Microbial communities and chemical changes during fermentation of sugary brazilian kefir. World Journal of Microbiology & Biotechnology, 26(7), 1241–1250. https://doi.org/https://doi.org/10.1007/s11274-009-0294-x
- Markowiak, P., & Slizewska, K. (2017). Effects of probiotics, prebiotics, and synbiotics on human health. Nutrients, 9(9), 1–30. https://doi.org/https://doi.org/10.3390/nu9091021
- Meilgaard, G. K., Civille, G. V., & Carr, B. I. (2007). Sensory evalution techniques (4th ed.). CRC Press.
- Minelli, E., & Benini, A. (2008). Relationship between number of bacteria and their probiotic effects. Microbial Ecology in Health and Disease, 20(4), 180–183. https://doi.org/https://doi.org/10.1080/08910600802408095
- Narayanan, P., Chinnasamy, B., Jin, L., & Clark, S. (2014). Use of just-about-right scales and penalty analysis to determine appropriate concentrations of stevia sweeteners for vanilla yogurt. Journal of Dairy Science, 97(6), 97. https://doi.org/https://doi.org/10.3168/jds.2013-7365
- Natal, D. I. G., Rodrigues, K. C. C., Moreira, M. E. C., Queiróz, J. H., Benjamin, L. A., Santos, M. H., Sant’Ana, H. M. P., & Martino, H. S. D. (2017). Bioactive compounds of the Ubá mango juices decrease inflammation and hepatic steatosis in obese Wistar rats. Journal of Funcional Foods, 32, 409–418. https://doi.org/https://doi.org/10.1016/j.jff.2017.03.023
- Nualkaekul, S., Cook, M. T., Khutoryanskiy, V. V., & Charalampopoulos, D. (2013). Influence of encapsulation and coating materials on the survival of Lactobacillus plantarum and Bifidobacterium longum in fruit juices. Food Research International, 53(1), 304–311. https://doi.org/https://doi.org/10.1016/j.foodres.2013.04.019
- O´Shea, N., Ktenioudaki, A., Smyth, T. P., Mcloughlin, P., Doran, L., Auty, M. A. E., & Gallagher, E. (2015). Physicochemical assessment of two fruit by-products as functional ingredients: Apple and orange pomace. Journal of Food Engineering, 153, 89–95. https://doi.org/https://doi.org/10.1016/j.jfoodeng.2014.12.014
- Oliveira, A. N., Ramos, A. M., Chaves, J. B. P., & Valente, M. E. R. (2013). Cinética de degradação e vida-de-prateleira de suco integral de manga. Ciência Rural, 43(1), 172–177. https://doi.org/https://doi.org/10.1590/S0103-84782012005000147
- Pandey, K. R., Naik, S. R., & Vakil, B. V. (2015). Probiotics, prebiotics and synbiotics- a review. Journal of Food Science and Technology, 52(12), 7577–7587. https://doi.org/https://doi.org/10.1007/s13197-015-1921-1
- Pimentel, T. C., Madrona, G. S., & Prudêncio, S. H. (2015). Probiotic clarified apple juice with oligofructose or sucralose as sugar substitutes: Sensory profile and acceptability. LWT - Food Science and Technology, 62(1), 838–846. https://doi.org/https://doi.org/10.1016/j.lwt.2014.08.001
- Puerari, C., Magalhães, K. T., & Schwan, R. F. (2012). New cocoa pulp-based kefir beverages: Microbiological, chemical composition and sensory analysis. Food Research International, 48(2), 634–640. https://doi.org/https://doi.org/10.1016/j.foodres.2012.06.005
- Randazzo, W., Corona, O., Guarcello, R., Francesca, N., Germana, M. A., Erten, H., Moschetti, G., & Settanni, L. (2016). Development of new non-dairy beverages from Mediterranean fruit juices fermented with water kefir microorganisms. Food Microbiology, 54, 40–51. https://doi.org/https://doi.org/10.1016/j.fm.2015.10.018
- Rosa, D. D., Dias, M. M. S., Grzeskowiak, L. M., Reis, S. A., Conceição, L. L., & Peluzio, M. C. G. (2017). Milk kefir: Nutritional, microbiological and health benefits. Nutrition Research Reviews, 30(1), 82–96. https://doi.org/https://doi.org/10.1017/S0954422416000275
- Salmerón, I., Thomas, K., & Pandiella, S. S. (2015). Effect of potentially probiotic lactic acid bacteria on the physicochemical composition and acceptance of fermented cereal beverages. Journal of Funcional Foods, 15, 106–115. https://doi.org/https://doi.org/10.1016/j.jff.2015.03.012
- Shori, A. B. (2016). Influence of food matrix on the viability of probiotic bacteria: A review based on dairy and non-dairy beverages. Food Bioscience, 13, 1–8. https://doi.org/https://doi.org/10.1016/j.fbio.2015.11.001
- Singh, G. G., Micha, R., Khatibzadeh, S., Lim, S., Ezzati, M., & Mozaffarian, D. (2015). Estimated global, regional, and national disease burdens related to sugar-sweetened beverage consumption in 2010. Circulation, 132(8), 639–666. https://doi.org/https://doi.org/10.1161/CIRCULATIONAHA.114.010636
- Singla, R., & Jaitak, V. (2016). Synthesis of rebaudioside A from stevioside and their interaction model with hTAS2R4 bitter taste receptor. Phytochemistry, 125, 106–111. https://doi.org/https://doi.org/10.1016/j.phytochem.2016.03.004
- Tandel, K. R. (2011). Sugar substitutes: Health controversy over perceived benefits. Journal of Pharmacology and Pharmacotherapeutics, 2(4), 236–243. https://doi.org/https://doi.org/10.4103/0976-500X.85936
- Tavares, P. P. L. G., Silva, M. R., Santos, L. F. P., Nunes, I. L., & Magalhães-Guedes, K. T. (2018). Produção de bebida fermentada kefir de quinoa (Chenopodium quinoa) saborizada com cacau (Theobroma cacao) em pó. Revista Brasileira de Ciências Agrárias, 13(4), 1–7. https://doi.org/https://doi.org/10.5039/agraria.v13i4a5593
- Teixeira, N., Melo, J. C. S., Batista, L. F., Paula-Souca, J., Fronza, P., & Brandão, M. G. L. (2019). Edible fruits from Brazilian biodiversity: A review on their sensorial characteristics versus bioactivity as tool to select research. Food Research International, 119, 325–348. https://doi.org/https://doi.org/10.1016/j.foodres.2019.01.058
- Tung, Y., Chen, H., Wu, H., Ho, M., Chong, K., & Chen, C. (2017). Kefir peptides prevent hyperlipidemia and obesity in high‐fat‐diet‐induced obese rats via lipid metabolism modulation. Molecular Nutrition and Food Research, 62(3), 1–9. https://doi.org/https://doi.org/10.1002/mnfr.201700505
- Viana, R. O., Magalhães-Guedes, K. T., Braga Junior, R. A., Dias, D. R., & Schwan, R. F. (2017). Fermentation process for production of apple-based kefir vinegar: Microbial, chemical and sensory analysis. Brazilian Journal of Microbiology, 48(3), 592–601. https://doi.org/https://doi.org/10.1016/j.bjm.2016.11.006
- Villanueva, N. D. M., Petenate, A. J., & Silva, M. A. A. P. (2005). Performance of the hybrid hedonic scale as compared to the traditional hedonic, self-adjusting and ranking scales. Food Quality and Preference, 16(8), 691–703. https://doi.org/https://doi.org/10.1016/j.foodqual.2005.03.013
- Weber, A., & Hekmat, S. (2013). The effect of Stevia rebaudiana on the growth and survival of Lactobacillus rhamnosus GR-1 and sensory properties of probiotic yogurt. Journal of Food Research, 2(2), 1–8. https://doi.org/https://doi.org/10.5539/jfr.v2n2p136
- Zheng, M., Allman-Farinelli, M., Heitmann, B. L., & Rangan, A. (2015). Substitution of sugar-sweetened beverages with other beverage alternatives: A review of long-term health outcomes. Journal of the Academy of Nutrition and Dietetics, 115(5), 767–779. https://doi.org/https://doi.org/10.1016/j.jand.2015.01.006