
ABSTRACT
This study investigated the proteomic difference between juice-producing and cooking EAHBs to clarify the role of protein in the production of banana juice. A comparative study was carried out to determine protein content, molecular weight distributions, and amino acid profile of the pulps of ten different (five juice-producing and five cooking) banana cultivars. There was low variability in crude protein content of banana cultivars, the level fell within the range of 0.80 g/100 g to 1.02 g/100 g. SDS-PAGE results visualised that the cultivars had similar molecular weights, ranging between 10 kDa and 76 kDa. The HPLC analysis showed that the relative compositions of amino acids differed significantly (p ≤ .05) within and between juice-producing and cooking cultivars. Both banana cultivars had a significantly higher amount of glutamic and aspartic acids, but significantly lower concentrations of tyrosine, methionine. The results suggest that protein content, molecular weight, and amino acid composition of banana cultivars are not the major factors in determining a banana’s ability to release juice.
RESUMEN
Este estudio investigó la diferencia proteómica entre los EAHB productores de jugo y los EAHB para cocinar, con el fin de esclarecer la función de la proteína en la producción de jugo de plátano. En este sentido, se llevó a cabo un estudio comparativo para determinar el contenido proteico, la distribución del peso molecular y el perfil de aminoácidos de las pulpas de 10 cultivares de plátano diferentes (cinco productores de jugo y cinco para cocinar). Dicho estudio permitió constatar la baja variabilidad del contenido de proteína bruta entre los distintos cultivares de plátano, toda vez que su nivel se situó en el rango de 0.80 g/100 g a 1.02 g/100 g. Los resultados de SDS-PAGE permitieron visualizar que los distintos tipos de cultivares poseen pesos moleculares similares, entre 10 kDa y 76 kDa. El análisis de HPLC dio cuenta de que las composiciones relativas de los aminoácidos difieren significativamente (p ≤ .05) dentro y entre los cultivares productores de jugo y para cocinar. Ambos tipos de cultivares de plátano poseen una cantidad significativamente mayor de ácidos glutámico y aspártico, pero concentraciones significativamente menores de tirosina y metionina. Por lo que, los resultados sugieren que el contenido de proteínas, el peso molecular y la composición de aminoácidos de los cultivares de plátano no son los principales factores que determinan la capacidad del plátano para liberar jugo.
1. Introduction
East African highland bananas (EAHBs) are common banana cultivars that are used as a staple food by more than 25 million people in East Africa. They are mostly utilised for cooking and juice production (Karamura et al., Citation1998). Bananas are highly perishable, which makes them susceptible to post-harvest deterioration, and significant amounts are discarded, leading to huge losses of valuable food resources (Pessu et al., Citation2011). The introduction of different post-harvest processing techniques, e.g. processing bananas into juice, is an important step towards more responsible food production.
In East Africa, banana juice extraction is conducted using a traditional technology that involves the use of wooden boat–like containers with grass, mainly Imperata cylindrica. The bananas are peeled, grasses are added and the mixture is kneaded for 15–25 min to squeeze the juice from the bananas (Kyamuhangire et al., Citation2002). This traditional technology has existed for centuries; however, the commercialisation of this banana juice technology is challenging due to occasional juice extraction failures (Kibazohi et al., Citation2017; Kyamuhangire et al., Citation2002; Kyamuhangire & Pehrson, Citation1999).
The mechanism of banana juice release has been linked with protein-tannin interactions (Kibazohi et al., Citation2017; Kyamuhangire et al., Citation2006). A recent study has shown that prolonged blending of juice-producing bananas can be used to facilitate protein-tannin interactions to obtain banana juice and without the addition of grass (Kibazohi et al., Citation2017). Interactions between protein and tannins involve hydrophobic effects (Ozdal et al., Citation2013), resulting in the formation of insoluble aggregates in an aqueous solution, and separation of the liquid part (Prigent, Citation2005; Prigent et al., Citation2009; Rawel & Rohn, Citation2010). It is likely that the same phenomenon is occurring during banana juice release, with the assumption that the dissociated complex forms the hydrophobic aggregates that facilitate juice release
(Kyamuhangire et al., Citation2006). A number of studies have been conducted to understand the mechanisms behind traditional banana juice production. Characterisation of tannins in juice-producing and cooking bananas has revealed that juice–producing bananas are more likely to produce banana juice, which has been suggested to be due to the high amount of tannins (Kyamuhangire et al., Citation2006). Further, Kibazohi et al. (Citation2017) reported that banana juice was able to be recovered from bananas with the condensed tannins above 0.68% (w/w) of a peeled banana. However, there is a lack of comprehensive proteomic data with regard to different EAHBs.
In this study protein content, molecular weight, and amino acid composition of different EAH banana cultivars were analysed in an attempt to clarify the role of protein during mechanical juice extraction.
2. Materials and methods
2.1. Banana samples
Bananas (KM 5, Mtwishe, Nshanshambile, Pisang awak, Kisukari ndogo, Kisukari ng’ombe, ng’ombe, Njoge, Nyengele, Toke Uganda or Nshakala from Kilimanjaro (KL), Nshakala from Kagera (KG), Malindi, Ndeshi Laini, FIA 23) at green matured state conditions were collected from local farms in the Kagera and Kilimanjaro regions, Tanzania. After ripening the banana samples for 5 days in the laboratory at 28–32°C and 95–100% relative humidity, the bananas were peeled, sliced (5 mm), and stored at −80°C until analysis.
2.2. Reagents and chemicals
All reagents were of analytical grade, sodium potassium tartrate, sodium carbonate, copper sulfate, sodium hydroxide, Folin-Ciocalteau reagent (FCR), bovine serum albumin, and methanol (MeOH) were purchased from Sigma-Aldrich (St. Louis, MO, USA). Acetic acid was purchased from Fisher Scientific UK Ltd, 10X Sodium dodecyl sulfate (SDS)-Buffer, Coomassie brilliant blue G-250, mini-Protean TGX Gels, MW standard Markers (10–250 kDa) (Bio-Rad Laboratories, Inc, USA). A standard mixture of L‐amino acids (aspartic acid, glutamic acid, hydroxyproline, serine, glycine, histidine, arginine, threonine, alanine, proline, tyrosine, valine, methionine, isoleucine, leucine, phenylalanine, and lysine) was from Sigma-Aldrich (St. Louis, MO, USA), derivatising reagent phenyl isothiocyanate (PITC), triethylamine (TEA), hydrochloric acid (37%), sodium acetate, sodium phosphate, acetic acid and acetonitrile (HPLC grade), microsyringe filters (0.22 µm) were obtained from Sigma-Aldrich (St. Louis, MO, USA).
2.3. Preparation of samples
2.3.1. Protein extraction
The extraction of protein from the banana pulp was conducted following Wang et al. (Citation2006). Homogenised freeze-dried sample (0.5 g) was weighed into a 2 mL test tube and suspended in (1.5 mL) 10% trichloroacetic acid (TCA)-acetone, mixed, vortexed, centrifuged at 5311 g force (Multifuge I.S.R Heraeus, Kandro laboratory products, Germany) for 3 min at 4°C. The supernatant was removed and obtained residue was treated with 80% methanol in 0.1 M ammonium acetate (1.5 mL). Centrifugation was repeated as for the previous step and the supernatant was discarded. In the next step, 1 mL of 80% acetone was added to the tube to wash the sample, and the same procedures as described above were applied, and the final supernatant was discarded. The pellets were allowed to air-dry at room temperature for 10 min, 1 mL of Phenol: SDS (1:1) was added, mixed, incubated for 5 min, and centrifuged. The upper phenol layer was put in another 2 mL test tube and methanol containing 0.1 M ammonium acetate was added to the test tube, stored at 20°C for 10 min, and thereafter centrifuged for 5 min at 4°C. The supernatant was discarded after centrifugation and the protein pellets were collected and stored at −20°C until analysis.
2.3.2. Extraction of amino acids and derivatisation
Approximately 0.5 g of lyophilized sample was weighed into hydrolysis tubes in triplicate, 5 mL of 6 M hydrochloric acid (HCl) was added, and the tubes were flushed with N2, quickly cupped, and placed in an oven at 110°C for 24 h. Following hydrolysis, the tubes were opened and flushed again with nitrogen gas under vacuum to remove HCl. The dry residues were dissolved in buffer (MEOH-H2O-TEA, 2:2:1 [v/v]) and excess solvents were removed under vacuum at 65°C. Next, 30 μL of the derivatising reagent (MeOH-H2O-TEA-PITC, 7:1:1:1 [v/v]) was added, and removed under vacuum conditions at 65°C. After derivatisation, the tubes were sealed and stored at 4°C until analysis. Prior to HPLC injection, 150 µL of 5 mM sodium phosphate buffer with 5% acetonitrile was added to each tube to dilute the derivatised samples. The amino acid standard H solution was derivatised by the addition of 10 µL of standard H (amino acid hydrolysate standard) to 30 µL of PITC reagent, and the mixture was processed in the same way as the sample. The sample extracts and standards were filtered through 0.22 µm syringe filters (Sigma-Aldrich, USA) before HPLC analysis.
2.4. Analysis
2.4.1. Crude protein determination
The protein contents of the banana cultivars were determined by the Lowry method (Waterborg, Citation2009). The following reagents were used for the analysis: reagent A, 2% sodium carbonate in 0.1 N sodium hydroxide, reagent B, 0.5% copper sulfate solution in 1% sodium potassium, and reagent C, a mixture of reagent A and B in the ratio 5:1 (v/v). A 0.1 mL aliquot of each sample extract was put in a 2 mL test tube. To a 0.1 mL sample, 4 mL of reagent C was added, before incubation for 10 min at room temperature. Subsequently, 0.5 mL of Folin-Ciocalteu reagent (FCR) was added to each test tube, mixed, and allowed to stand in darkness for 30 minutes. The absorbance of the resulting solution was read at 660 nm using a UV-spectrophotometer (Safire II plate reader Tecan, Austria). A standard curve made from bovine serum albumin at the concentrations of 0.2, 0.4, 0.6, 0.8, and 1.0 mg/mL was used for quantification.
2.4.2. SDS-PAGE analysis
Protein separation by sodium dodecyl sulfate-polyacrylamide gel electrophoresis (SDS-PAGE) analysis was performed based on the method described by Zheng et al. (Citation2007). Protein samples were digested with Laemmli buffer (30 µL) and β-Mercaptoethanol (30 µL) and heated at 95°C for 5 min. Samples and standards (20 µL) were loaded on pre-casted gels (Bio-Rad Laboratories, Inc, USA) and run at 100 V for 2 h. The SDS-PAGE run was stopped when the bands reached the end of the gel, A staining solution (0.025% Coomassie brilliant blue R-250, 45% methanol, 10% acetic acid) was added and remained for 1 h while shaking. Lastly, the staining solution was removed and a destaining solution (40% methanol, 10% acetic acid) was added to remove excess dye and obtain clear protein bands. Molecular mass was determined by comparison with broad range molecular weight (10–250 kDa) standard markers (Bio-Rad Laboratories, Inc).
2.4.3. HPLC analysis of amino acids
An HPLC system (1260 Affinity II Agilent, Germany) was used to quantify amino acids (AAs) according to the method by González-Castro et al. (Citation1997). Amino acids do not have chromophores for UV detection, thus pre-column derivatisation with PITC was employed to obtain PITC derivatives. Subsequently, the phenylthiocarbamide (PTC) amino acids were auto-injected, and the separation of the derivatised amino acids was achieved using a Poroshell C8 column (5 µm, 150 × 4.6 mm, Agilent, Germany) at 25°C, and wavelength 254 nm. Mobile phase A was aqueous sodium acetate buffer (0.14 M) with 0.5 ml/L of TEA, mobile phase B consisted of acetonitrile–water (60:40). For the separation a flow rate of 1.0 mL/min with a gradient elution employed at the following order (0–12) min 10% B, (12–20) min 30% B, (20–22) min 48% B, (22–24) min 100% B, (24-30) min 10% B, was used. The amino acid stock solution mixture was prepared in (0.1) M hydrochloric acids and contained 0.25 mg L−1 of each amino acid. Quantification of individual AAs was performed by using an external standard calibration curve drawn by linear regression analysis.
2.5. Statistical analysis
All experiments were carried out in triplicate and the results were expressed as mean values with a standard deviation (± SD). Significant differences in the amino acid composition of different cultivars were verified by one-way analysis of variance (ANOVA). Tukey’s multiple comparisons were used to compare means of statistically significant difference between samples at a 95% confidence level using IBM® SPSS® statistics ver.24 software.
3. Results and discussion
3.1. Crude protein
The results from the determination of crude protein in the banana cultivars are shown in . The protein content varied slightly between juice-producing banana and cooking banana cultivars, ranging between 0.80 and 0.97 g/100 g FW, but without significant (p ≥ .05) difference. These results are in close agreement with previous results (John & Marchal, Citation1995; Zanariah & Noor Rehan, Citation1987), of the protein content of 1.09 g/100 g FW for Musa acuminata ssp and 0.8 g/100 g FW for Pisang awak, respectively. However, our results were much lower than the protein content (2.2 g/100 g DW) found in Cameroon banana pulp (Adisa & Okey, Citation1987). Furthermore, the protein content of the different parts of the banana pulp has previously been studied. Forster et al. (Citation2003) observed no significant difference in protein content in samples taken from the external, medium, and centre positions of the pulp (0.95, 0.95, and 1.27 g/100 g DW), respectively. In support of the above findings, a slight variation in protein content between cultivars might be attributed to the genetic variation and different agro-ecological conditions (Akaninwor & Sodge, Citation2005; Lustre et al., Citation1976; Pareek, Citation2016). It is also suggested that the variation in protein content across the cultivars might be explained by the difference in solubility of proteins in the extraction solvents (Chan & Phillips, Citation1994).
Table 1. Total protein content (g/100 g FW) of juice-producing and cooking banana cultivars.
Tabla 1. Contenido de proteína total (g/100 g FW) de cultivares de plátano productores de jugo y de cocción
3.2. Protein molecular weight distributions
The ten fractions of proteins from banana pulp cultivars were separated by SDS-PAGE. The patterns of banana proteins obtained were highly similar for all cultivars (), indicating the presence of the same types of proteins in the juice-producing and cooking cultivars. These results showed that the protein aggregates from both juice-producing and cooking cultivars were primarily composed of monomer subunits at 13, 17, 23, 33, 42, 53, and 76 kDa respectively. Thus, the protein molecular weight distributions in juice-producing and cooking banana cultivars were similar. Consequently, molecular weight distribution cannot be used as a marker to distinguish between the two banana cultivars and their potential ability to release banana juice. Identification of these banana proteins has been reported by other researchers, chitin-binding proteins monomers at 30 kDa, 32 kDa, and 33 kDa were isolated from banana fruits respectively (Ho & Ng, Citation2007; Mikkola et al., Citation1998). Moreover, the monomer at 22 kDa was identified as a thaumatin-like protein in the banana of Musa acuminata (Nikolic et al., Citation2014; Toledo et al., Citation2012). These proteins are produced as the response to biotic and abiotic stresses in plants (Ishige et al., Citation1993; De Jesús-pires et al., Citation2020; Mathivanan et al., Citation1998; Mehta et al., Citation1991). Furthermore, the band identified at 42 kDa was similar to the results reported by Yang et al. (Citation2000), who found a similar protein in the banana pulp of Musa sapientum L. (Musaceae).
Figure 1. SDS-PAGE pattern of pulp proteins of 10 banana cultivars. Protein samples were loaded as follows: 1 = KM 5, 2 = Mtwishe, 3 = Nshanshambile, 4 = Pisang awak, 5 = Nyengele, 6 = Toke Uganda (Nshakala KL), 7 = Nshakala KG, 8 = Malindi, 9 = Ndeshi Laini, 10 = FIA 23.
Figura 1. Patrón de SDS-PAGE de las proteínas de la pulpa de 10 cultivares de plátano. Las muestras de proteínas se cargaron de la siguiente manera: 1 = KM 5, 2 = Mtwishe, 3 = Nshanshambile, 4 = Pisang awak, 5 = Nyengele, 6 = Toke Uganda (Nshakala KL), 7 = Nshakala KG, 8 = Malindi, 9 = Ndeshi Laini, 10 = FIA 23
3.3. Amino acid profile
3.3.1. Quantification of amino acids (HPLC)
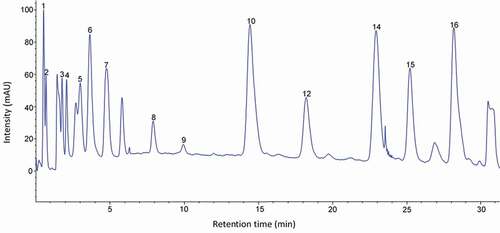
The binding affinity of protein to the phenolic compound is a function of amino acid composition (Rawel et al., Citation2005; Sęczyk et al., Citation2019). Moreover, protein-rich in proline amino acid has shown a high affinity to phenolic compounds (Luck et al., Citation1994). Previous studies suggest that a high affinity of salivary proline-rich proteins (PRPs) results in the formation of an insoluble complex and hence an astringency sensation when eating tannin-rich diets (Asquith et al., Citation1987; Makkar & Becker, Citation1998; Shimada, Citation2006). Considering the influence of PRPs on tannins, it was hypothesised that high proline content in a banana is the main characteristic of juice cultivars and it may be linked to their ability to release juice. In the present study, the amino acid concentrations of juice-producing and cooking cultivars were analysed and calculated using 17 commercial amino acid standards. To reveal cultivar-specific differences between different samples, the Tukey test (p ≤ .05) of all amino acids data was subsequently performed based on the mean values of all cultivars (). Chromatograms of the detected amino acids in the standard solution and samples are shown in , respectively. shows the amino acid composition in the analysed cultivars. In general, significant differences (p ≤ .05) in AAs were found among the banana cultivars, however, there were no specific AAs that were found in a juice-producing or cooking cultivar. Many of the observed AAs have been previously identified in plantains as well as other cooking bananas (Alsmairat et al., Citation2018; Emaga et al., Citation2007; Sharaf et al., Citation1979). Further, glutamic and aspartic acids were detected as the most prominent amino acids in the majority of the banana pulps. Similar values of glutamic and aspartic acids have been reported in other banana cultivars such as plantains; however, the values obtained in this study were higher than those reported in the literature (Emaga et al., Citation2007). Only minor amounts of tyrosine and methionine were detected in the banana cultivars in the current study (). Methionine and threonine were not detected in most of the cultivars and the remaining AAs such as hydroxyproline, isoleucine, serine, and arginine were found in small or trace amounts. Earlier reports suggest that the low contents of tyrosine and methionine are likely due to the degradation caused by oxidation of these AAs prior to HCL hydrolysis (Bergès et al., Citation2011). In addition, cooking cultivars had a higher content of the essential AAs
Table 2. Amino acid composition of banana pulp samples (mg/100 g DW).
Tabla 2. Composición de aminoácidos de las muestras de pulpa de plátano (mg/100 g peso seco)
Figure 2. HPLC chromatogram of the amino acid standard mixture. Peaks: 1, aspartic acid; 2, glutamic acid; 3, hydroxyproline; 4, serine; 5, glycine; 6, histidine; 7, arginine; 8, threonine; 9, alanine; 10, proline; 11, tyrosine; 12, valine; 13, methionine; 14, isoleucine; 15, leucine; 16, phenylalanine; 17, lysine.
Figura 2. Cromatograma de HPLC de la mezcla estándar de aminoácidos. Picos: 1, ácido aspártico; 2, ácido glutámico; 3, hidroxiprolina; 4, serina; 5, glicina; 6, histidina; 7, arginina; 8, treonina; 9, alanina; 10, prolina; 11, tirosina; 12, valina; 13, metionina; 14, isoleucina; 15, leucina; 16, fenilalanina; 17, lisina
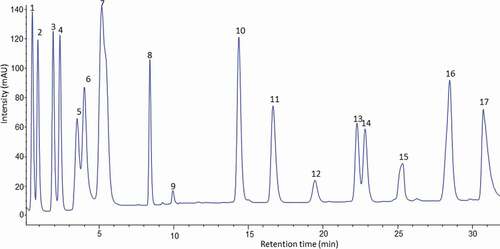
Figure 3. HPLC chromatogram of the amino acid profile of banana pulp of juice cultivar (Pisang awak) derivatised with (PITC) and UV-VIS detection at 254 nm.
Figura 3. Cromatograma HPLC del perfil de aminoácidos de la pulpa de plátano del cultivar de jugo (Pisang awak) derivado con (PITC) y detección UV-VIS a 254 nm
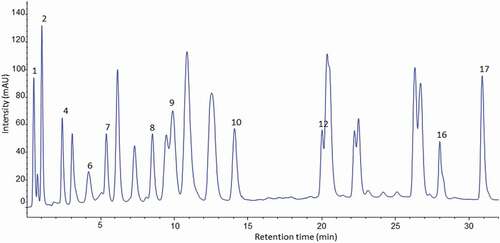
Figure 4. HPLC chromatogram of amino acid profile of banana pulp of cooking cultivar (Nshakala) derivatised with (PITC) and UV-VIS detection at 254 nm.
Figura 4. Cromatograma HPLC del perfil de aminoácidos de la pulpa de plátano del cultivar de cocción (Nshakala) derivado con (PITC) y detección UV-VIS a 254 nm
valine and lysine than juice cultivars (). The content of valine in cooking cultivars was more than double the content of valine in juice banana cultivars, the highest content was found in the Nshakala KG (101.5 ± 0.19 mg/100 g DW), Malindi (99.1 ± 2.10 mg/100 g DW), and Nshakala KL (81.2 ± 0.56 mg/100 g DW) cultivars. These results are in close agreement with those previously reported by Sheng et al. (Citation2010). The variation in valine content across banana cultivars might be explained by the differential uptake or consumption of valine during the formation of volatile compounds in banana (Musa sp., AA group, Cavendish) pulp (Alsmairat et al., Citation2018).
Nshakala KG contained the highest amounts of alanine (119.3 ± 0.34 mg/100 g DW), glycine (122.2 ± 1.32 mg/100 g DW), and histidine (144.1 ± 2.31 mg/100 g DW). Furthermore, lysine was high in Malindi (128.0 ± 3.10 mg/100 g DW) and Nshanshambile (103.6 ± 2.41 mg/100 g DW). A significant amount of alanine, glycine, and histidine have been reported in banana of Musa Cavendish “Hindi” variety from Egypt (Sharaf et al., Citation1979), however, the values obtained in this study were lower than data found in the literature using the Nitrogen analyser technique. This difference was mostly explained by variation in genetic factors and analytical methods (Hall & Schönfeldt, Citation2013).
In considering the proline contents of cultivars, the values varied from 31.1 ± 0.71 mg/100 g DW to 72.6 ± 1.21 mg/100 g DW. The proline content is related to the affinity of protein to phenolic compounds (Hagerman, Citation2012). With respect to the two groups (Juice-producing and cooking cultivars), the values obtained in this study did not distinguish the two groups in terms of proline content since the values were significantly different (p ≥ .05) across all cultivars. Surprisingly, cooking cultivars showed both high and low proline levels. Ndeshi laini (cooking) banana cultivar had the highest proline content (72.6 ± 1.21 mg/100 g DW), and Malindi (cooking) cultivar had the lowest (31.1 ± 0.71 mg/100 g DW) (). The different AAs’ composition in the banana cultivars might be attributed to varietal differences, different environmental conditions, and biochemical changes during growth and ripening (Drawert et al., Citation1972; Florent et al., Citation2015; Joshi & Kumar, Citation1989).
3.3.2. Principle component Analysis (PCA)
Principal component analysis (PCA) was applied to determine the number of significant variables and to establish the correlation between the measured amino acids (aspartic acid, glutamic acid, hydroxyproline, serine, glycine, histidine, arginine, threonine, alanine, proline, tyrosine, valine, methionine, isoleucine, leucine, phenylalanine, and lysine) in the studied cultivars (). The results from the PCA revealed that the first principal component PC1 scored 42.6%, and the second principal component PC2 scored 15.1% of the total variation in
Figure 5. Principal component analysis (PCA) of amino acid compositions, in ten banana cultivars.Note: Toke Uganda = Nshakala KL.
Figura 5. Análisis de componentes principales (PCA) de las composiciones de aminoácidos de 10 cultivares de plátano.Nota: Toke Uganda = Nshakala KL
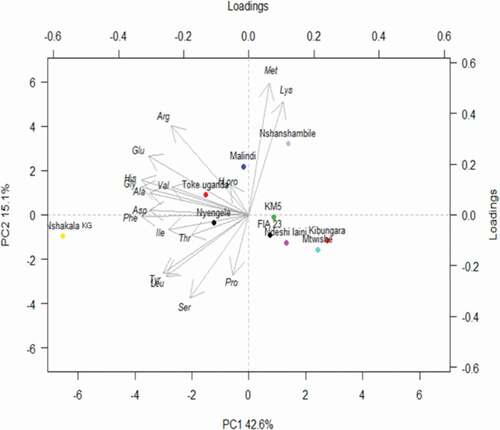
the data set. As shown in the PCA plot, the cultivars with the smallest distance between each other are considered to be more closely related to each other. Moreover, the two principal components grouped banana cultivars into four different clusters. The first cluster consisted of FIA 23, Ndeshi laini, Mtwishe, and Pisang awak cultivars, the second cluster of Nyengele and Nshakala KG, the third cluster of Toke Uganda (Nshakala KL) and Malindi, and the fourth cluster of Nshanshambile and KM5. The cultivars within the 1st and the 4th clusters are capable of producing juice, while cultivars within the 2nd and 3rd clusters are primarily used for cooking purposes.
4. Conclusion
The present study reveals that there was no significant difference (p ≥ .05) in protein content among the studied banana cultivars. Moreover, the electrophoretic patterns of all banana cultivars resembled each other with the MW range of 10–76 kDa. Furthermore, all cultivars showed the predominance of glutamic and aspartic acid. The varietal differences in the amino acid composition between the juice-producing and cooking cultivars did not follow a definite pattern, hence the AAs are not a key decisive factor in the banana juice release, though they may participate in the protein-tannin interaction. Further studies are however needed, to understand the mechanism of interactions between proteins and tannins in the banana pulp during mechanical juice extraction.
Supplemental Material
Download MS Word (206 KB)Acknowledgments
The authors are grateful for the financial support from the Swedish Government Cooperation Agency (SIDA).
Disclosure statement
No potential conflict of interest was reported by the author(s).
Supplementary material
Supplemental data for this article can be accessed on the publisher’s website.
Additional information
Funding
References
- Adisa, V. A., & Okey, E. N. (1987). Carbohydrate and protein composition of banana pulp and peel as influenced by ripening and mold contamination. Food Chemistry, 25(2), 85–91. https://doi.org/https://doi.org/10.1016/0308-8146(87)90057-4
- Akaninwor, J. O., & Sodge, M. (2005). The effect of storage on the nutrient composition of some nigerian foodstuffs: Banana and plantain. Journal of Applied Sciences and Environmental Management, 9(3), 9–11. https://doi.org/https://doi.org/10.4314/jasem.v9i3.17344
- Alsmairat, N., Engelgau, P., & Beaudry, R. (2018). Changes in free amino acid content in the flesh and peel of ‘Cavendish’ banana fruit as related to branched-chain ester production, ripening, and senescence. Journal of the American Society for Horticultural Science, 143(5), 370–380. https://doi.org/https://doi.org/10.21273/JASHS04476-18
- Asquith, T. N., Uhlig, J., Mehansho, H., Putman, L., Carlson, D. M., & Butler, L. (1987). Binding of condensed tannins to salivary proline-rich glycoproteins: The role of carbohydrate. Journal of Agricultural and Food Chemistry, 35(3), 331–334. https://doi.org/https://doi.org/10.1021/jf00075a012
- Bergès, J., Trouillas, P., & Houée-Levin, C. (2011). Oxidation of protein tyrosine or methionine residues: From the amino acid to the peptide. In Journal of Physics: Conference Series (Vol. 261, No. 1, p. 012003). IOP Publishing. https://doi.org/https://doi.org/10.1088/1742-6596/261/1/012003
- Chan, C. W., & Phillips, R. D. (1994). Amino acid composition and subunit constitution of protein fractions from cowpea (Vigna unguiculata L. Walp) seeds. Journal of Agricultural and Food Chemistry, 42(9), 1857–1860. https://doi.org/https://doi.org/10.1021/jf00045a005
- De Jesús-pires, C., Ferreira-Neto, J. R., Pacifico Bezerra-Neto, J., Kido, E. A., De Oliveira Silva, R. L., Pandolfi, V., Pereira-Andrade, G., Da Costa, A. F., Pio-Ribeiro, G., Pereira-Andrade, G., Sittolin, I. M., Freire-Filho, F., Benko-Iseppon, A. M., & Wanderley-Nogueira, A. C. (2020). Plant thaumatin-like proteins: Function, evolution and biotechnological applications. Current Protein and Peptide Science, 21(1), 36–51. https://doi.org/https://doi.org/10.2174/1389203720666190318164905
- Drawert, F., Emberger, R., Tressl, R., & Prenzel, U. (1972). Application of reaction radio-gas-chromatography to problems of flavour analysis. Chromatographia, 4(11), 319–323. https://doi.org/https://doi.org/10.1007/BF02310750
- Emaga, T. H., Andrianaivo, R. H., Wathelet, B., Tchango, J. T., & Paquot, M. (2007). Effects of the stage of maturation and varieties on the chemical composition of banana and plantain peels. Food Chemistry, 103(2), 590–600. https://doi.org/https://doi.org/10.1016/j.foodchem.2006.09.006
- Florent, A., Loh, A. M., & Thomas, H. (2015). Nutritive value of three varieties of banana and plantain blossoms from Cameroon. Journal of Agricultural Sciences, 5(2), 52–61. https://doi.org/https://doi.org/10.15580/GJAS.2015.2.012115009
- Forster, M., Rodríguez, E., Darias Martín, J., & Díaz Romero, C. (2003). Distribution of nutrients in edible banana pulp. Food Technology and Biotechnology, 41(2), 167–171. https://hrcak.srce.hr/115099
- González-Castro, M. J., López-Hernández, J., Simal-Lozano, J., & Oruña-Concha, M. J. (1997). Determination of amino acids in green beans by derivatization with phenylisothiocianate and high-performance liquid chromatography with ultraviolet detection. Journal of Chromatographic Science, 35(4), 181–185. https://doi.org/https://doi.org/10.1093/chromsci/35.4.181
- Hagerman, A. E. (2012). Fifty years of polyphenol-protein complexes. Recent Advances in Polyphenol Research, 3(1), 71–97. https://doi.org/https://doi.org/10.1002/9781118299753.ch3
- Hall, N. G., & Schönfeldt, H. C. (2013). Total nitrogen vs. amino-acid profile as indicator of protein content of beef. Food Chemistry, 140(3), 608–612. https://doi.org/https://doi.org/10.1016/j.foodchem.2012.08.046
- Ho, V. S., & Ng, T. B. (2007). Chitinase-like proteins with antifungal activity from emperor banana fruits. Protein and Peptide Letters, 14(8), 828–831. https://doi.org/https://doi.org/10.2174/092986607781483750
- Ishige, F., Mori, H., Yamazaki, K. I., & Imaseki, H. (1993). Cloning of a complementary DNA that encodes an acidic chitinase, which is induced by ethylene and expression of the corresponding gene. Plant and Cell Physiology, 34(1), 103–111. https://doi.org/https://doi.org/10.1093/oxfordjournals.pcp.a078383
- John, P., & Marchal, J. (1995). Ripening and biochemistry of the fruit. In F. Chippendale (Ed.), Bananas and plantains (pp. 434–467). Springer. https://doi.org/https://doi.org/10.1007/978-94-011-0737-2_15
- Joshi, A. J., & Kumar, A. S. (1989). Seasonal variations of proteins and amino acids in three salt marsh species. Proceedings: Plant Sciences, 99(3), 287–292. https://doi.org/https://doi.org/10.1007/BF03053604
- Karamura, E., Frison, E., Karamura, D. A., & Sharrock, S. (1998). Banana production systems in eastern and southern Africa. In C. Picq, E. Fouré, & E.A. Frison (Eds.), Bananas and food security (pp. 401–412). INIBAP.
- Kibazohi, O., Kyamuhangire, W., Kaunga, D. L., & Rokoni, C. (2017). Process improvement for mechanical extraction of low-viscosity clear banana juice. African Journal of Food Science, 11(8), 291–295. https://doi.org/https://doi.org/10.5897/AJFS2017.1604
- Kyamuhangire, W., Krekling, T., Reed, E., & Pehrson, R. (2006). The microstructure and tannin content of banana fruit and their likely influence on juice extraction. Journal of the Science of Food and Agriculture, 86(12), 1908–1915. https://doi.org/https://doi.org/10.1002/jsfa.2553
- Kyamuhangire, W., Myhre, H., Sørensen, H. T., & Pehrson, R. (2002). Yield, characteristics and composition of banana juice extracted by the enzymatic and mechanical methods. Journal of the Science of Food and Agriculture, 82(4), 478–482. https://doi.org/https://doi.org/10.1002/jsfa.1052
- Kyamuhangire, W., & Pehrson, R. (1999). Conditions in banana ripening using the rack and pit traditional methods and their effect on juice extraction. Journal of the Science of Food and Agriculture, 79(2), 347–352. https://doi.org/https://doi.org/10.1002/(SICI)10970010(199902)79:2<347::AID-JSFA206>3.0.CO;2-Q
- Luck, G., Liao, H., Murray, N. J., Grimmer, H. R., Warminski, E. E., Williamson, M. P., Lilley, T. H., & Haslam, E. (1994). Polyphenols, astringency and proline-rich proteins. Phytochemistry, 37(2), 357–371. https://doi.org/https://doi.org/10.1016/0031-9422(94)85061-5
- Lustre, A. O., Soriano, M. S., Morya, N. S., Balagot, A. H., & Tunac, M. M. (1976). Physico chemical changes in “SABA” bananas during normal and acetylene induced ripening. Food Chemistry, 1(2), 125–132. https://doi.org/https://doi.org/10.1016/0308-8146(76)90004-2
- Makkar, H. P. S., & Becker, K. (1998). Adaptation of cattle to tannins: Role of proline-rich proteins in oak-fed cattle. Animal Science, 67(2), 277–281. https://doi.org/https://doi.org/10.1017/S1357729800010031
- Mathivanan, N., Kabilan, V., & Murugesan, K. (1998). Purification, characterization, and antifungal activity of chitinase from Fusarium chlamydosporum, a mycoparasiteto groundnut rust, Puccinia arachidis. Canadian Journal of Microbiology, 44(7), 646–651. https://doi.org/https://doi.org/10.1139/w98-043
- Mehta, R. A., Parsons, B. L., Mehta, A. M., Nakhasi, H. L., & Mattoo, A. K. (1991). Differential protein metabolism and gene expression in tomato fruit during wounding stress. Plant and Cell Physiology, 32(7), 1057–1065. https://doi.org/https://doi.org/10.1093/oxfordjournals.pcp.a078169
- Mikkola, J. H., Alenius, H., Kalkkinen, N., Turjanmaa, K., Palosuo, T., & Reunala, T. (1998). Hevein-like protein domains as a possible cause for allergen cross-reactivity between latex and banana. Journal of Allergy and Clinical Immunology, 102(6), 1005–1012. https://doi.org/https://doi.org/10.1016/S0091-6749(98)70339-2
- Nikolic, J., Mrkic, I., Grozdanovic, M., Popovic, M., Petersen, A., Jappe, U., & Gavrovic-Jankulovic, M. (2014). Protocol for simultaneous isolation of three important banana allergens. Journal of Chromatography B, 962(1), 30–36. https://doi.org/https://doi.org/10.1016/j.jchromb.2014.05.020
- Ozdal, T., Capanoglu, E., & Altay, F. (2013). A review on protein–phenolic interactions and associated changes. Food Research International, 51(2), 954–970. https://doi.org/https://doi.org/10.1016/j.foodres.2013.02.009
- Pareek, S. (2016). Nutritional and biochemical composition of banana (Musa spp.) cultivars. In M. Simmonds & V. R. Preedy (Eds.), Nutritional composition of fruit cultivars (pp. 49–81). Academic Press.https://doi.org/https://doi.org/10.1016/B978-0-12-408117-8.00003-9
- Pessu, P. O., Agoda, S., Isong, I. U., & Ikotun, I. (2011). The concepts and problems of postharvest food losses in perishable crops. African Journal of Food Science, 5(11), 603–613. https://doi.org/https://doi.org/10.5897/AJFS.9000281
- Prigent, S. V. E. (2005). Interactions of phenolic compounds with globular proteins and their effects on food-related functional properties [Doctorial dissertation, Wageningen University]. Promotor(en): Fons Voragen; Harry Gruppen, co-promotor(en): G.A. van Koningsveld. https://library.wur.nl/WebQuery/wurpubs/fulltext/121696
- Prigent, S. V. E., Voragen, A. G. J., Van Koningsveld, G. A., Baron, A., Renard, C. M. G. C., & Gruppen, H. (2009). Interactions between globular proteins and procyanidins of different degrees of polymerization. Journal of Dairy Science, 92(12), 5843–5853. https://doi.org/https://doi.org/10.3168/jds.2009-2261
- Rawel, H. M., Meidtner, K., & Kroll, J. (2005). Binding of selected phenolic compounds to proteins. Journal of Agricultural and Food Chemistry, 53(10), 4228–4235. https://doi.org/https://doi.org/10.1021/jf0480290
- Rawel, H. M., & Rohn, S. (2010). Nature of hydroxycinnamate-protein interactions. Phytochemistry Reviews, 9(1), 93–109. https://doi.org/https://doi.org/10.1007/s11101-009-9154-4
- Sęczyk, Ł., Świeca, M., Kapusta, I., & Gawlik-Dziki, U. (2019). Protein–phenolic interactions as a factor affecting the physicochemical properties of white bean proteins. Molecules, 24(3), 408. https://doi.org/https://doi.org/10.3390/molecules24030408
- Sharaf, A., Hegazi, S. M., & Sedky, K. (1979). Chemical and biological studies on banana fruit. Zeitschrift für Ernährungswissenschaft, 18(1), 8–15. https://doi.org/https://doi.org/10.1007/BF02026531
- Sheng, Z. W., Ma, W. H., Jin, Z. Q., Bi, Y., Sun, Z. G., Dou, H. T., & Han, L. N. (2010). Investigation of dietary fiber, protein, vitamin E and other nutritional compounds of banana flower of two cultivars grown in China. African Journal of Biotechnology, 9(25), 3888–3895. https://doi.org/https://doi.org/10.5897/AJB2010.000-3262
- Shimada, T. (2006). Salivary proteins as a defense against dietary tannins. Journal of Chemical Ecology, 32(6), 1149–1163. https://doi.org/https://doi.org/10.1007/s10886-006-9077-0
- Toledo, T. T., Nogueira, S. B., Cordenunsi, B. R., Gozzo, F. C., Pilau, E. J., Lajolo, F. M., & Do Nascimento, J. R. O. (2012). Proteomic analysis of banana fruit reveals proteins that are differentially accumulated during ripening. Postharvest Biology and Technology, 70(1), 51–58. https://doi.org/https://doi.org/10.1016/j.postharvbio.2012.04.005
- Wang, W., Vignani, R., Scali, M., & Cresti, M. (2006). A universal and rapid protocol for protein extraction from recalcitrant plant tissues for proteomic analysis. Electrophoresis, 27(13), 2782–2786. https://doi.org/https://doi.org/10.1002/elps.200500722
- Waterborg, J. H. (2009). The Lowry method for protein quantitation. In M. J. Walker (Ed.), The protein protocols handbook (pp. 7–10). Humana Press. https://doi.org/https://doi.org/10.1385/0-89603-268-X:1
- Yang, C. P., Fujita, S., Ashrafuzzaman, M. D., Nakamura, N., & Hayashi, N. (2000). Purification and characterization of polyphenol oxidase from banana (Musa sapientum L.) pulp. Journal of Agricultural and Food Chemistry, 48(7), 2732–2735. https://doi.org/https://doi.org/10.1021/jf991037+
- Zanariah, J., & Noor Rehan, A. (1987). Protein and amino acid profiles of some Malaysian fruits. MARDI Research Bulletin (Malaysia), 15(1), 1–7.
- Zheng, C. Y., Ma, G., & Su, Z. (2007). Native PAGE eliminates the problem of PEG–SDS interaction in SDS‐PAGE and provides an alternative to HPLC in characterization of protein PEGylation. Electrophoresis, 28(16), 2801–2807. https://doi.org/https://doi.org/10.1002/elps.200600807