
ABSTRACT
The presence of probiotic microbes and other health promoting nutritional characteristics of kefir increasing the consumer’s interest. The microbial as well as volatile profile of kefir are the two chief factors that determine the basis of quality kefir drink. In this study, we characterized the three milk kefir drinks prepared by sheep, goat and cow milk on the bases of amplicon-based sequencing for microbial diversity and volatile profile along with physio-chemical and colorimetric features. The bacterial and mycobiota analysis showed that the bacteria Acetobacter syzygii, Lactobacillus lactic and Lactobacillus plantarum and yeasts Kluyveromyces marxianus, Saccharomyces cerevisiae, Peronospora manshurica, and Pichia fermentans were predominantly found in sheep kefir which exhibited optimum physio-chemical colorimetric profile and maintained volatile compounds that play important role regarding antimicrobial and pleasant sensory profile of milk kefir. It is concluded that sheep milk significantly supported the probiotic and health promoting features of kefir.
RESUMEN
La presencia de microbios probióticos en el kéfir, así como otras características nutricionales del mismo que favorecen la salud, aumenta el interés del consumidor. Los perfiles microbiano y volátil del kéfir son los dos factores principales para determinar la base de una bebida de kéfir de calidad. En el presente estudio caracterizamos tres bebidas de kéfir de leche preparadas con leche de oveja, de cabra y de vaca, sobre la base de una secuenciación sustentada en amplicones, a fin de determinar su diversidad microbiana, su perfil volátil y sus características fisicoquímicas y colorimétricas. El análisis bacteriano y de la micobiota permitió constatar que las bacterias Acetobacter syzygii, Lactobacillus lactic y Lactobacillus plantarum y las levaduras Kluyveromyces marxianus, Saccharomyces cerevisiae, Peronospora manshurica y Pichia fermentans se encuentran predominantemente en el kéfir de oveja. Este presentó un perfil colorimétrico fisicoquímico óptimo y mantuvo compuestos volátiles que desempeñan un papel importante en relación con el perfil antimicrobiano y el perfil sensorial agradable del kéfir de leche. Por ello se concluye que la leche de oveja contribuye significativamente a las características probióticas y de promoción de la salud del kéfir.
KEYWORDS:
PALABRAS CLAVE:
1. Introduction
Kefir, a beverage that is prepared by milk fermentation through kefir grains, is a probiotic food product. The kefir grains comprise yeast and bacteria that are protected by kefiran, an exopolysaccharide structure (Hamet et al., Citation2013). The microbial diversity in kefir is very important since it determines the biological activities as well as physicochemical features along with other sensory and nutritional characteristics of kefir (Altay et al., Citation2013; Gao et al., Citation2012; Kabak & Dobson, Citation2011). Kefir originated from mountains of Caucasus, widely used in China and now it comes under widely used nutritional drink throughout the world (Otles & Cagindi, Citation2003). Traditionally, milk kefir is made from cow, ewe, goat, or buffalo milk (Botelho et al., Citation2014). Milk kefir has many benefits to human health, including reducing tumors, lowering low-density lipoprotein cholesterol, reducing clinical signs because of lactose intolerance, immunity improvement, promoting skin healing and improving the intestinal microbiota (probiotic or prebiotic) (Güzel-Seydim, Kök-Taş, Greene, & Seydim, Citation2011; Rodrigues et al., Citation2005; Zheng et al., Citation2013).
The chemical composition, mineral and vitamin contents of milk obtained from different animals vary widely due to several important factors and because of the variations in chemical components of different milks, there would be differences in quality and health-related characteristics of products (Morand-Fehr et al., Citation2007). The proliferation of microorganism present in kefir grains and production of different secondary metabolites by these microorganisms are vary according to the type of milk that ultimately affects the kefir drink regarding its nutritional and human health characteristics (Güzel-Seydim, Kök-Taş, Greene, & Seydim, Citation2011; Khan et al., Citation2020). These facts explain the reason that why large number of scientific research has been conducted globally on kefir drinks and kefir grain (Prado et al., Citation2015). Different findings have been reported in which microbial diversities of kefir prepared by different methods and different types of kefir grains were evaluated. For example, Guzel et al. (Citation2005) and Dobson et al. (Citation2011) evaluated various kefir grains and the related kefir drinks for their microbiota composition. However, the detailed microbial characterization together with volatile components of kefir drinks prepared by different types of milk, i.e., goat, sheep and cow is not reported yet. In this study, the bacterial and fungal communities were evaluated in kefir drinks prepared by sheep, goat, and cow milk through ABS (amplicon-based sequencing) and viable counts on selective growth media. In addition, a full characterization of these kefir drinks was done for their volatile profile, colorimetric as well as physico-chemical features.
2. Materials and methods
2.1. Preparation of milk kefir
The kefir grains were obtained from private households and activated in the laboratory. Sterile ultra-heat treated (U.H.T.) sheep, goat and cow’s milk was used for their activation. Generally, 10% of kefir grains were added to each milk type and allowed to ferment for 24 h at 22°C. This was followed by filtering grains by a plastic sieve (sterilized) and gentle washing through sterile distilled water. To increase the grain biomass and keep the grain active this procedure was repeated three time. After this, the resultant three filtrates obtained were named as sheep, goat and cow’s kefir and used for further analysis.
2.2. Bacteria and yeasts count
For bacterial and yeast count, milk kefir was added into 0.1% sterile peptone solution at 10:90 ml. Serial dilutions from 10−1 to 10−8 were prepared. 0.1 ml of each dilution was spread on already prepared specific media plates in triplicates. De Man, Rogosa and Sharpe (MRS) agar and Germination medium (GM) agar were used for lactic acid bacteria (LAB) and acetic acid bacteria (AAB) respectively. For the inhibition of yeast growth, cycloheximide at 400 mg L−1 was also added to MRS and GM media. Yeast count was done on Rose Bengal Chloramphenicol Agar (RBCA) media. The incubation was done at 35°C for bacteria while 25°C for yeast under anaerobic conditions. Bacteria and yeasts were counted after 3 and 10 days, respectively. The results for microbial count were expressed in log cfu ml−1 sample.
2.3. Microbial diversity
Microbial diversity of each type of milk kefir was evaluated through amplicon-based sequencing. DNA isolation kit (PowerFoodTM Microbial) was used to isolate the DNA from milk kefir directly. Generally, a sample of 1.5 ml from each milk kefir was centrifuged for 3 min at 13.000 g in four repetitions. Following kit’s instructions, the resultant pellets were processed accordingly. After the DNA extracts were obtained, QUBIT dsDNA assay kit was used for their quantification and standardized to 20 ng μL−1. 2.5 μL of DNA extracts were used for the amplification of D1 domain and V3-V4 region of the 26S rRNA gene and 16S rRNA gene, respectively (Klindworth et al., Citation2013; J. Mota-Gutierrez et al., Citation2018). The targets regions were amplified through PCR. The components of PCR mixture, their concentrations and amplification conditions were presented in Table S1. After purification, the instructions of Illumina metagenomic pipeline were followed for amplicons sequencing. For sequencing, MiSeq Illumina instrument with V3 chemistry was used according to the manufacturer’s instructions which generated 250 bp paired-end reads. Following sequencing, FLASH software was used to merge the raw reads while QIIME software was used to analyze the resulting reads. The Greengenes 16S rRNA gene database version 2013 were used to assign taxonomic group. Biases because of different sequencing depths were avoided by rarefying data sets at the minimum read. The 16S and 26S data were rarefied at 7898 and 38,264 sequences respectively. For the confirmation of taxonomic assignments, the data were double-checked through BlastN.
2.4. Physio-chemical and colorimetric analysis
For determining total titratable acidity 1 ml of each milk kefir was added to 9 ml of distilled water (DW). After stirring, the titration was done by 0.1 N NaOH. The mean amount of NaOH used to attain pH of 8.3 was presented in results. The pH was calculated by pH meter (300), having HI2031 solid electrode. The assays were carried out in three repetitions. The milk kefirs were analyzed according to AOAC International (Citation2007) for dry matter (DM) (method no. 934.01), ash (method no. 942.05), and moisture, lactose (method no. 978.10). Crude protein was determined with the use of a Kjel-Foss Automatic 16210 analyzer (Foss Electric, Hillerød, Denmark; AOAC International, Citation2007; method no. 976.05), whereas crude fat was tested with a Soxtec System HT analyzer (Tecator AB, Hoganas, Sweden; method no. 973.18). Results were presented in percentage (w/w) after triplicate observations. The lactic acid content of milk kefirs was determined through Megazyme Assay Kit (K-DLATE 11/17). Instructions mentioned by manufacturer were followed for analysis. Analysis was done in triplicate. For colorimetric measurements Chroma Meter (CR-200) was used to measure the chromaticity coordinates (a: redness and b: yellowness) and lightness (L). A white standard plate with a D65 illuminant was used for performing the Chroma Meter set up. All the readings were done in three replicates per sample.
2.5. Analysis of volatile compounds
The analysis of the volatile fractions was done by headspace sampling through Solid Phase Micro-Extraction (SPME) with GC/MS. Immediately after placing 5 g of sample inside headspace vial, they were sealed with Teflon-lined septum. The headspace vials were placed on a stirrer for 5 min at 55°C. After this, the headspace samples were sampled by SPME fiber for 50 min at 55°C. The fiber was coated with polydimethylsiloxane/carboxen/divinylbenzene. Agilent Technologies 7890A GC coupled with mass spectrometer and equipped with a capillary column (0.25 μm) 30 m × 0.25 mm ID, was used for volatile compound analysis. The helium at 1.5 mL/min flow rate was used as gas carrier. The SPME injections were occurred for 20 min at 240°C. For oven parameters the first the temperature 40°C was run for 3 min than the temperature was increased at 5°C min−1 up to 240°C and run for 10 min. The scan mode with ionization potential 70 Ev and mass 33–300 amu was used for operating mass spectrometer. The sample mass spectra were compared with Wiley library (Wiley7, NIST 05) for volatile identification. The percentage peak area for individual compound acquired by integrating peak areas of all the compounds was used to show the amount of individual compound. The operating conditions already reported by Di Renzo et al. (Citation2018) were used. The analysis was done in triplicates.
2.6. Statistical analyses
For colorimetric parameters the data were analyzed by using IBMSPSS Statistix 20 software by applying CRD design. Results were presented as means and compared using Fisher’s Protected LSD test (P < .05). The significant differences were separated by lower case lettering. Same conditions were applied for LAB, AAB and yeast counts. The data for volatile compounds were analyzed by SYSTAT 13.0 software and results were presented as mean ± standard deviation. One-way ANOVA was used and LSD test (P < .05) was applied to evaluate the significant difference. In the vegan package, the diversity function was used to calculate the diversity index and sample coverage of microbial data (Dixon, Citation2003). Alpha diversity measures were calculated for bacterial and fungal microbiota of the kefirs.
3. Results and discussion
3.1. LAB, AAB, and yeast count
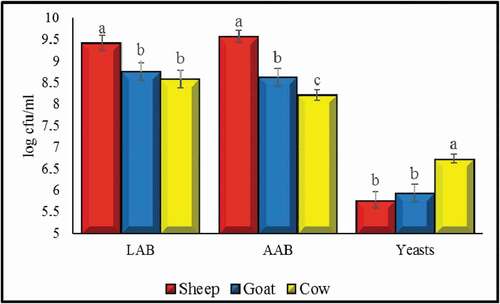
The significant (p < .05) differences were recorded for LAB, AAB, and yeast count in sheep, goat and cow kefir (). The sheep kefir showed significantly highest LAB, AAB (9.42 and 9.57 log cfu ml−1 respectively) and lowest yeast count (5.78 log cfu ml−1). There was no significant difference between goat and cow for LAB count (8.75 and 8.58 log cfu ml−1 respectively) and sheep and goat for yeast count (5.78 and 5.94 log cfu ml−1, respectively) although numerically higher LAB count in goat than cow and higher yeast count in goat than sheep was noticed. Generally, for yeast and LAB counts obtained in this study were in the range of those already observed in several studies. Literature showed that the LAB and yeast counts could be in the range of 4–9 and 5–8 log cfu ml−1 respectively (Arslan, Citation2015; Garofalo et al., Citation2015; Kök-Taş et al., Citation2012). Regarding AAB, these microbes are generally regarded as a minor species in the microbiota of kefir (Dobson et al., Citation2011; Guzel et al., Citation2011). However, in this study higher AAB counts were found than those mention in already reported literature. This contradiction can be explained by several facts. Firstly, it is worth noting that because of the limited AAB growth on synthetic media, AAB may usually be underestimated or not detected due to culture dependence tests, thus revealing the importance of using appropriate cultural medium and other identification tests (Garofalo et al., Citation2015). However, kefir having higher AAB is desirable as these bacteria play an important role in both quality characteristics and positive microbial interactions in kefir (Bourrie et al., Citation2016). Higher counts of acetic acid bacteria recorded here surly play an important role in kefir microbiota and therefore affecting the volatile compounds in the kefir as discusses below in volatile compound section.
Figure 1. LAB, AAB and yeast count in kefir prepared by sheep, goat and cow milk. Values are mean ± SD. Different lettering showing statistical difference.
Figura 1. Recuento de BAL, AAB y levaduras en el kéfir preparado con leche de oveja, de cabra y de vaca. Los valores son la media ± DE. Las distintas letras indican la diferencia estadística
3.2. Microbiota analysis
3.2.1. Bacterial analysis
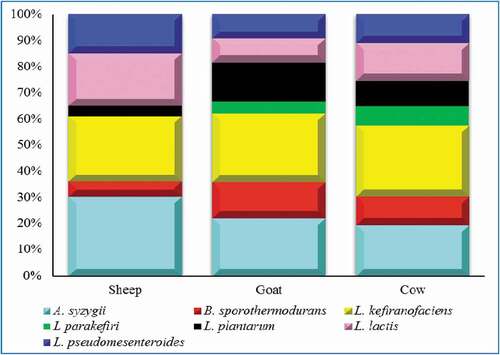
The three milk kefirs i.e. sheep, goat and cow milk kefir were analyzed for bacterial diversity by 16S rRNA gene sequencing. The sequencing generated total of 552,146 raw reads. The data were analyzed and after analysis, total of 471,365 reads passed through the Quantitative Insights Into Microbial Ecology (QIIME) filter. The mean sequence length and median reads sample−1 were 465 bp and 22241 ± 12.81, respectively. The Good’s coverage and rarefaction analysis are expressed as % median (98%), indicating that the coverage of all samples is satisfactory. It was found that the three milk kefirs were significantly different (P < .001) from each other on the basis of Analysis of Similarities (ANOSIM) and Adonis tests. The higher values for operational taxonomic units (OTUs) richness was shown by alpha diversity index in the sheep kefir if compared with the goat and cow. However, the goat and sheep exhibited similar operational taxonomic unit OTUs richness. Also in case of Chao-1 index and Shannon index the higher alpha diversity was noticed for sheep kefir followed by goat and cow (). Data regarding the incidence of the major taxonomic groups was presented in . Results showed a clear and uniform composition of microbiota. The microbial community was dominated by L. kefiranofaciens, Acetobacter syzygii, and Lactococcus lactis. The median values of RA for L. kefiranofaciens (25.7, 23.3, and 22.1%), A. syzygii (30.2, 19.4, and 16.7%) and L. lactis (20.6, 8.7, and 12.0%) were recorded, respectively, for sheep, goat and cow kefir (). Additionally, some more OTUs belonging to L. pseudomesenteroides, B. sporothermodurans, L. parakefiri, L. plantarum were also observed. Among Lactobacilli, L. kefiranofaciens generally dominate the microbiota in all kefir samples with no significant difference. L. kefiranofaciens mainly involved kefiran production and grain formation (Dertli & Çon, Citation2017). Kefiran is an exopolysaccharide having good rheological characteristics. Because of its various biological activities, it can be used as nutraceutical (Prado et al., Citation2015). Strong anti-inflammatory and antimicrobial activities of kefiran were reported recently (Bourrie et al., Citation2016). Interestingly, an important species A. syzygii characterized the three samples. It was more abundant in sheep kefir samples followed by cow and goat. This species was first discovered in Brazilian kefir and have the ability to bind mycotoxin in milk and decrease its absorption (Miguel et al., Citation2010; Taheur et al., Citation2017). The bacteria belong to Acetobacter play role in the production of vitamin B which is beneficial for the growth of other microbes (Bengoa et al., Citation2018). It was noticed that L. pseudomesenteroides and L. lactis were more common in sheep kefir goat and cow kefir samples. These species were already found in many studies related to kefir drinks (Bourrie et al., Citation2016; Gao & Zhang, Citation2019). L. lactis is an important specie having characteristic flavoring properties in fermented milk (Maoloni, Milanović, et al., Citation2020). Gao and Zhang (Citation2019) also concluded that combined growth of L. pseudomesenteroides and Lactococcus is responsible for the production of various desired flavoring and aromatic compounds. Anyhow, it was proved that sheep milk favors the growth of important bacterial species, i.e., L. kefiranofaciens, A. syzygii, L. lactis and L. pseudomesenteroides more than the goat and cow milk resulting in enhanced quality of sheep kefir drink.
Figure 2. Alpha diversity measures of bacterial diversity in kefir prepared by sheep, goat and cow milk.
Figura 2. Medidas de diversidad alfa de la diversidad bacteriana en el kéfir preparado con leche de oveja, de cabra y de vaca
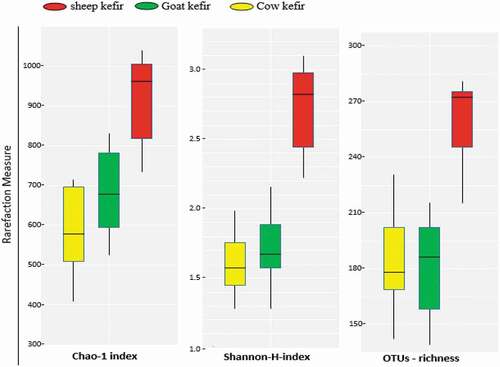
Figure 3. Major taxonomic group of bacterial microbiota and their incidence in kefir prepared by sheep, goat and cow milk.
Figura 3. Principales grupos taxonómicos de la microbiota bacteriana y su incidencia en el kéfir preparado con leche de oveja, de cabra y de vaca
3.3. Mycobiota analysis
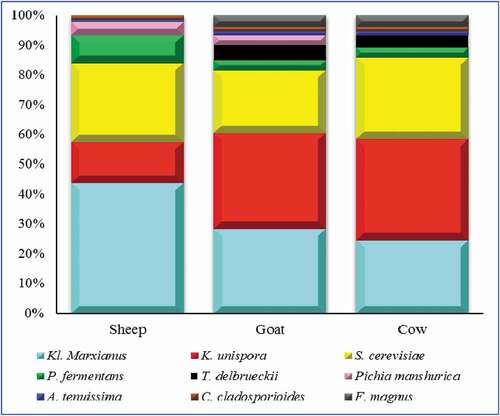
The fungal diversity was determined by 26 rRNA gene sequencing. The 1,298,997 sequences were generated in total. The total of 1,289,264 sequences with 382 bp median length were assessed by quality filtering. The satisfactory coverage of 99% was shown by Good’s coverage and rarefaction analysis in all samples. Compared with sheep kefir, the alpha diversity index of goat and cow samples showed lower complexity (). All of the three kefirs were significantly different from each other having highest diversity values for sheep kefirs followed by gat and cow. The core fungal flora is mainly composed of K. marxianus, K. unispora, S. cerevisiae. The median relative abundance value of K. unispora (13.40, 32.69, and 34.31%), S. cerevisiae (26.55, 21.78, and 27.24%) and K. marxianus (43.69, 28.78, and 24.04%) were recorded for sheep, goat and cow kefirs, respectively (). Beside these fungal species, little abundance of P. manshurica, P. fermentans, P. orientalis, and T. delbrueckii, while minor OTUs belonging to Alternaria tenuissima and Cladosporium cladosporioides were also detected.
Figure 4. Alpha diversity measures of fungal diversity in kefir prepared by sheep, goat and cow milk.
Figura 4. Medidas de diversidad alfa de la diversidad fúngica en el kéfir preparado con leche de oveja, de cabra y de vaca
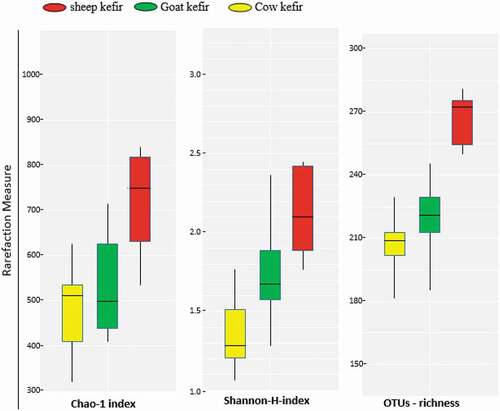
Figure 5. Major taxonomic group of fungal microbiota and their incidence in kefir prepared by sheep, goat and cow milk.
Figura 5. Principales grupos taxonómicos de la microbiota fúngica y su incidencia en el kéfir preparado con leche de oveja, de cabra y de vaca
All the yeast species found in this study were mainly reported from kefir milks all over the world (Bengoa et al., Citation2018). K. marxianus was primarily detected in all the kefir samples. Interestingly, because of antioxidant, low cholesterol and anti-inflammatory activities the K. marxianus derived from kefir are proposed to us as probiotics (Bourrie et al., Citation2016). The yeast K. marxianus usually linked with kefir beverages and other dairy products, is a lactose-positive yeast gives characteristic yeast flavor (Vardjan et al., Citation2013). In contrast, K. unispora, P. fermentans, T. delbrueckii and S. cerevisiae are lactose negative yeasts that do not ferment lactose and reproduce through glucose and galactose that are produced through lactose hydrolysis by the action of other microbes (Diosma et al., Citation2014; Garofalo et al., Citation2015). It was observed that the kefir drink prepared by sheep milk showed more abundance of K. marxianus than goat and cow milk. Notably, Pichia species, i.e., P. fermentans and P. manshurica were found in higher abundance in sheep kefir than goat and cow kefir. These are oxidative yeasts that have been previously found in fermented milk and other dairy products (Maoloni, Blaiotta, et al., Citation2020). P. fermentans was found as agent for the production of biofilms responsible for early formation of kefir particles (Prado et al., Citation2015). In goat and cow samples, the OTUs belonging to T. delbrueckii were also detected. It has also already been reported in Slovenia kefirs (Vardjan et al., Citation2013). In addition, the mycobiota analysis also indicated the presence of some minor OTUs belonging to A. tenuissima, C. cladosporioides fungi in all samples. A. tenuissima, C. cladosporioides are filamentous airborne fungi regarded as food contaminants (Osimani et al., Citation2016). Their existence might be due to the private household kefir grains which may derive from an uncontrolled environment. It is therefore recommended to accurately select the kefir grains as a microbial starter and applying hygienic conditions in the commercial kefir production process. Interestingly, the lower abundance of these spoilage fungi was noticed in sheep kefir samples than goat and cow kefir samples. The lower abundance of these spoilage fungi in sheep samples might be due to the relatively higher production of antimicrobial volatile compounds such as lactic and acetic acid and diacetyl in sheep kefir.
3.4. Physico-chemical characteristics of kefir drinks
The results for physico-chemical profile of three milk kefirs highlighted significant (p < .05) difference (). The sheep kefir exhibited significantly higher pH value than goat and cow kefirs which is due to the lower titratable acidity (TTA) values in sheep kefir. Higher pH value for food products is desirable as it maintains the shelf life of the food product. In case of kefir drinks, Kim et al. (Citation2018) highlighted that high pH is important to maintain the sensory characteristics, i.e., taste and flavor during product’s shelf life. The pH range recorded in this study was similar to pH of milk kefirs previously obtained in several studies (Irigoyen et al., Citation2005; Kim et al., Citation2018). The pH of goat kefir was relatively higher than cow but the difference was not significant. Significantly higher values for dry matter was seen from cow to goat to sheep kefir. Similar trend was also observed for ash, protein and lactose. The dry mater (12.13, 11.21, 10.35), ash (0.81, 0.72, 0.61) protein (3.63, 3.12, 2.86) and lactose (3.14, 2.41, 1.98) were recorded for sheep, goat and cow kefirs, respectively. Generally, the overall range of proximate compositions noted in this study is consistent with other results reported by other researchers such as Sekkal-Taleb (Citation2016), Irigoyen et al. (Citation2005) and by Kim et al. (Citation2018).
Table 1. Physio-chemical and colorimetric composition of milk kefir prepared by sheep goat and kefir milk.
Tabla 1. Composición fisicoquímica y colorimétrica del kéfir preparado con leche de oveja y de cabra
Significantly higher DL-lactic acid was noticed in goat and cow kefir than sheep kefir. DL-lactic acid can be produced homofermentatively by Lactobacillus spp. (Fujisawa et al., Citation1988). Although the major Lactobacillus spp. i.e., L. kefiranofaciens was detected equally in sheep, goat and cow kefir with no significant difference but the significantly higher abundance of other Lactobacillus spp. such as Lactobacillus parakefir and Lactobacillus plantarum in goat and cow kefir was responsible for higher DL-lactic acid in goat and cow kefir. Unlike, goat and cow kefir the sheep kefir had more L-LA (L-lactic acid). As, it was reported that Lactococcus bacteria perform homofermentative metabolism and is responsible for L-LA production only (Roissart & Luquet, Citation1994), the higher level of L-LA might be because of dominance of Lactococcus species in sheep kefir. This is beneficial to the consumers as the steroisomer D-lactic acid sometimes disturb the metabolism and cause decalcification and acidosis (Hofvendahl & Hahn-Hägerdal, Citation2000). In case of colorimetric profile, the lightness parameter L* was same for all three kefir types while significantly higher chroma and yellowness b* were noticed for sheep kefir. The redness index a* however was lower in sheep kefir as compared to goat and cow kefir. The values for L coordinate were very similar to those reported by Gul et al. (Citation2018) for milk kefir prepared by buffalo and cow milk (91.32 and 91.82 and) and 91.44 for sheep (Znamirowska et al., Citation2017). The values for red-green (a) coordinate were also similar to those already reported for buffalo, cow and sheep kefirs (−1.49, −1.01, −4.17, respectively) (Gul et al., Citation2018; Znamirowska et al., Citation2017). Yellow-blue (b) coordinates values were consistent to those recorded for traditional and commercial cow milk kefir (Gul et al., Citation2018).
3.5. Analysis of volatile compounds in kefir
The kefir samples were analyzed for their nonvolatile compounds through SPME-GC/MS analysis. Total of 42 volatile compounds were detected in samples. Those peaks having that are not significantly different and having peak area less than 1% of the total peak areas are not included in statistical analysis. Remaining 22 compounds were enlisted in . These compounds were divided into different chemical groups such as alchols, ketons, acids, and acetates. Four compounds (i.e., ethanol, 2-heptanol, isoamyl alchol, phenethyl alcohol) were detected as alchols, five compounds (i.e., 2-propanone, 2-butanone, 2-heptanone, acetoin, 2-nonanone) as ketons, 10 compounds (i.e. acetic acid, formic acid, propanoic acid, isobutanoic acid, butanoic acid, pentanoic acid, hexanoic acid, heptanoic acid, octanoic acid, benzoic acid) as acids and three compounds (i.e., ethyl acetate, isoamyl acetate, phenethylacetate) as acetates. The compounds acetic acid, phenethyl alcohol as well as ethanol were more abundant as compared to other compounds. Significant differences were noticed in peak area of these compounds among three samples. The sheep milk kefir samples had more content of acetic acid and phenethyl alcohol followed by goat and cow milk kefir samples. Among alcoholic compounds, after ethanol the phenethyl alcohol significantly characterized the three samples. The sheep samples showed higher phenethyl alcohol content than goat and cow. For ketones compounds the 2-propanone showed more content as compared to other ketones while no significant differences were observed among the three sample types. In case of acids compounds, the octanoic acid and benzoic acid were more prevalent in goat and cow samples than sheep samples. Among acetates, well characterization among the samples was seen on the basis of phenethylacetate and ethyl acetate. Both of these compounds were predominant in sheep samples. Among alcoholic compounds ethanol predominantly found in all samples. The ethanol is associated with light alcoholic flavor while alcoholic contents if in higher contents give the while yeast flavor to the final product (Güzel-Seydim, Seydim, Greene, & Bodine, Citation2000). The significant decrease of ethanol in sheep kefir may be related to the significant decrease in yeast counts in sheep kefir. Among acidic compounds, the most representative compound was acetic acid samples. Acetic acid is one of the simplest carboxylic acid produced by natural process – aerobic fermentation, through action of acetic bacteria. It has no adverse effects and no dietary restrictions. It is used in the preservation of food as a natural preservative and antimicrobial agent as well as an active component of edible films and in hurdle technology of preservation. Since, acetic acid production is directly affected by the acetic bacteria so the higher content of acetic acid in sheep samples could be linked to higher AAB counts in sheep milk kefir. The sheep kefir samples characteristically showed 2-butanone, acetoin and 2-propanone. These volatile compounds are related to characteristic sweet cheese flavor or yogurt-like aroma (Dertli & Çon, Citation2017). Other researchers also reported that acetoin comes under the main group of microbial fermentation that is responsible for characterization of kefir aroma (Güzel-Seydim, Seydim, & Greene, Citation2000). Volatile compounds are naturally occurring organic compounds produced as secondary metabolites during microbial fermentation (M.-G. Mota-Gutierrez et al., Citation2019). Along with sensory properties these metabolites may also be beneficial for consumer’s health. In kefir, this non-microbial part that is composed of short chain fatty acids, acetaldehyde, acetoin, alcoholic compounds, and organic acids such as butyrate, propionate, acetate, and lactate has a variety of health promoting functions (Bengoa et al., Citation2018).
Table 2. Volatile compounds detected by SPME-GC/MS in three different kefir samples prepared by sheep, goat and cow milk.
Tabla 2. Compuestos volátiles detectados por SPME-GC/MS en tres muestras diferentes de kéfir preparadas con leche de oveja, de cabra y de vaca
Particularly, phenethyl alcohol is also one of the abundant compounds detected in the samples. Phenethyl alcohol can inhibit the growth of filamentous fungi and G− bacteria (Fraud et al., Citation2003). Phenethyl alcohol’s synthesis is carried out through the metabolism of yeast mainly through S. cerevisiae, K. marxianus, Wickerhamomyces anomalus, P. kudriavzevii, P. farinose and P. anomala. Moreover, ester phenethyl acetat which is a strong antimicrobial compound also produced by metabolism through yeasts such as P. kudriavzevii, P. anomala, P. farinosa, S. cerevisiae, K. marxianus and K. lactis (M.-G. Mota-Gutierrez et al., Citation2019). The higher content of phenethyl alcohol and phenethyl acetat in sheep kefir samples can be explained on the basis of more relative abundance of K. marxianus and Pichia spp. in sheep samples than in goat and cow kefir samples. The antimicrobial properties are also linked to its diacetyl, ethanol, acetic and lactic acid contents. These compounds can reduce the growth of spoilage and pathogenic microbes (Farnworth, Citation2005). The higher content of these compounds found in sheep kefir samples is responsible for lower abundance of filamentous spoilage fungi, i.e., A. tenuissima and C. cladosporioides. Sheep kefir samples support the growth of beneficial bacteria and yeast more than goat and cow kefir samples which in turn causes the production of more volatile compounds as a result of metabolic activities and these compounds maintain the desired flavor, aroma characteristics of kefir and reduced the growth of spoilage and pathogenic microbes.
Three milk kefirs prepared by sheep, goat and cow milks were significantly different from each other in term of microbial diversity, physio-chemical and colorimetric attributes, resulting in significantly different volatile profile. Generally, sheep kefir was found superior over goat and cow kefir. The important microbiota having probiotic and nutritional features as well as sensory and antimicrobial related volatile compounds were significantly higher in sheep kefir than goat and cow kefir. Findings of this study clearly revealed that the type of substrate (milk) plays an important role in the maintenance and production of quality kefir drinks.
Supplemental Material
Download MS Word (43 KB)Disclosure statement
No potential conflict of interest was reported by the author(s).
Supplementary material
Supplemental data for this article can be accessed on the publisher’s website.
References
- A.O.A.C. (2007). AOAC official methods 986.15. Official methods of analysis of the association of official analytical chemists (18th ed.). AOAC.
- Altay, F., Karbancıoglu-Güler, F., Daskaya-Dikmen, C., & Heperkan, D. (2013). A review on traditional Turkish fermented non-alcoholic beverages: Microbiota, fermentation process and quality characteristics. International Journal of Food Microbiology, 167(1), 44–56. https://doi.org/https://doi.org/10.1016/j.ijfoodmicro.2013.06.016
- Arslan, S. (2015). A review: Chemical, microbiological and nutritional characteristics of kefir. CyTA - Journal of Food, 13(3), 340–345. https://doi.org/https://doi.org/10.1080/19476337.2014.981588
- Bengoa, A., Iraporda, C., Garrote, G. L., & Abraham, A. G. (2018). Kefir micro-organisms: Their role in grain assembly and health properties of fermented milk. Journal of Applied Microbiology, 126(3), 686–700. https://doi.org/https://doi.org/10.1111/jam.14107
- Botelho, P. S., Maciel, M. I., Bueno, L. A., MarquesMde, F., Marques, D. N., & Sarmento, T. M. (2014). Characterisation of a new exopolysaccharide obtained from of fermented kefir grains in soymilk. Carbohydrate Polymers, 107, 1–6. https://doi.org/https://doi.org/10.1016/j.carbpol.2014.02.036
- Bourrie, B. C. T., Willing, B. P., & Cotter, P. D. (2016). The microbiota and health promoting characteristics of the fermented beverage kefir. Frontiers in Microbiology, 7, 647. https://doi.org/https://doi.org/10.3389/fmicb.2016.00647
- Dertli, E., & Çon, A. H. (2017). Microbial diversity of traditional kefir grains and their role on kefir aroma. LWT - Food Science and Technology, 85, 151–157. https://doi.org/https://doi.org/10.1016/j.lwt.2017.07.017
- Di Renzo, T., Reale, A., Boscaino, F., & Messia, M. C. (2018). Flavoring production in Kamut®, quinoa and wheat doughs fermented by Lactobacillus paracasei, Lactobacillus plantarum, and Lactobacillus brevis: a SPME-GC/MS study. Frontiers in Microbiology, 9, 429. https://doi.org/https://doi.org/10.3389/fmicb.2018.00429
- Diosma, G., Romanin, D. E., Rey-Burusco, M. F., Londero, A., & Garrote, G. L. (2014). Yeasts from kefir grains: Isolation, identification, and probiotic characterization. World Journal of Microbiology and Biotechnology, 30(1), 43–53. https://doi.org/https://doi.org/10.1007/s11274-013-1419-9
- Dixon, P. (2003). VEGAN, a package of R functions for community ecology. Journal of Vegetation Science, 14(6), 927–930. https://doi.org/https://doi.org/10.1111/j.1654-1103.2003.tb02228.x
- Dobson, A., O’Sullivan, O., Cotter, P. D., Ross, P., & Hill, C. (2011). High-throughput sequence-based analysis of the bacterial composition of kefir and an associated kefir grain. FEMS Microbiology Letters, 320(1), 56–62. https://doi.org/https://doi.org/10.1111/j.1574-6968.2011.02290.x
- Farnworth, E. R. (2005). Kefir e a complex probiotic. Food Science and Technology Bulletin: Functional Foods, 2, 1–17. https://doi.org/https://doi.org/10.1616/1476-2137.13938
- Fraud, S., Rees, E. L., Mahenthiralingam, E., Russell, A. D., & Maillard, J. Y. (2003). Aromatic alcohols and their effect on Gram-negative bacteria, cocci and mycobacteria. Journal of Antimicrobial Chemotherapy, 51(6), 1435–1436. https://doi.org/https://doi.org/10.1093/jac/dkg246
- Fujisawa, T., Adachi, S., Toba, T., Arihara, K., & Mitsuoka, T. (1988). Lactobacillus kefiranofaciens sp. nov. isolated from kefir grains. International Journal of Systematic Bacteriology, 38(1), 12–14. https://doi.org/https://doi.org/10.1099/00207713-38-1-12
- Gao, J., Gu, F., Abdella, N. H., Ruan, H., & He, G. (2012). Investigation on culturable microflora in Tibetan kefir grains from different areas of China. Journal of Food Science, 77(8), 425–433. https://doi.org/https://doi.org/10.1111/j.1750-3841.2012.02805.x
- Gao, W., & Zhang, L. (2019). Comparative analysis of the microbial community composition between Tibetan kefir grains and milks. Food Research International, 116, 137–144. https://doi.org/https://doi.org/10.1016/j.foodres.2018.11.056
- Garofalo, C., Osimani, A., Milanovic, V., Aquilanti, L., De Filippis, F., Stellato, G., Di Mauro, S., Turchetti, B., Buzzini, P., Ercolini, D., & Clementi, F. (2015). Bacteria and yeast microbiota in milk kefir grains from different Italian regions. Food Microbiology, 49, 123–133. https://doi.org/https://doi.org/10.1016/j.fm.2015.01.017
- Gul, O., Atalar, I., Mortas, M., & Dervisoglu, M. (2018). Rheological, textural, colour and sensorial properties of kefir produced with buffalo milk using kefir grains and starter culture: A comparison with cows’ milk kefir. International Journal of Dairy Technology, 71, 73–80. https://doi.org/https://doi.org/10.1111/1471-0307.12503
- Guzel-Seydim, Z. B., Kök-Taş, T., Greene, A. K., & Seydim, A. C. (2011). Review: Functional properties of kefir. Critical Reviews in Food Science and Nutrition, 51(3), 261–268.
- Güzel-Seydim, Z. B., Kök-Taş, T., Greene, A. K., & Seydim, A. C. (2011). Review: Functional properties of kefir. Critical Reviews in Food Science and Nutrition, 51(3), 261–268. https://doi.org/https://doi.org/10.1080/10408390903579029
- Güzel-Seydim, Z. B., Seydim, A. C., & Greene, A. K. (2000). Organic acids and volatile flavor components evolved during refrigerated storage of kefir. Journal of Dairy Science, 83(2), 275–277. https://doi.org/https://doi.org/10.3168/jds.S0022-0302(00)74874-0
- Güzel-Seydim, Z. B., Seydim, A. C., Greene, A. K., & Bodine,A. B. (2000). Determination of organic acids and volatile flavor substances in kefir during fermentation. Journal of Food Composition and Analysis, 13(1), 35–43. https://doi.org/https://doi.org/10.1006/jfca.1999.0842
- Guzel‐seydim, Z. E. Y. N. E.P., Wyffels, J. T., Seydim, A. C. & Greene, A. K., (2005). Turkish kefir and kefir grains: microbial enumeration and electron microscobic observation. International Journal of Dairy Technology, 58, 25–29.
- Hamet, M. F., Londero, A., Medrano, M., Vercammen, E., Van, Hoorde, K., Garrote, G. L., Huys, A. G., Vandamme, P., & Abraham, A. G. (2013). Application of culture-dependent and culture-independent methods for the identification of Lactobacillus kefiranofaciens in microbial consortia present in kefir grains. Food Microbiology, 36(2), 327–334. https://doi.org/https://doi.org/10.1016/j.fm.2013.06.022
- Hofvendahl, K., & Hahn-Hägerdal, B. (2000). Factors affecting the fermentative lactic acid production from renewable resources. Enzyme and Microbial Technology, 26(2–4), 87–107. https://doi.org/https://doi.org/10.1016/S0141-0229(99)00155-6
- Irigoyen, A., Arana, I., Castiella, M., Torre, P., & Ibanez, F. C. (2005). Microbiological, physicochemical, and sensory characteristics of kefir during storage. Food Chemistry, 90(4), 613–620. https://doi.org/https://doi.org/10.1016/j.foodchem.2004.04.021
- Kabak, B., & Dobson, A. D. (2011). An introduction to the traditional fermented foods and beverages of Turkey. Critical Reviews in Food Science and Nutrition, 51(3), 248–260. https://doi.org/https://doi.org/10.1080/10408390903569640
- Khan, R. A. A., Najeeb, S., Mao, Z., Ling, J., Yang, Y., Li, Y., & Xie, B. (2020). Bioactive secondary metabolites from Trichoderma spp. against phytopathogenic bacteria and root-knot nematode. Microorganisms, 8(3), 401. https://doi.org/https://doi.org/10.3390/microorganisms8030401
- Kim, D. H., Jeong, D., Song, K. Y., & Seo, K. H. (2018). Comparison of traditional and backslopping methods for kefir fermentation based on physicochemical and microbiological characteristics. Food Science and Technology, 97, 503–507. https://doi.org/https://doi.org/10.1016/j.lwt.2018.07.023
- Klindworth, A., Pruesse, E., Schweer, T., Peplies, J., Quast, C., Horn, M., & Glöckner, F. O. (2013). Evaluation of general 16S ribosomal RNA gene PCR primers for classical and next-generation sequencing-based diversity studies. Nucleic Acids Research, 41(1), 1. https://doi.org/https://doi.org/10.1093/nar/gks808
- Kök-Taş, T., Ekinci, F. Y., & Guzel-Seydim, Z. B. (2012). Identification of microbial flora in kefir grains produced in Turkey using PCR. International Journal of Dairy Technology, 65(1), 126–131. https://doi.org/http://dx.doi.org/10.1111/j.1471-0307.2011.00733.x
- Maoloni, A., Blaiotta, G., Ferrocino, I., Mangia, N. P., Osimani, A., Milanović, V., Cardinali, F., Cesaro, C., Garofalo, C., Clementi, F., Pasquini, M., Trombetta, M. F., Cocolin, L., & Aquilanti, L. (2020). Microbiological characterization of Gioddu, an Italian fermented milk. International Journal of Food Microbiology, 323, 108610. https://doi.org/https://doi.org/10.1016/j.ijfoodmicro.2020.108610
- Maoloni, A., Milanović, V., Cardinali, F., Mangia, N. P., Murgia, M. A., Garofalo, C., Clementi, F., Osimani, A., & Aquilanti, L. (2020). Bacterial and fungal communities of Gioddu as revealed by PCR–DGGE analysis. Indian Journal of Microbiology, 60(1), 119–123. https://doi.org/https://doi.org/10.1007/s12088-019-00838-6
- Miguel, M. G. D. C. P., Cardoso, P. G., Lago, L. D. A., & Schwan, R. F. (2010). Diversity of bacteria present in milk kefir grains using culture-dependent and culture-independent methods. Food Research International, 43(5), 1523–1528. https://doi.org/https://doi.org/10.1016/j.foodres.2010.04.031
- Morand-Fehr, P., Fedele, V., Decandia, M., & Le Frileux, Y. (2007). Influence of farming and feeding systems on composition and quality of goat and sheep milk. Small Ruminant Research, 68(1–2), 20–34. https://doi.org/https://doi.org/10.1016/j.smallrumres.2006.09.019
- Mota-Gutierrez, J., Botta, C., Ferrocino, I., Giordano, M., Bertolino, M., Dolci, P., Cannoni, M., & Cocolin, L. (2018). Dynamics and biodiversity of bacterial and yeast communities during fermentation of cocoa beans. Applied and Environmental Microbiology, 84(19), e01164–18. https://doi.org/https://doi.org/10.1128/AEM.01164-18
- Mota-Gutierrez, M.-G., Barbosa-Pereira, B.-P., Ferrocino, F., & Cocolin, C. (2019). Traceability of functional volatile compounds generated on inoculated cocoa fermentation and its potential health benefits. Nutrients, 11(4), 884. https://doi.org/https://doi.org/10.3390/nu11040884
- Osimani, A., Garofalo, C., Milanović, V., Taccari, M., Aquilanti, L., Polverigiani, S., & Clementi, F. (2016). Indoor air quality in mass catering plants: Occurrence of airborne eumycetes in a university canteen. International Journal of Hospitality Management, 59, 1–10. https://doi.org/https://doi.org/10.1016/j.ijhm.2016.08.004
- Otles, S., & Cagindi, O. (2003). Kefir: A probiotic dairy-composition, nutritional and therapeutic aspects. Pakistan Journal of Nutrition, 2(2), 54–59. https://doi.org/https://doi.org/10.3923/pjn.2003.54.59
- Prado, M. R., Blandón, L. M., Vandenberghe, L. P. S., Rodrigues, C., Castro, G. R., Thomaz-Soccol, V., & Soccol, C. R. (2015). Milk kefir: Composition, microbial cultures, biological activities, and related products. Frontiers in Microbiology, 6, 1177. https://doi.org/https://doi.org/10.3389/fmicb.2015.01177
- Rodrigues, K. L., Caputo, L. R. G., Carvalho, J. C. T., Evangelista, J., & Schneedorf, J. M. (2005). Antimicrobial and healing activity of kefir and kefiran extract. International Journal of Antimicrobial Agents, 25(5), 404–408. https://doi.org/https://doi.org/10.1016/j.ijantimicag.2004.09.020
- Roissart, H., & Luquet, F. M. (1994). Bactéries lactiques: Aspects fondamentaux et technologiques (Vol. 1). Lorica.
- Sekkal-Taleb, N. (2016). Chemical and microbiological composition of Kefir and its natural benefits. Mediterranean Journal of Biosciences, 1, 174–183.
- Taheur, F. B., Fedhila, K., Chaieb, K., Kouidhi, B., Bakhrouf, A., & Abrunhosa, L. (2017). Adsorption of aflatoxin B1, zearalenone and ochratoxin A by microorganisms isolated from Kefir grains. International Journal of Food Microbiology, 251, 1–7. https://doi.org/https://doi.org/10.1016/j.ijfoodmicro.2017.03.021
- Vardjan, T., Mohar, L. P., Rogelj, I., & Canzek, M. A. (2013). Characterization and stability of lactobacilli and yeast microbiota in kefir grains. Journal of Dairy Science, 96(5), 2729–2736. https://doi.org/https://doi.org/10.3168/jds.2012-5829
- Zheng, Y., Lu, Y., Wang, J., Yang, L., Pan, C., & Huang, Y. (2013). Probiotic properties of Lactobacillus strains isolated from Tibetan Kefir grains. PLoS One, 8(7), e69868. https://doi.org/https://doi.org/10.1371/journal.pone.0069868
- Znamirowska, A., Szajnar, K., Rożek, P., Kalicka, D., Kuźniar, P., Hanus, P., & Kluz, M. (2017). Effect of addition of wild garlic (Allium ursinum) on the quality of kefirs from sheep’s milk. Acta Scientiarum Polonorum, Technologia Alimentaria, 16, 213–219. https://www.food.actapol.net/pub/10_2_2017.pdf