
 ?Mathematical formulae have been encoded as MathML and are displayed in this HTML version using MathJax in order to improve their display. Uncheck the box to turn MathJax off. This feature requires Javascript. Click on a formula to zoom.
ABSTRACT
The changes in physicochemical properties of salt-soluble proteins and gel prepared with chicken breast muscles during −1.5oC (ice-temperature) and 4oC (refrigerated temperature) storage were investigated. Compared with the samples of 4oC stored group, the decrease in solubility, the content of total sulfhydryl and available sulfhydryl groups of SSP from chicken breast muscles at −1.5oC storage was effectively delayed, and the increase of both surface hydrophobicity and content of disulfide bond was obviously inhibited. The gel prepared with −1.5oC stored samples had much higher holding capacity of water, lower cooking loss, better springiness, and more uniform three-dimensional network structures with smaller-sized pores than those from 4°C stored-samples. Additionally, great changes in the proportions of non-flowing water and free water ratio were observed during 4oC storage. In short, the ice-temperature storage used for chicken meat preservation was better than refrigerated storage.
RESUMEN
Este estudio se propuso investigar los cambios detectados en las propiedades fisicoquímicas de las proteínas solubles en sal y del gel preparado con músculos de pechuga de pollo durante su almacenamiento a −1.5°C (temperatura de hielo) y a 4°C (temperatura de refrigeración). Se constató que, en comparación con las muestras del grupo almacenado a 4°C, en el grupo almacenado a −1.5°C se retrasó de forma efectiva la disminución de la solubilidad, el contenido de grupos sulfhidrilos totales y disponibles de la SSP de los músculos de pechuga de pollo. Asimismo, se comprobó un aumento de la hidrofobicidad superficial y del contenido de uniones de disulfuro. Por otra parte, se observó que el gel preparado con muestras almacenadas a −1.5°C evidenció mucha más capacidad de retención de agua, menor pérdida durante la cocción, mejor elasticidad, así como estructuras de red tridimensionales más uniformes, con poros de menor tamaño que los de las muestras almacenadas a 4°C. Además, durante el almacenamiento a 4°C se observaron importantes cambios en las proporciones de agua no fluida y agua libre. En resumen, el estudio demostró que el almacenamiento a temperatura de hielo es mejor que el almacenamiento refrigerado para conservar la carne de pollo.
1. Introduction
Chicken was the cheapest and most easily accessible meat source, and its annual yield in 2019 reached 99.572 million tons (Henchion et al., Citation2014; Hu et al., Citation2018; Özünlü et al., Citation2018; Xin et al., Citation2020). Chicken meat is popular due to their many desirable nutritional characteristics, such as high protein, low cholesterol, low fat with relatively high content of polyunsaturated fatty acids (Feng et al., Citation2015; Sáyago-Ayerdi et al., Citation2009). Chicken meat was important raw material for deeply processed meat products, which included sausage, meat ball, meat cake, and so on. And gel property was an important index of these products, and was affected by the raw material of meat, additive, and processing conditions. The influences of the raw material of meat on gel quality have attracted researchers’ great attention in recent years. Salt-soluble protein, being a kind of structural protein complex with important biological functions, accounted for about 50%-55% of the total meat muscle proteins (Choi et al., Citation2011; S. Guo et al., Citation2008). Having the ability of forming three-dimensional network of gels, salt-soluble proteins could determine water-holding capacity (WHC) and the texture of producing meat gel products (Sun & Holley, Citation2011). Furthermore, salt-soluble proteins could influence the emulsification properties and rheological behaviors of meat gel products.
In order to meet the raw material demand of chicken meat, chemical, biological and physical preservation methods were employed to prolong the edible properties of chicken meat. The preservatives used in chemical and biological preservation methods usually affect the appearance of chilled meat, resulting in juice loss and other problems. Safe and efficient preservation methods of meat were investigated by researchers.
Recently, ice-temperature storage with temperature range (ice-temperature belt) above freezing point and below 0°C had attracted increasing attention due to that they could effectively delay the deterioration and prolong the storage life of meat (Sun et al., Citation2014). Ge et al. (Citation2019) reported that the hardness, elasticity, chewiness and sensory evaluation of yellow-feather broiler muscles showed a downward trend during ice-temperature storage. Compared with 4oC storage, ice temperature could keep the better quality of chicken, and extend the shelf-life by 12 days (S. Li et al., Citation2019). Similar result was described by Xu et al. (Citation2015). Ingrid (Citation2011) reported that, compared with the shelf of chicken under chill storage, the shelf life at ice temperature storage could be prolonged by 50%. However, to the best of our knowledge, such researches remained less in focusing on the effect of ice-temperature storage on the properties of salt-soluble proteins and gel of chicken meat. Therefore, the present research was carried out to explore the influences of ice-temperature storage on the solubility, the content of sulfhydryl group, surface hydrophobicity, and disulfide bond of salt-soluble proteins from chicken breast muscles. Subsequently, the impact on gel quality of chicken breast muscles was explored.
2. Materials and methods
2.1. Materials
Fresh muscles of chicken breast (White feather broilers, 40–45 days old, about 1.6 ± 0.12 kg live weight) were supplied by a local food processor (Xinxiang, Henan, China). After being immediately trimmed off the visible fat and connective tissues, and cut into 1.0 cm × 1.0 cm × 1.0 cm cubes, the meat was packaged in polyethylene plastic bags 200 g per bag. Subsequently, each sample was stored at −1.5oC (ice-temperature) for 20 days and at 4oC (refrigerated temperature) for 8 days, respectively. The samples were analyzed every 2 days.
2.2. Extraction of salt-soluble protein from chicken breast muscles
Chicken salt-soluble protein (CSSP) was prepared according to the method described by Gao et al. (Citation2016), and Ma et al. (Citation2012) with some modifications. And the steps of all the preparation were carried out at about 4°C. The chicken breast muscles were homogenized in a blender (AD200L-P, Shanghai onni instrument Ltd., China) in four volumes isolation buffer (17.8 mM Na5P3O10, 0.5 M NaCl, pH 8.3) at the highest speed for 60 s. After being set at 4°C for 3 h, the slurry was centrifuged at 12, 000 g for 30 min at 4oC with Sorvall ST40 freezing centrifuge (Thermo Fisher Scientific, Germany). The extract of protein was strained through three layers of cheese cloth. The concentrations of protein were determined with the biuret method with bovine serum protein as the standard protein.
2.3. Analysis of protein solubility
The solubility of protein was measured according to the reported method (Choi et al., Citation2011; X. Y. Guo et al., Citation2015) with some modifications. The protein suspensions (4 mg/mL) were centrifuged at 1, 500 g for 20 mins at 4oC. The relative content of protein in the supernatants compared with that in the original suspensions was taken to be the solubility of protein. The biuret method was employed to determine the protein content (Gornall et al., Citation1949). The measurements were performed in triplicate.
2.4. Sulfhydryl group content in protein
The content of sulfhydryl group in protein was analyzed according to Nguyen et al. (Citation2011) with some modifications. 0.5 mL of protein solution (4 mg/mL) was added to 4.5 mL of pH 7.0 buffer (10 mM K2HPO4/KH2PO4, 10 mM EDTA, 0.6 M KCl, 8 M urea). Subsequently, 0.5 mL of 0.1% 2-nitrobenzoic acid (DTNB) (10 mM K2HPO4/KH2PO4, pH 7.0) was added. And then the solution was mixed and maintained in darkroom at 4oC for 60 min. After being reacted, the absorbance was measured at 412 nm and the content of total sulfhydryl group was obtained by using the extinction coefficient of 13, 600 M−1cm−1. The content of available sulfhydryl group was consistent with that of total sulfhydryl group except urea. The measurements were carried out in triplicate.
2.5. Disulfide bond content in protein
The content of disulfide bond was measured by 2-nitro-5-thiosulfobenzoate (NTSB) assay, which was reported by Chen et al. (Citation2018). 0.25 mL of protein solution was mixed with 3 mL freshly prepared NTSB solution (pH 9.5). And then the mixture was incubated in a dark place at 25°C for 25 min. After being reacted, the absorbance of the solution was measured at 412 nm using T9 spectrophotometer (Beijing Purkinje General Instruments Co., Ltd., China). The content of disulfide bond was calculated using a molar extinction coefficient of 13, 900 M−1cm−1. The measurements were performed in triplicate.
2.6. Determination of surface hydrophobicity
Surface hydrophobicity of CSSP was determined by the method described by Mehta et al. (Citation2014) with slight modifications. 1 mL of CSSP solution was mixed with 200 µL of 1 mg/mL bromophenol blue (BPB) sodium salt. The control was the mixture of 200 mL of BPB and 1 mL of 20 mM phosphate buffer at pH 6.8. After being maintained with agitation on the shaker at 25oC for 10 min, the samples and control were centrifuged at 2,000 g for 15 min. Supernatant was diluted 10 times with a phosphate buffer. The absorbance of the supernatant was taken at 595 nm, and phosphate buffer was used as the blank. The amount of BPB bound was obtained with the formula:
Where, A was the absorbance at 595 nm.
2.7. SDS-polyacrylamide gel electrophoresis
The sodium dodecyl sulfate (SDS) polyacrylamide gel electrophoresis was carried out following the reported method (Gao et al., Citation2016; Laemmli, Citation1970) with slight modifications by using DYCZ-24DN electrophoresis apparatus (Liuyi Biotechnology Ltd., Beijing, China). Briefly, the protein sample solutions were diluted to the concentration of 1 mg/mL with buffer in 1:1 (v/v), and denatured by heating in boiling water for 5 min. The prepared protein of 12 µg was added to the blend gel, which consisted of 12.5% separating gel (0.375 M Tris, pH 8.8) and 4% stacking gel (1.5 M Tris, pH 8.8). Electrophoresis was performed with the voltage of 80 V for 2.5 h at room temperature (25oC) to separate the sample. After being put into 1% dye solution and shaken in a rocker for 30 min to dye the bands of separated sample, the molecular weight of protein sample from gel was analyzed against the standard marker.
2.8. Preparation of chicken gel
Chicken gel was prepared according to the method of Ji et al. (Citation2020). 200 g of chicken breast muscle samples stored at −1.5oC or 4oC for different time, together with 4 g sodium chloride and 40 g ice-water, were chopped using a chilled bowl cutter (UMC-5 C, Stephan, Germany) for 2 min at 1, 500 r/min. After standing for 3 min, it was chopped for another 2 min at 3, 000 r/min. The internal temperature of samples was always below 10oC. 35 g of the obtained mixture was transferred to 50 mL centrifugal tubes. After being equilibrated at 4oC for 2 h, the centrifugal tubes were divided into two groups. One group was set in water bath at 85°C and heated to the internal temperature of 75°C. The obtained gels were immediately transferred to ice water until its temperature decreased to room temperature (25oC). Afterward, the chicken gels were kept at 4oC for 12 h before further analysis. The other one was used for further analysis.
2.9. Determination of cooking loss and water-holding capacity
Cooking loss (CL) of gels was measured according to the method of Chen et al. (Citation2014), and Xia et al. (Citation2019) with slight modification. Pre-weighed (M0) dispersions as described in 2.8 was transferred to 50 mL centrifugal tubes, and cooked at 85oC for 30 min. After being cooled to room temperature, gel samples were stored overnight in a refrigerator at 4oC, and then stood at room temperature for 2 h. Subsequently, the water oozed from the gel was blotted up with filter paper. Finally, the mass of gel after the leakage of water was weighed (M1). Percentage of cooking loss was calculated using the following formula: CL (%) = (M0− M1)/M0 × 100.
Water holding capacity (WHC) of gels was detected according to the published method (K. Li et al., Citation2019) with some modifications. Gel samples (Φ10 mm × 20 mm height) were wrapped in filter paper, placed in a centrifuge tube with filter paper in the bottom, and then centrifuged at 8, 000 g for 10 min at 4oC. WHC was expressed as the ratio of gel weight after centrifugation (m2) to the initial gel sample weight (m1) using the following formula: WHC (%) = m2/m1 × 100. Each sample was performed in triplicate.
2.10. Texture analysis of gel
The texture of samples was determined by a texture analyzer (TA-XT2i, Stable Micro System, England) according to the reported method (Zhuang et al., Citation2018) with some modifications. After storage at room temperature for 2 h, the prepared gels (Φ25 mm × 20 mm height) were placed on the platform, and measured under TPA mode. A cylinder probe of P/36 R was used. Each sample was compressed to 40% height. The speed of pre-test, test and post-test was 2.0 mm/s, and the force was 5 g. Data acquisition rate was 200 pps. The hardness (N) and springiness were obtained. Each sample was measured in five times.
2.11. Dynamic rheology
Dynamic thermo-rheological properties of sample were determined according to the published method (Kang et al., Citation2016) by using Haake Mars 60 rheometer (Thermo Fisher Scientific, Germany). A parallel-plate geometry (50 mm) with 0.5 mm gap was used. The sample was sheared in oscillatory mode at a frequency of 0.1 Hz and the strain of 2%. The temperature of samples rose from 25oC to 85°C at the rate of 2°C/min. Changes in the storage modulus (G’) was measured during the heating along with an increase in temperature. Each sample was measured in triplicate.
2.12. Measurement of low field nuclear magnetic resonance
Low field nuclear magnetic resonance (NMR) analysis was carried out using the reported method of Xia et al. (Citation2019) with slight modifications. About 2 g of the sample was placed in a cylindrical glass tube and inserted into the NMR probe. The values of transverse relaxation times (T2) were detected by using Niumag PQ001 NMR analyzer (Niumag Electric Corporation, Shanghai, China) performed at 32oC and resonance frequency of 22.6 MHz. Data were acquired as 32 scan repetitions, and 200 μs between pulses of 90° and 180°. The measurements were performed in triplicate.
2.13. Scanning electron microscope
The microstructure of gels was analyzed according to the procedure of Wattanachant et al. (Citation2005) with slight modification. After being cut into cubes (1 cm × 1 cm × 0.5 cm), the gel was fixed with 2.5% glutaraldehyde in 0.1 M phosphate buffer (pH 6.8) overnight at room temperature. The samples were rinsed with deionized water and then dehydrated in a serial solution of 25%, 50%, 70%, 95%, and 100% (v/v) ethanol (twice) for one hour in each solution. The dehydrated samples were dried by carbon dioxide supercritical drying method. The obtained samples were gold-coated and observed by SEM (Quanta 200, FEI Ltd., Oregon, USA).
2.14. Statistical analysis
The results are presented as mean values and standard deviation. All data were subjected to analysis using one-way analysis of variance (ANOVA) using SPSS 18.0 for Windows. Significant differences among the mean were evaluated by LSD test at 5% level.
3. Results and discussion
3.1. Changes in physico-chemical properties of CSSP
3.1.1. Solubility
The solubility of protein was widely used as an indicator of structural changes in protein, and was a good marker of protein denaturation. As is shown in , the solubility of CSSP decreased continuously along with the prolonging of storage time. There was no significant difference among the solubility of protein from chicken breast muscles treated at −1.5°C for less than 8 days (p > .05), but the value of solubility declined remarkably when chicken meat was treated for more than 10 days at −1.5oC (p < .05).
Figure 1. Change in solubility of salt-soluble protein from chicken breast muscles during −1.5 °C and 4oC storage. Values are means ± standard deviations (n = 3). Different lower-case letters above the bars of standard deviations indicate significant differences among the samples at the same storage temperature for different time (p < .05). Different capital letters above the bars of standard deviations indicate significant differences among the samples at different storage temperature for the same time (p < .05).
Figura 1. Cambio en la solubilidad de la proteína soluble en sal de los músculos de la pechuga de pollo durante su almacenamiento a −1.5°C y 4°C. Los valores son medias ± desviaciones estándar (n = 3). Las distintas letras minúsculas sobre las barras de desviación estándar indican diferencias significativas entre las muestras a la misma temperatura de almacenamiento durante un tiempo diferente (p < .05). Las distintas letras mayúsculas sobre las barras de desviación estándar indican diferencias significativas entre las muestras a diferente temperatura de almacenamiento durante el mismo tiempo (p < .05)
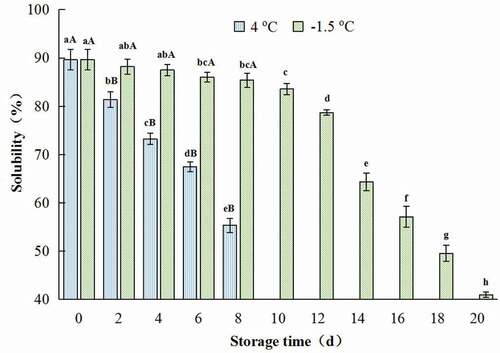
After being stored at 4oC for only 2 days, the solubility value of CSSP was 81.4%, which was significantly lower than that of the control (the muscle was fresh) (the value was 89.64%) (p < .05) (). Additionally, protein solubility of chicken breast muscles stored at 4oC was much lower than those of −1.5oC storage for the same time (p < .05) (). The decrease of solubility may be due to the oxidative denaturation of protein, and the increase in hydrophobicity. Similar results were described by L. Guo et al. (Citation2021), and Herrera and Mackie (Citation2004). In addition, as storage time prolonged, the decrease in the sulfhydryl group content of protein and the formation of disulfide bond could promote the decline of protein solubility (Hu, Citation2012).
3.1.2. Surface hydrophobicity
The surface hydrophobicity of protein represents the relative content of hydrophobic amino acids on the protein surface, and also reflects the degree of protein structure expansion (Q. Liu et al., Citation2014). For one kind of protein, if the surface hydrophobicity increased, it meant its denaturation degree rose.
The surface hydrophobicity of CSSP increased with the extension of storage time. Compared with the control, the surface hydrophobicity value of sample stored at 4°C for 8 days increased by 58.3%, while the value treated at −1.5oC for the same days increased by only 22.3% (). Similar result was reported by X. P. Li et al. (Citation2014), Qin et al. (Citation2020), and Qiu (Citation2020). The exposure of hydrophobic amino acid residues could be attributed to the increase in surface hydrophobicity of protein (Chamba et al., Citation2014). Non-disulfide bond cross-linked with the disulfide bond (-S-S-) being generated by the change of total sulfhydryl group, this may result in the increase in hydrophobic groups in protein.
Figure 2. Change in surface hydrophobicity of salt-soluble protein from chicken breast muscles during −1.5 °C and 4oC storage. Values are means ± standard deviations (n = 3). Different lower-case letters above the bars of standard deviations indicate significant differences among the samples at the same storage temperature for different time (p < .05). Different capital letters above the bars of standard deviations indicate significant differences among the samples at different storage temperature for the same time (p < .05).
Figura 2. Cambio en la hidrofobicidad superficial de la proteína soluble en sal de los músculos de la pechuga de pollo durante su almacenamiento a −1.5°C y 4°C. Los valores son medias ± desviaciones estándar (n = 3). Las distintas letras minúsculas sobre las barras de desviación estándar indican diferencias significativas entre las muestras a la misma temperatura de almacenamiento durante un tiempo diferente (p < .05). Las distintas letras mayúsculas sobre las barras de desviación estándar indican diferencias significativas entre las muestras a diferente temperatura de almacenamiento durante el mismo tiempo (p < .05)
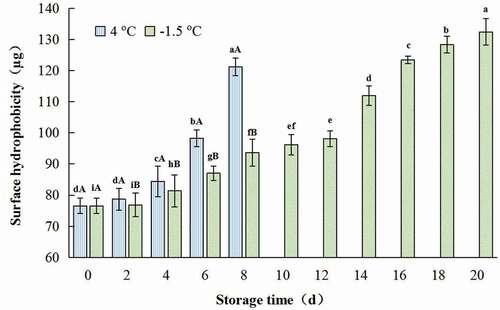
Additionally, surface hydrophobicity of sample rose slowly at −1.5°C for less than 12 days, and then rapidly declined until the end of the storage (). This suggested that the release of hydrophobic amino acid residues increased remarkably after being stored for more than 12 days at ice-temperature storage.
Being stored for the same time, the value of surface hydrophobicity of samples stored at 4oC was obviously higher than those treated at −1.5oC (). This indicated that ice-temperature storage could better stabilize the conformation of protein, slow down the denaturation rate of protein and maintain the integrity of protein. Similar results were reported by Q. Liu et al. (Citation2014), and Qiu (Citation2020).
3.1.3. The content of sulfhydryl group and disulfide bond
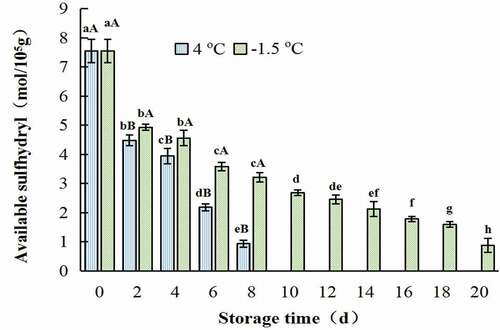
Sulfhydryl group is the key part of protein molecular active-group, and its content has great influence on the properties of protein. Disulfide bonds could play an important role in stabilizing the spatial structure of protein and maintaining certain active functions (Song & Li, Citation2002).
As was presented in , during the storage of both refrigerated and ice temperature, the content of total sulfhydryl group and available sulfhydryl group decreased gradually. It was interesting that both the higher the temperature and the longer the storage time was, the faster sulfhydryl group content decreased. The contents of total and active sulfhydryl groups in the control were 9.71, 7.55 mol/105g, respectively. And these values of the samples treated at 4°C for 8 days were 4.34, and 0.93 mol/105g, respectively. While, these values of the samples stored at −1.5oC for 18 days were only 4.32, and 1.59 mol/105g, respectively (). Similar results were reported by Kong et al. (Citation2016), X. P. Li et al. (Citation2014), Qin et al. (Citation2020), and Qin et al. (Citation2020) reported that the content of sulfhydryl group of white-hair rough shrimps decreased during the whole storage period at −1oC, and the decreasing speed of ice temperature was about one times slower than that of refrigerated storage. X. P. Li et al. (Citation2014) found that the content of sulfhydryl group of actin decreased most slowly when Chinese shrimp (Fenneropenaeus Chinensis) was stored at −2oC. The difference in sulfhydryl content in samples stored at different temperatures was due to the oxidation of sulfhydryl group in myofibrillar protein (Kong et al., Citation2016). The decrease in total sulfhydryl content indicated that myofibrillar proteins of CSSP were continuously oxidized, which might be due to the myosin aggregation caused by low temperature (Ramiarez et al., Citation2000).
Figure 3. Change in total sulfhydryl group of salt-soluble protein from chicken breast muscles during −1.5 °C and 4oC storage. Values are means ± standard deviations (n = 3). Different lower-case letters above the bars of standard deviations indicate significant differences among the samples at the same storage temperature for different time (p < .05). Different capital letters above the bars of standard deviations indicate significant differences among the samples at different storage temperature for the same time (p < .05).
Figura 3. Cambio en el grupo sulfhidrilo total de la proteína soluble en sal de los músculos de la pechuga de pollo durante su almacenamiento a −1.5°C y 4°C. Los valores son medias ± desviaciones estándar (n = 3). Las distintas letras minúsculas sobre las barras de desviación estándar indican diferencias significativas entre las muestras a la misma temperatura de almacenamiento durante un tiempo diferente (p < .05). Las distintas letras mayúsculas sobre las barras de desviación estándar indican diferencias significativas entre las muestras a diferente temperatura de almacenamiento durante el mismo tiempo (p < .05)
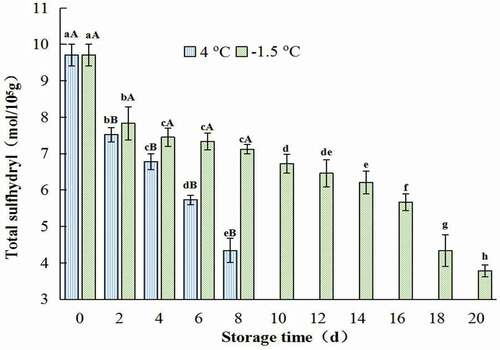
Figure 4. Change in available sulfhydryl group of salt-soluble protein from chicken breast muscles during −1.5 °C and 4oC storage. Values are means ± standard deviations (n = 3). Different lower-case letters above the bars of standard deviations indicate significant differences among the samples at the same storage temperature for different time (p < .05). Different capital letters above the bars of standard deviations indicate significant differences among the samples at different storage temperature for the same time (p < .05).
Figura 4. Cambio en el grupo sulfhidrilo disponible de la proteína soluble en sal de los músculos de la pechuga de pollo durante su almacenamiento a −1.5°C y 4°C. Los valores son medias ± desviaciones estándar (n = 3). Las distintas letras minúsculas sobre las barras de desviación estándar indican diferencias significativas entre las muestras a la misma temperatura de almacenamiento durante un tiempo diferente (p < .05). Las distintas letras mayúsculas sobre las barras de desviación estándar indican diferencias significativas entre las muestras a diferente temperatura de almacenamiento durante el mismo tiempo (p < .05)
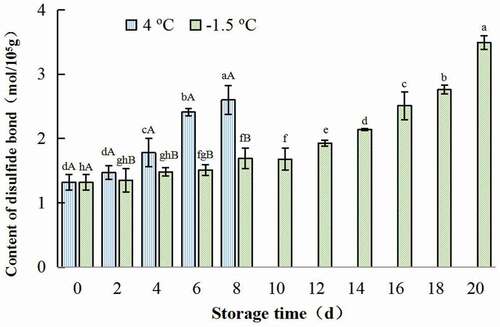
Additionally, the content of disulfide bond increased along with the prolonging of storage. The disulfide bond content of sample treated at 4oC rose much quickly, while the value of ice temperature-treated samples increased slowly (). This indicated that, compared with refrigerated storage, ice-temperature could protect protein from oxidation, reduce denaturation of protein and prolong the shelf life of chicken meat. Similar result was found by Qiu (Citation2020).
Figure 5. Change in disulfide bond content of salt-soluble protein from chicken breast muscles during −1.5 °C and 4oC storage. Values are means ± standard deviations (n = 3). Different lower-case letters above the bars of standard deviations indicate significant differences among the samples at the same storage temperature for different time (p < .05). Different capital letters above the bars of standard deviations indicate significant differences among the samples at different storage temperature for the same time (p < .05).
Figura 5. Cambio en el contenido de la unión de disulfuro de la proteína soluble en sal de los músculos de la pechuga de pollo durante su almacenamiento a −1.5°C y 4°C. Los valores son medias ± desviaciones estándar (n = 3). Las distintas letras minúsculas sobre las barras de desviación estándar indican diferencias significativas entre las muestras a la misma temperatura de almacenamiento durante un tiempo diferente (p < .05). Las distintas letras mayúsculas sobre las barras de desviación estándar indican diferencias significativas entre las muestras a diferente temperatura de almacenamiento durante el mismo tiempo (p < .05)
3.1.4. SDS-PAGE
The myosin in salt-soluble protein consists of two heavy chains (their molecular weight is about 200 kDa) and four light chain (their molecular weight is among of 16 and 30 kDa) (Y. Liu et al., Citation2016). Generally speaking, the main form of protein oxidation is protein aggregation or degradation into fragments (Xue, Citation2012).
Results of SDS-PAGE of CSSP during −1.5°C and 4oC storage are presented in . Myosin, actin and troponin were degraded into different degrees during storage. In the early stage of storage at 4oC, myosin heavy chain (MHC, 220 kDa), actin (40–60 kDa) and troponin (30–37 kDa) aggregated, and their molecular weight increased, the color of the band became darker. During the later period of storage, macromolecular proteins were degraded into the smaller ones, and the bands became lighter, which may be due to the oxidative denaturation of proteins. Meanwhile, under both the ice-temperature and refrigerated conditions, myosin light chain (16–30 kDa) degraded gradually or even disappeared (). Similar results were reported by Shao et al. (Citation2016), and Yan et al. (Citation2015).
Figure 6. SDS-PAGE patterns of salt-soluble protein from chicken breast muscles stored at 4oC and −1.5oC for 8 days and 20 days, respectively.
Figura 6 Patrones de SDS-PAGE de la proteína soluble en sal de los músculos de la pechuga de pollo almacenados a 4°C y a −1.5°C durante ocho y 20 días, respectivamente
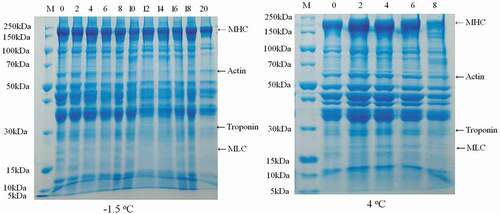
Additionally, during the storage, myosin of samples stored at 4oC degraded faster than that stored at −1.5oC (). This was likely due to the fact that the activity of cathepsin B and B + L under 4oC conditions was much higher than that at −1.5oC storage. Similar result was reported by Qiu (Citation2020).
No new bands of SDS-PAGE of CSSP were observed under both storage conditions. Similar result was reported by Qiu (Citation2020).
3.2. Change in gel properties of chicken breast muscles during ice-temperature and refrigerated storage
3.2.1. Water holding capacity (WHC) and cooking loss (CL)
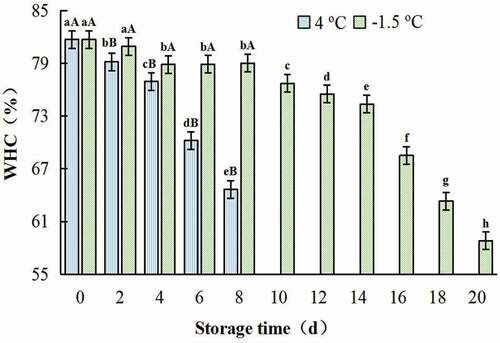
WHC is one of the most important functional properties of protein gelation. The gels WHC of chicken meat decreased under both 4oC and −1.5oC storage along with the storage time. The WHC of gel decreased slowly in the earliest of ice temperature storage, while their value decreased greatly during the whole period of 4oC storage. Compared with the value of the control, the WHC of gel of samples treated at −1.5oC and 4°C for 8 days decreased by 3.29% and 20.88%, respectively. While, the value of gel of samples stored at −1.5°C for 16 days only reduced to 16.16% (). The decrease of protein solubility was closely related to the decline of the WHC.
Figure 7. Change in WHC of gel prepared with chicken breast muscles during 4oC and −1.5oC storage. Values are means ± standard deviations (n = 3). Different lower-case letters above the bars of standard deviations indicate significant differences among the samples at the same storage temperature for different time (p < .05). Different capital letters above the bars of standard deviations indicate significant differences among the samples at different storage temperature for the same time (p < .05).
Figura 7. Cambio en el WHC del gel preparado con músculos de pechuga de pollo durante el almacenamiento a 4°C y a −1.5°C. Los valores son medias ± desviaciones estándar (n = 3). Las distintas letras minúsculas sobre las barras de desviación estándar indican diferencias significativas entre las muestras a la misma temperatura de almacenamiento durante un tiempo diferente (p < .05). Las distintas letras mayúsculas sobre las barras de desviación estándar indican diferencias significativas entre las muestras a diferente temperatura de almacenamiento durante el mismo tiempo (p < .05)
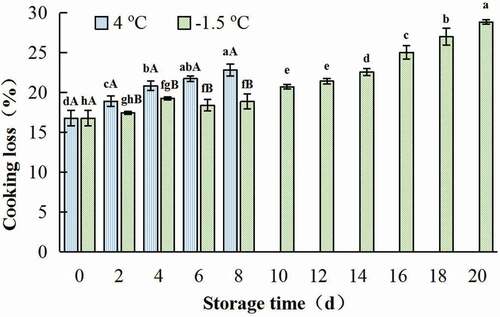
Cooking loss (CL) rose with the prolonging of storage time at both 4oC and −1.5°C storage. The CL of gel of samples treated at 4oC for 8 days was 22.81%, which was 1.36 times of the control. While, CL of gels made from the sample at −1.5°C for 20 days was only 1.72 times of the control. Additionally, CL of gel from ice temperature treated samples increased rapidly after being stored for 14 days (p < .05) (). The destruction of muscle cell membrane during the storage could result into the higher CL.
Figure 8. Change in cooking loss of gel prepared with chicken breast muscles during 4oC and −1.5oC storage. Values are means ± standard deviations (n = 3). Different lower-case letters above the bars of standard deviations indicate significant differences among the samples at the same storage temperature for different time (p < .05). Different capital letters above the bars of standard deviations indicate significant differences among the samples at different storage temperature for the same time (p < .05).
Figura 8. Cambio en la pérdida durante la cocción del gel preparado con músculos de pechuga de pollo durante su almacenamiento a 4°C y −1.5°C. Los valores son medias ± desviaciones estándar (n = 3). Las distintas letras minúsculas sobre las barras de desviación estándar indican diferencias significativas entre las muestras a la misma temperatura de almacenamiento durante un tiempo diferente (p < .05). Las distintas letras mayúsculas sobre las barras de desviación estándar indican diferencias significativas entre las muestras a diferente temperatura de almacenamiento durante el mismo tiempo (p < .05)
3.2.2. Texture
When chicken breast muscles were stored at −1.5oC and 4oC for 2 days, the hardness of the obtained gel rose to 6313 g, and 6979 g, respectively. These values were much higher than those of the control (p < .05) (). This may be due to the hydrolysis of protein, which could make the cell structure loose, the water inside the cell diffused to the outside of the cell, and the juice loss rate of meat increased. Being stored at −1.5oC and 4oC for up to 4 days, the hardness of chicken gel decreased (). This may be related to the fact that during the process of meat aging, actin was separated from myofibrillar protein, and the structure of sarcoplasmic reticulum surrounding myofibrillar proteins collapsed, the soluble sarcoplasmic protein was broken down, and the tenderness of meat was improved. With the prolonging of storage time, the hardness of chicken gel gradually increased. The value of hardness of gel prepared with chicken meat stored at 4oC for 8 days was 7751, which was 1.38 times of the control. While, the value of hardness of gel prepared with chicken meat stored at −1.5oC for 20 days was 1.43 times of the control (). This might be due to the rapid proliferation of microorganisms, which further accelerated the hydrolysis of protein and destruction speed of cell, and resulted in increase in the loss rate of juice. Additionally, the cross-linking of disulfide bond could be attributed to the increase in hardness of gel. The gel hardness of chicken stored at −1.5oC was always lower than that stored at 4oC for the same time. This indicated that ice-temperature storage could maintain the lower activity of protease, and inhibit the oxidation of protein to a certain extent.
Table 1. Changes in texture of gel prepared with chicken breast muscles during 4oC and −1.5oC storage.
Tabla 1. Cambios en la textura del gel preparado con músculos de pechuga de pollo durante su almacenamiento a 4°C y −1.5°C
The springiness of gel reflects its ability to recover deformation. During the storage for 4 days at 4oC or 10 days at −1.5oC, there was no significant change in the springiness of gel. The value of gel from chicken meat stored at −1.5oC was higher than those treated at 4oC for the same time. The springiness of chicken gel decreased significantly at 4oC for more than 4 days (p < .05). Compared with the springiness value of the control, the value of gel obtained with the sample treated for 8 days at 4oC declined by 7.54%. Being stored at −1.5oC, springiness of chicken gel decreased slowly during storage for 2 to 12 days (p > .05), and then declined rapidly when storage time was longer than 12 days (p < .05). Compared to the control, the springiness value of gel prepared with the sample at −1.5oC for 14 days decreased only by 5.43%. This indicated that ice temperature storage was better for maintaining the springiness of chicken gel. The reason for the decrease in gel springiness at different storage temperatures may be related to protein denaturation, and destruction of cell structure (Fei et al., Citation2010; Y. Li et al., Citation2013).
3.2.3. The storage modulus (G’)
The storage modulus (G’) could not only reflect the dynamic process of the unfolding and aggregation of protein molecules during heating, but also indicated the changes of gel strength and hardness (Kang et al., Citation2013). The G’ values of gel prepared with chicken breast muscles at ice-temperature and refrigerated storage were divided into three stages. In the early stage of heating (25–42oC), the decreases in G’ were relatively small. A possible explanation is that, in the process of mincing, the long chain of protein was broken and some proteins are dissolved, which leads to the folding of myofibrillar protein (Tornberg, Citation2005; Wang et al., Citation2018). With the increase in temperature (43–63°C), the G’ values dropped rapidly until to the minima. This may be due to that, with the increase in heating temperature, the denaturation of protein was accelerated, and the denaturation of the tail of myosin resulted in the destruction and breakage of its head, so that the original protein network structure was damaged. With further heating (64–85oC), the G’ values increased rapidly, and a complex and flexible structure of gel was formed (). The results were in agreement with previous reports (S. S. Li et al., Citation2020; Wang et al., Citation2018).
Figure 9. Changes in storage modulus (G’) of gel prepared with chicken breast muscles during 4oC and −1.5oC storage.
Figura 9. Cambios en el módulo de almacenamiento (G’) del gel preparado con músculos de pechuga de pollo durante su almacenamiento a 4°C y −1.5°C
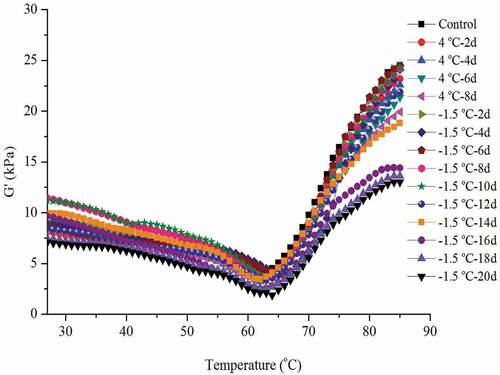
The G’ value of the prepared gel changed slightly when chicken breast muscles were stored at 4oC and −1.5oC for up to 4 and 10 days, respectively. When the storage time was above 4 days at 4oC or longer than 10 days at −1.5oC, the G’ value of the obtained gel declined greatly. This indicated that gel quality began to deteriorate after being stored at −1.5oC for 12 days or at 4oC for 4 days.
Being stored for 8 days, the G’83◦C values of gel made with ice temperature and refrigeration stored samples were 24.19 kPa, and 19.93 kPa, respectively. And the G’83◦C value of gel was 18.83 kPa when chicken meat was stored at ice temperature for 14 days. Being stored at 4oC and −1.5oC for the same time, the G’85◦C value of the gel made with ice-temperature treated chicken meat was much higher than that of the refrigerated storage (). This indicated that compared with refrigeration storage, ice temperature storage could better maintain the formation capacity of meat gel.
3.2.4. Water migration of chicken gel
The spin-spin relaxation time (T2) measured by low field NMR could reflect water distribution and migration of gel system (C. B. Li et al., Citation2012). The shorter the T2, the more tightly the water was bound to the substrate. On the contrary, the longer the T2, the much free the water was (Han et al., Citation2009).
The T2 of gel prepared with chicken breast muscles stored at 4oC during the storage time changed greatly (p < .05). While, when chicken breast meat was stored at −1.5oC for 0 to 6 days, the T2 of gel varied slowly. When the storage time was longer than 12 days at −1.5oC, T2 of the obtained gel varied greatly. Additionally, the T2 of gel obtained with chicken meat, which was stored at −1.5oC for 20 days, was much shorter than that stored at 4oC for 8 days (). The prolongation of T2 might be due to the decrease in salt solubility and sulfhydryl content of chicken myofibrillar protein, and the exposure of hydrophobic groups, which were caused by the increase in storage time.
Table 2. Changes in relaxation time T2, moisture state and content of gel prepared with chicken breast muscles stored at 4oC and −1.5oC.
Tabla 2. Cambios en el tiempo de relajación T2, estado de humedad y contenido del gel preparado con músculos de pechuga de pollo almacenados a 4°C y −1.5°C
The peak area represented the percentage of each of three kinds of water. With the increase in storage time, the value of pT2b of gel prepared with chicken breast stored under the two conditions was always in the range of 0.66% to 0.79%. Additionally, there was no significant difference in pT2b value of gel prepared with stored chicken meat at 4oC and −1.5oC (p > .05). These indicated that free water was the main form of water in chicken meat gel. pT 21 of gel decreased along with storage time. And pT 21 value of gel decreased to 57.34% when chicken meat was stored at 4oC for 8 days, while the value only decreased to 62.97% when chicken meat was treated for 20 days at −1.5oC. Additionally, pT22 increased gradually. pT 22 value rose to 42.03% when chicken meat was stored at 4oC for 8 days, while the value increased to 36.3% when chicken meat was treated for 20 days at −1.5oC. These results indicated that ice storage could make water and protein to bind more tightly in chicken gel.
3.2.5. Microstructure of gel
Microstructure of gel is an important index of functional properties (Lei et al., Citation2016). The gel with uniform, continuous and porous microstructure was considered to have higher WHC and strength (Han et al., Citation2014). SEM revealed the variations in the appearance of gel in the control and stored chicken breast muscles. The uniform three-dimensional network structures with small cavities were observed in the control (). With the prolonging of storage time, the gel from chicken meat stored at −1.5oC and 4oC showed much coarse three-dimensional network structures having an increased number of irregular and large cavities compared to control. This could be accounted for the decline of WHC of gel prepared with the samples during 4oC and −1.5oC storage.
Figure 10. Microstructure of gel prepared with chicken breast muscles during ice-temperature and refrigerated storage.
Figura 10. Microestructura del gel preparado con músculos de pechuga de pollo durante su almacenamiento a temperatura de hielo y refrigerado
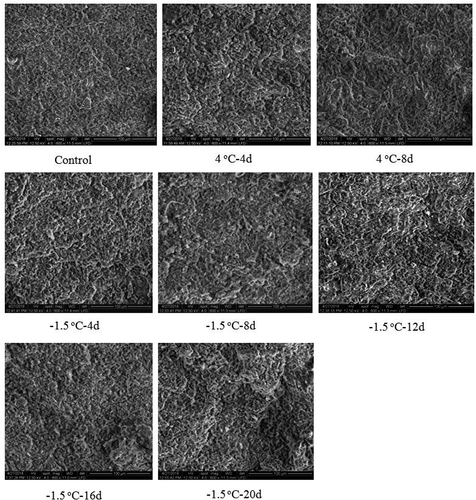
Compared with the gel obtained with chicken breast muscles stored at 4oC for the same time, the gel prepared with −1.5oC stored samples displayed the more uniform three-dimensional network structures with smaller-sized pores ().
4. Conclusions
With the prolonging of storage time under both −1.5oC and 4oC conditions, the solubility, total sulfhydryl and active sulfhydryl content of CSSP gradually decreased. While, the declined degree of these values in −1.5oC storage was much lower than that in 4oC storage. Compared with the control, the content of disulfide bond and surface hydrophobicity of CSSP stored at 4oC for 8 days increased by 63.5%, and 58.3% respectively, while these values of CSSP under −1.5°C for the same days rose only by 28.0% and 22.3%, respectively. The changes in structure and functional properties of CSSP could be effectively delayed by ice-temperature storage.
Under both 4oC and −1.5oC storage, WHC of gel prepared with the stored samples declined while the cooking loss rose. The springiness of gel decreased significantly at 4oC for more than 4 days (p < .05), while these values of gel prepared with samples at −1.5oC for 14 days decreased only by 5.43%. Compared with the quality of gel from 4°C stored samples, the gel prepared with −1.5oC stored samples had much higher WHC, lower cooking loss, better springiness, and more uniform network structures with smaller-sized pores. Additionally, the pT21 of non-flow water of gel declined while the pT22 of flow water went up. The quality of gel obtained with chicken meat in ice-temperature storage was much better than that in refrigerated storage. Results could provide scientific basis for the application of ice-temperature storage in the field of chicken meat for prolonging the shelf-life and improving the quality of chicken.
Disclosure of potential conflicts of interest
No potential conflict of interest was reported by the authors.
Ethical approval
This article does not contain any studies with human participants or animals performed by any of the authors.
Additional information
Funding
References
- Chamba, M. V. M., Huay, F., & Katiyo, W. (2014). Oxidation and structural modification of full-fat and defatted flour based soy protein isolates induced by natural and synthetic extraction chemicals. Food Biophysics, 9(3), 193–202. https://doi.org/https://doi.org/10.1007/s11483-014-9333-8
- Chen, X., Li, P. J., Nishiumi, T., Takumi, H., Suzuki, A., & Chen, C. G. (2014). Effects of high pressure processing on the cooking loss and gel strength of chicken breast actomyosin containing sodium alginate. Food and Bioprocess Technology, 7(12), 3608–3617. https://doi.org/https://doi.org/10.1007/s11947-014-1368-9
- Chen, X., Xu, X., Liu, D., Zhou, G., Han, M., & Wang, P. (2018). Rheological behavior, conformational changes and interactions of water-soluble myofibrillar protein during heating. Food Hydrocolloids, 77, 524–533. https://doi.org/https://doi.org/10.1016/j.foodhyd.2017.10.030
- Choi, Y. S., Choi, J. H., Han, D. J., Kim, H. Y., Lee, M. A., Kim, H. W., Jeong, J. Y., & Kim, C. J. (2011). Effects of rice bran fiber on heat-induced gel prepared with pork salt-soluble meat proteins in model system. Meat Science, 88(1), 59–66. https://doi.org/https://doi.org/10.1016/j.meatsci.2010.12.003
- Fei, Y., Han, M., Yang, L., Zhou, G., Xu, X., & Peng, Z. (2010). Studies on the secondary structure and heat-induced gelation of pork myofibrillar proteins as affected by pH. Scientia Agricultura Sinica, 43(1), 164–170. https://doi.org/https://doi.org/10.3864/j.issn.0578-1752.2010.01.019
- Feng, T., Sun, J. X., Wu, Z., Xu, X. L., Wang, S. L., Li, P., & Xia, M. (2015). Effects of peanut protein concentrate on heat-induced gel properties of chicken breast muscle salt-soluble proteins. Modern Food Science and Technology, 31(10), 97–102. https://doi.org/https://doi.org/10.13982/j.mfst.1673-9078.2015.10.017
- Gao, X. Q., Hao, X. Z., Xiong, G. Y., Ge, Q. F., Hang, W. G., Zhou, G. H., & Yue, X. B. (2016). Interaction between carrageenan/soy protein isolates and salt-soluble meat protein. Food and Bioproducts Processing, 100, 47–53. https://doi.org/https://doi.org/10.1016/j.fbp.2016.06.014
- Ge, Q., Tang, X., Fan, Y., Jia, X., Gu, R., Wang, J., & Gao, Y. (2019). Changes of muscle textural properties of yellow-feather broilers muscle during ice-temperature storage. China Poultry, 41(22), 37–40. https://doi.org/https://doi.org/10.16372/j.issn.1004-6364.2019.22.008
- Gornall, A. G., Bardawill, C. J., & David, M. M. (1949). Determination of serum proteins by means of the biuret reaction. Journal of Biological Chemistry, 177(2), 751–766. https://doi.org/https://doi.org/10.1016/S0021-9258(18)57021-6
- Guo, L., Wu, X., Yan, Y., & Shen, Z. (2021). Effect of rye polyphenol on functional properties of loach myofibrillar protein during storage. Science and Technology of Food Industry, 41(1), 312–316. https://kns.cnki.net/kcms/detail/11.1759.TS.20200715.1537.024.html
- Guo, S., Zhao, G., Wang, Y., Zhang, C., & Hao, H. (2008). Effects of ionic strength and pH values on the characteristics of heat- induced gelation of myofibrillar proteins. Food Science and Technology, 1, 84–87. https://doi.org/https://doi.org/10.3969/j.issn.1005-9989.2008.01.023
- Guo, X. Y., Peng, Z. Q., Zhang, Y. W., Liu, B., & Cui, Y. Q. (2015). The solubility and conformational characteristics of porcine myosin as affected by the presence of L-lysine and L-histidine. Food Chemistry, 170, 212–217. https://doi.org/https://doi.org/10.1016/j.foodchem.2014.08.045
- Han, M., Fei, Y., Xu, X., & Zhou, G. (2009). Heat-induced gelation of myofibrillar proteins as affected by pH-a low field NMR study. Scientia Agricultura Sinica, 42(6), 2098–2104. https://doi.org/https://doi.org/10.3864/j.issn.0578-1752.2009.06.028
- Han, M., Wang, P., Xu, X., & Zhou, G. (2014). Low-field NMR study of heat-induced gelation of pork myofibrillar proteins and its relationship with microstructural characteristics. Food Research International, 62, 1175–1182. https://doi.org/https://doi.org/10.1016/j.foodres.2014.05.062
- Henchion, M., McCarthy, M., Resconi, V. C., & Troy, D. (2014). Meat consumption: Trends and quality matters. Meat Science, 98(3), 561–568. https://doi.org/https://doi.org/10.1016/j.meatsci.2014.06.007
- Herrera, J. R., & Mackie, I. M. (2004). Cryoprotection of frozen-stored actomyosin of farmed rainbow trout (Oncorhynchus mykiss) by some sugars and polyols. Food Chemistry, 84(1), 91–97. https://doi.org/https://doi.org/10.1016/S0308-8146(03)00178-X
- Hu, Y., Zhang, W., Chen, G., Chen, H., & Tao, S. (2018). Public health risk of trace metals in fresh chicken meat products on the food markets of a major production region in southern China. Environmental Pollution, 2018(234), 667–676. https://doi.org/https://doi.org/10.1016/j.envpol.2017.12.006
- Hu, Z. (2012). Effect of protein oxidation on heat-induced gel and physicochemical properties of chicken breast myofibrillar proteins [Master’s thesis]. Nanjing Agricultural University. http://www.cnki.net
- Ingrid, C. C. (2011). Superchilling concepts enabling safe, high quality and long term storage of foods. Procedia Food Science, 1, 1907–1909. https://doi.org/https://doi.org/10.1016/j.profoo.2011.09.280
- Ji, H., Li, S., Zhang, L., Wu, S., Han, X., Chen, F., & Ma, H. (2020). Effect of gluten on quality properties and water migration of heat-induced gel from pork. Food Science, 41(18), 58–63. https://doi.org/https://doi.org/10.7506/spkx1002-6630-20190911-140
- Kang, Z. L., Li, B., Ma, H. J., & Chen, F. S. (2016). Effect of different processing methods and salt content on the physicochemical and rheological properties of meat batters. International Journal of Food Properties, 19(7), 1604–1615. https://doi.org/https://doi.org/10.1080/10942912.2015.1105819
- Kang, Z. L., Zou, Y. F., Xu, X. L., Zhu, C. Z., Wang, P., & Zhou, G. H. (2013). Effect of various amounts of pork and chicken meat on the sensory and physicochemical properties of Chinese-style meatball (Kung-wan). Food Science and Technology Research, 19(6), 963–970. https://doi.org/https://doi.org/10.3136/fstr.19.963
- Kong, C., Wang, H., Li, D., Zhang, Y., Pan, J., Zhu, B., & Luo, Y. (2016). Quality changes and predictive models of radial basis function neural networks for brined common carp (Cyprinus carpio) fillets during frozen storage. Food Chemistry, 201, 327–333. https://doi.org/https://doi.org/10.1016/j.foodchem.2016.01.088
- Laemmli, U. K. (1970). Cleavage of structural proteins during the assembly of the head of bacteriophage T4. Nature, 227(5259), 680–685. https://doi.org/https://doi.org/10.1038/227680a0
- Lei, Z., Fu, Y., Xu, P., Zheng, Y., & Zhou, C. (2016). Effects of L-arginine on the physicochemical and gel properties of chicken actomyosin. International Journal of Biological Macromolecules, 92, 1258–1265. https://doi.org/https://doi.org/10.1016/j.ijbiomac.2016.08.040
- Li, C. B., Liu, D. Y., Zhou, G. H., Xu, X. L., Qi, J., Shi, P. L., & Xia, T. T. (2012). Meat quality and cooking attributes of thawed pork with different low field NMR T21. Meat Science, 92(2), 79–83. https://doi.org/https://doi.org/10.1016/j.meatsci.2011.11.015
- Li, K., Liu, J. Y., Fu, L., Zhao, Y. Y., & Bai, Y. H. (2019). Comparative study of thermal gelation properties and molecular forces of actomyosin extracted from normal and pale, soft and exudative-like chicken breast meat. Asian-Australasian Journal of Animal Sciences, 32(5), 721–733. https://doi.org/https://doi.org/10.5713/ajas.18.0389
- Li, S., Ji, H., Zhang, L., Wu, S., Han, X., Chen, F., & Ma, H. (2019). Changes in quality and microstructure of chicken during ice-temperature storage. Food and Fermentation Industries, 45(16), 201–207. https://doi.org/https://doi.org/10.13995/j.cnki.11-1802/ts.020553
- Li, S. S., Ji, H. F., Zhang, L. W., Han, X. P., Chen, F. S., Ma, H. J., Wu, T. C., & Wang, Y. B. (2020). Effect of gluten protein on quality properties of heat-induced gel of chicken. Food and Fermentation Industries, 46(7), 142–147. https://doi.org/https://doi.org/10.13995/j.cnki.11-1802/ts.022254
- Li, X. P., Chen, Y., Wang, J. X., Yi, S. M., Xu, Y. X., Wang, Y. B., & Li, J. R. (2014). Changes in muscle structure and biochemical characteristics of muscle proteins in Chinese shrimp (Fenneropenaeus Chinensis) during refrigerated storage. Journal of Chinese Institute of Food Science and Technology, 14(5), 72–79. https://doi.org/https://doi.org/10.1007/s10661-009-1074-7
- Li, Y., Li, X., Zhang, C. H., Sun, H. M., & Dong, X. B. (2013). Oxidation and decrease of gelling properties for meat myofibrillar protein induced by hydroxyl radical. Transactions of the Chinese Society of Agricultural Engineering, 29(12), 286–292. https://doi.org/https://doi.org/10.3969/j.issn.1002-6819.2013.12.036
- Liu, Q., Chen, Q., Kong, B., Han, J., & He, X. (2014). The influence of superchilling and cryoprotectants on protein oxidation and structural changes in the myofibrillar proteins of common carp (Cyprinus carpio) surimi. LWT-Food Science and Technology, 57(2), 603–611. https://doi.org/https://doi.org/10.1016/j.lwt.2014.02.023
- Liu, Y., Xie., L., Ding, L., Zhang, H., Gong, L., Wang, J., & Jiang, G. (2016). Effect of wheat dietary fibers on functional properties of pork myofibrillar protein gels. Food Science, 37(19), 15–23. https://doi.org/https://doi.org/10.7506/spkx1002-6630-201619003
- Ma, F., Chen, C., Sun, G., Wang, W., Fang, H., & Han, Z. (2012). Effects of high pressure and CaCl2 on properties of salt-soluble meat protein gels containing locust bean gum. Innovative Food Science & Emerging Technologies, 14, 31–37. https://doi.org/https://doi.org/10.1016/j.ifset.2011.12.001
- Mehta, N. K., Elavarasan, K., Reddy, A. M., & Shamasundar, B. A. (2014). Effect of ice storage on the functional properties of proteins from a few species of fresh water fish (Indian major carps) with special emphasis on gel forming ability. Journal of Food Science and Technology, 51(4), 655–663. https://doi.org/https://doi.org/10.1007/s13197-011-0558-y
- Nguyen, M. V., Thorarinsdottir, K. A., Gudmundsdottir, A., Thorkelsson, G., & Arason, S. (2011). The effects of salt concentration on conformational changes in cod (Gadus morhua) proteins during brine salting. Food Chemistry, 125(3), 1013–1019. https://doi.org/https://doi.org/10.1016/j.foodchem.2010.09.109
- Özünlü, O., Ergezer, H., & Gökçe, R. (2018). Improving physicochemical, antioxidative and sensory quality of raw chicken meat by using acorn extracts. LWT - Food Science and Technology, 98, 477–484. https://doi.org/https://doi.org/10.1016/j.lwt.2018.09.007
- Qin, Q. S., Lim, S. M., Meng, F., Dong, Y., Mao, H. P., Zhang, Y. Q., & Dai, Z. Y. (2020). Effect of ice-temperature storage on freshness index and protein properties of white-hair rough shrimps. Packing Engineering, 41(17), 46–54. https://doi.org/https://doi.org/10.19554/j.cnki.1001-3563.2020.17.007
- Qiu, H. (2020). Effect of endogenous enzyme activity and quality change of northern pike (Esox lucius) in low temperature storage [Master’s thesis]. Shihezi University. http://www.cnki.net
- Ramiarez, J. A., Martian-Polo, M. O., & Bandman, E. (2000). Fish myosin aggregation as affected by freezing and initial physical state. Journal of Food Science, 65(4), 556–560. https://doi.org/https://doi.org/10.1111/j.1365-2621.2000.tb16047.x
- Sáyago-Ayerdi, S. G., Brenes, A., Viveros, A., & Goñia, I. (2009). Antioxidative effect of dietary grape pomace concentrate on lipid oxidation of chilled and long-term frozen stored chicken patties. Meat Science, 83(3), 528–533. https://doi.org/https://doi.org/10.1016/j.meatsci.2009.06.038
- Shao, Y., Wang, X., Xiong, G., Li, X., Wu, W., Qiao, Y., Ding, A., Liao, L., Wang, J., & Wang, L. (2016). Effect of different polysaccharides on the rheology of grass carp myofibrillar proteins during frozen storage. Food Science, 37(18), 304–312. https://doi.org/https://doi.org/10.7506/spkx1002-6630-201618048
- Song, J. N., & Li, W. J. (2002). Analysis of sequence features of disulfide-bonds in proteins. Journal of Wuxi University of Light Industry, 21(5), 464–467. https://doi.org/https://doi.org/10.1038/sj.cr.7290132
- Sun, T. L., Yue, X. Q., Zhang, P., Li, J. K., & Zhang, P. (2014). Effect of super chilling combined with modified atmosphere package on beef quality. Modern Food Science and Technology, 30(5), 239–244. https://doi.org/https://doi.org/10.13982/j.mfst.1673-9078.2014.05.041
- Sun, X. D., & Holley, R. A. (2011). Factors influencing gel formation by myofibrillar proteins in muscle foods. Comprehensive Reviews in Food Science and Food Safety, 10(1), 33–51. https://doi.org/https://doi.org/10.1111/j.1541-4337.2010.00137.x
- Tornberg, E. (2005). Effect of heat on meat proteins-implication on structure and quality of meat products. Meat Science, 70(3), 493–508. https://doi.org/https://doi.org/10.1016/j.meatsci.2004.11.021
- Wang, X., Li, K., Huang, Q., He, D., An, F., Xu, Z., & Fu, L. (2018). Effect of Eucheuma spinosum on gelation and rheological properties of chicken breast batters. Food Science, 39(5), 76–80. https://doi.org/https://doi.org/10.7506/spkx1002-6630-201805012
- Wattanachant, S., Benjakul, S., & Ledward, D. A. (2005). Effect of heat treatment on changes in texture, structure and properties of Thai indigenous chicken muscle. Food Chemistry, 93(2), 337–348. https://doi.org/https://doi.org/10.1016/j.foodchem.2004.09.032
- Xia, M., Chen, Y., Guo, J., Huang, H., Wang, L., Wu, W., Xiong, G., & Sun, W. (2019). Water distribution and textual properties of heat-induced pork myofibrillar protein gel as affected by sarcoplasmic protein. LWT-Food Science and Technology, 10, 308–315. https://doi.org/https://doi.org/10.1016/j.lwt.2019.01.009
- Xin, X., Zheng, M., Wen, J., & Wang, J. (2020). Situation analysis, future prospect, countermeasures and suggestions of broiler industry in 2019. Chinese Journal of Animal Science, 56(3), 155–159. https://doi.org/https://doi.org/10.19556/j.0258-7033.20200217-07
- Xu, L., Guan, W., Zhao, F., & Jing, H. (2015). Quality properties of chicken breasts during ice temperature storage. Food Science and Technology, 40(11), 96–102. https://doi.org/https://doi.org/10.13684/j.cnki.spkj.2015.11.020
- Xue, M. (2012). Effects of protein oxidation on myofibrillar protein degradation and eating quality of beef during ripening [Master’s thesis]. Nanjing Agricultural University. http://www.cnki.net
- Yan, L., Tang, S., Wang, L., Li, S., Bai, J., Lu, F., & Shui, X. (2015). Oxidation-induced changes of myofibrillar protein structure of yak muscles during frozen storage. Food Science, 36(24), 337–342. https://doi.org/https://doi.org/10.7506/spkx1002-6630-201524062
- Zhuang, X., Han, M., Bai, Y., Liu, Y., Xing, L., Xu, X. L., & Zhou, G. H. (2018). Insight into the mechanism of myofibrillar protein gel improved by insoluble dietary fiber. Food Hydrocolloids, 74, 219–226. https://doi.org/https://doi.org/10.1016/j.foodhyd.2017.08.015