
ABSTRACT
Four Tremella fuciformis polysaccharides (TPS) fractions named as TPS20, TPS40, TPS60, and TPS80 were obtained by stepwise ethanol precipitation. Their physicochemical and rheological properties were investigated. Results showed TPS60 had the highest contents of polysaccharide (81.12%), protein (0.29%), uronic acid (14.36%), and sulfate (5.92%). Their molecular weights were in a descending order of TPS20, TPS40, TPS60, and TPS80. In a certain range of shear rate, they all presented pseudoplastic fluid and viscosity characteristic at low frequency. Increasing temperature or concentration of salts decreased the viscosity of their solutions. Sucrose concentration less than 6% led to an increasing viscosity of TPS20, TPS40, and TPS60. Both strong acidity and alkalinity could reduce the viscosity of all TPS solutions. TPS80 solution showed the best stability and its viscosity was minimally affected by pH, temperature, salts, and sucrose. These results can provide theoretical references for utilizations of TPS fractions in foods, pharmaceuticals, and cosmetics.
RESUMEN
Para el presente estudio se obtuvieron, mediante precipitación por etapas en etanol, cuatro fracciones de polisacáridos de Tremella fuciformis (TPS) denominadas TPS20, TPS40, TPS60 y TPS80. Se investigaron sus propiedades fisicoquímicas y reológicas y los resultados dieron cuenta de que la TPS60 tiene el mayor contenido de polisacáridos (81.12%), proteínas (0.29%), ácido urónico (14.36%) y sulfato (5.92%). Además, se comprobó que sus pesos moleculares estaban en un orden descendente de TPS20, TPS40, TPS60 y TPS80, constatándose que, en un determinado rango de velocidad de cizallamiento, todas las fracciones presentaban un fluido pseudoplástico y una viscosidad característica a baja frecuencia. Asimismo, tanto el aumento de la temperatura como de la concentración de sales disminuyó la viscosidad de sus soluciones, en tanto que la concentración de sacarosa inferior a 6% provocó un incremento de la viscosidad de TPS20, TPS40 y TPS60. Aunque la acidez y la alcalinidad fuertes pueden reducir la viscosidad de todas las soluciones de TPS, la solución TPS80 presentó la mejor estabilidad y su viscosidad se vio mínimamente afectada por el pH, la temperatura, las sales y la sacarosa. En conclusión, estos resultados pueden proporcionar referencias teóricas para la utilización de fracciones de TPS en alimentos, productos farmacéuticos y cosméticos.
1. Introduction
Tremella fuciformis, commonly known as snow fungus, is an important food and medicinal ingredient in Asian countries. It contains polysaccharides, protein, minerals, and vitamins (Y. J. Wu et al., Citation2019), among which polysaccharides are its main bioactive component, accounting for more than 50% of its dry weight. Polysaccharides generated from Tremella fuciformis are named Tremella fuciformis polysaccharides (TPS), which have a (1→3) -α-mannan as the active center (Hu et al., Citation2019) and side chain composed of glucose, glucuronic acid, xylose, fucose, arabinose residues, and so on, showing an increasing application in foods, pharmaceutics, and cosmetics for its various bioactivities and high safety. As a food ingredient, TPS possess a variety of health functions such as immunomodulatory (Shi et al., Citation2014), anti-tumour (Chen, Citation2010), anti-oxidation (X. M. Wang et al., Citation2015), anti-aging (Shen et al., Citation2017), hypoglycemic effect (Reshetnikov et al., Citation2000) and so on.
As reported in the literature, many natural polysaccharides have been used as thickeners (Cho & Yoo, Citation2015), gelling agents (Danalache et al., Citation2015) or emulsifiers (García et al., Citation2015) due to their unique rheological properties under different conditions. TPS also has the thickening property and emulsion stability as a natural food ingredient in the processing of beverages and dairy products. By improving processing characteristics with TPS, the nutritional value and health effects of foods are promoted (Schmitt & Turgeon, Citation2011). In addition, TPS may have an extensive prospect in the processing of low-fat meat products because it can significantly enhances the gel hardness and water-holding capacity of myofibrillar protein gels (Y. K. Zhang et al., Citation2017). However, adding polysaccharides with different physicochemical and rheological properties into foods and cosmetics with complex composition and diverse texture will directly affect the mixing, forming and the quality of these products.
Currently, researches on TPS mainly focus on its extraction, purification, and biological activity. There are few studies on physicochemical properties and rheological properties of TPS fractions, which are the key factors for their practical application. Because different concentrations of ethanol can precipitate polysaccharide fractions with different molecular weights, and these fractions have different characteristics and advantages, so that they can be used in different kinds of products (Feng et al., Citation2016). Therefore, Four TPS fractions were prepared by stepwise ethanol precipitation, and their static and dynamic rheological properties were studied comprehensively in this work. The viscosity of four TPS solutions at different temperatures, pH, and concentrations of sucrose and salts were also investigated in order to provide a theoretical guidance for the rational application of TPS in the fields of food and cosmetics.
2. Materials and methods
2.1. Materials and reagents
Tremella fuciformis (T. fuciformis) were purchased from a local supermarket (Sichuan, China). Dextran series standards (molecular weight from 2.5 to 5348 kDa) were purchased from Sigma Company. DEAE cellulose-52 was obtained from Solaibao Technology Co., Ltd. (Beijing, China). Bovine serum albumin was supplied by Alighting Reagent Co., Ltd. (Shanghai, China). Coomassie brilliant blue G-250 and dialysis bag (1000 Da) were purchased from Kelong Reagent Co., Ltd. (Chengdu, China). All chemicals used were analytical grade.
2.2. Preparation of TPS fractions
Preparation of TPS fractions was according to Tao et al. (Tao et al., Citation2015). Dry T. fuciformis was soaked in deionized water for 20 min and beaten. The resulting pulp was extracted at 121°C for 30 min, followed by a centrifugation at 2200 g for 15 min. The obtained extract was concentrated in vacuum at 60°C and the viscosity of it was measured at intervals until the viscosity reached 3.4 ± 0.1 Pa/s (25°C, rotor #4, 60 rpm). Anhydrous ethanol was added to the concentrate until the concentration of ethanol in the mixture reached 20% (v/v). The mixture was agitated continuously until a flocculent precipitation appeared, and then kept at 4°C for 24 h, followed by centrifugation at 2200 g for 15 min. The precipitate obtained was washed with an appropriate amount of anhydrous ethanol 3 times of its weight and then vacuum freeze-dried for 10 h (−50°C, <15 Pa) to obtain TPS20. The residual supernatant was collected and concentrated in vacuum to the above viscosity (3.4 ± 0.1 Pa/s). The concentration of ethanol in the concentrate was adjusted to 40% (v/v) with anhydrous ethanol. Then, the same operation steps as described above were performed to obtain TPS40. Similarly, TPS60 and TPS80 were prepared as the same method mentioned above.
2.3. Physicochemical characterization of TPS fractions
2.3.1. Chemical composition analysis
Total sugar content was determined by phenol-sulfuric acid method (Dubois et al., Citation1956). The protein content was evaluated using Coomassie brilliantblue method (Bradford, Citation1976). Uronic acid content was determined according to Blumenkrantz (Blumenkrantz & Hansen, Citation1973). And sulfate radical was measured using BaCl2-gelatin method (Dodgson & Price, Citation1962).
2.3.2. Molecular weight
The molecular weights of TPS fractions were measured by gel permeation chromatography (GPC) instrument (Breeze, Waters, USA) according to the method reported by Mao et al. (Mao et al., Citation2014). In detail, Ultrahyrogel linear column (7.8 mm×300 mm, Waters, USA) was utilized for the separation of TPS fractions at 35°C. The mobile phase was 0.25 M NaNO3 solution (pH = 6.0), and the flow rate was 0.5 mL/min. Their weight average molecular weight (Mw), number average molecular weight (Mn) and polydispersity coefficients (D = Mw/Mn) were calculated.
2.3.3. UV and FT-IR analysis
The proteins and nucleic acids of four TPS fraction solutions at 1 mg/mL were analyzed by a UV-Vis spectrophotometer (UV-1600, Meipuda, Shanghai) in the range of 200–400 nm. The mixture of 4 mL of four TPS fraction solutions (1 mg/mL) and 2.4 mL of iodine reagent (0.2% KI solution containing 0.02% I2) was scanned by a UV-Vis spectrophotometer in the range of 300–700 nm to analyze the branches and side chains of TPS. Fourier Transform Infrared Spectroscopy (FT-IR) was performed in transmission mode using an infrared spectrometer (Nicolet 6700, Thermo Co., USA) in the range of 4000 to 400 cm−1. A given amount of TPS20, TPS40, TPS60, or TPS80 (2 mg) was milled with 200 mg KBr and then pressed into a disc for FT-IR analysis.
2.3.4. Monosaccharide composition analysis
Monosaccharide composition of TPS60 purified by DEAE cellulose-52 and chromatography was determined using the method reported by Dai et al., (Citation2010). Monosaccharide standards including rhamnose, fucose, ribose, arabinose, xylose, mannose, glucuronic acid, glucose, galactose, and galacturonic acid were used.
High-Performance Liquid Chromatography (HPLC) was carried out as follows: the column temperature was 25°C with a Shiseido C18 column (4.6 mm×250 mm, 5 µm). The mobile phase was the mixture of 0.1 M phosphate buffer (pH = 6.8) and acetonitrile (v/v = 82:18). The flow rate was l.0 mL/min, and the detection wavelength was 245 nm.
2.4. Rheological analysis
2.4.1. Steady shear properties
All samples were determined by a rheometer (AR 2000-EX, TA instrument, USA) equipped with a cone plate (40 mm diameter, taper 2/11 deg/s, gap of 56 μm). For steady tests, samples were sheared at 25°C and a rate ranging from 0 to 600 s−1. Effects of shear rate on shear stress of TPS20, TPS40, TPS60, and TPS80 solutions were also determined at this condition, and the flow behavior was analyzed using the power-law model:
τ = Kγn
where τ, K, γ, and n are shear stress, consistency coefficient, shear rate, and flow behavior index, respectively.
The shear rate-shear stress curve can be used to evaluate the thixotropy. Thixotropy curves of four TPS fractions at 1% were performed in the shear rate range of 0.1 s−1 to 600 s−1 and then 600 s−1 to 0.1 s−1 at 25°C.
2.4.2. Dynamic viscoelastic properties
The linear viscoelastic regions of TPS20, TPS40, TPS60, and TPS80 solutions at 0.5% were analyzed by amplitude scanning mode. Their storage modulus (G’) and loss modulus (G’’) were measured at shear rate of 50 s−1, strain of 5% and angular frequency from 0.1 to 100 rad/s.
2.4.3. Stability analysis
Effects of temperature, salts, sucrose, and pH on the viscosity of four TPS fraction solutions were determined by a digital viscometer (SNB-2, Shanghai Jingtian Instrument Co., Ltd., China) with a rotor 4# at 60 r/min and 25°C.
2.5. Statistical analysis
Data were expressed as mean ± standard deviation of triplicate tests. Statistically significant differences (P < 0.05) were analyzed by one-way analysis of variance (ANOVA) followed by Tukey’s test using the SPSS 25.0 software (SPSS Inc., Chicago, IL, USA).
3. Results and discussion
3.1. Chemical compositions and molecular weight
In order to gain an insight into the related properties of the four TPS fractions, knowing their chemical compositions and molecular weight are important. Summarized in are the yields and main chemical compositions of the four TPS fractions. The yield of TPS60 was the highest (19.28%), which was much higher than that of the other three TPS fractions, suggesting it was the major components of TPS. This phenomenon probably related to the polarity of TPS and ethanol. And the content of total sugar (81.12%), protein (0.29%), uronic acid (14.36%) and sulfate radical (5.92%) in TPS60 were highest. TPS20 had the highest ash content (5.21%) and the same protein content as TPS60, while TPS80 contained the lowest contents of these two components. In addition, four TPS fractions contained higher uronic acid, indicating that they all belonged to an acid polysaccharide.
Table 1. Yields and chemical compositions of TPS fractions. (TPS20, 20% (v/v) ethanol precipitation; TPS40, 40% (v/v) ethanol precipitation; TPS60, 60% (v/v) ethanol precipitation; TPS80, 80% (v/v) ethanol precipitation).
Tabla 1. Rendimiento y composición química de las fracciones de TPS. [TPS20, extracción con etanol al 20% (v/v); TPS40, extracción con etanol al 40% (v/v); TPS60, extracción con etanol al 60% (v/v); TPS80, extracción con etanol al 80% (v/v)]
The molecular weights of four TPS fractions are shown in . Their Mw and Mn decreased in order of TPS20, TPS40, TPS60, and TPS80, which might be ascribed to the difference of polysaccharide’s solubility in ethanol solution. The larger the molecular weight of polysaccharide, the smaller its polarity is. When ethanol concentration is altered in the precipitation system, its polarity will change, thus affecting the solubility of the polysaccharide in it (Gu et al., Citation2020). This phenomenon was different from soy hull water-soluble polysaccharides fractions (SHSP), as its Mw decreased in order of SHSP40, SHSP20, and SHSP60 (S. N. Wang et al., Citation2019), which may be attributed to different sources of polysaccharides. TPS60 showed the highest D value and the most dispersed molecular weight distribution. This may be due to its higher protein content.
Table 2. Relative molecular weights and polydispersity coefficients of TPS fractions. (TPS20, 20% (v/v) ethanol precipitation; TPS40, 40% (v/v) ethanol precipitation; TPS60, 60% (v/v) ethanol precipitation; TPS80, 80% (v/v) ethanol precipitation).
Tabla 2. Pesos moleculares relativos y coeficientes de polidispersidad de las fracciones de TPS. [TPS20, extracción con etanol al 20% (v/v); TPS40, extracción con etanol al 40% (v/v); TPS60, extracción con etanol al 60% (v/v); TPS80, extracción con etanol al 80% (v/v)]
3.2. UV and FT-IR analysis
Here in, UV and FT-IR analysis were further carried out to characterize the components of TPS fractions. Four TPS fraction solutions had no obvious absorption peak at 260 nm and 280 nm ()), indicating that they did not contain nucleic acid or free proteins. However, the four fractions of TPS measured by Coomassie bright-blue method contained small quantities of proteins, which were speculated to be in the form of close binding with TPS.
Figure 1. UV spectra of TPS fractions (a),TPS fractions with I2-KI (b), FT-IR spectra (c) of TPS fractions. (TPS20, 20% (v/v) ethanol precipitation; TPS40, 40% (v/v) ethanol precipitation; TPS60, 60% (v/v) ethanol precipitation; TPS80, 80% (v/v) ethanol precipitation).
Figura 1. Espectros UV de las fracciones TPS (a), fracciones TPS con I2-KI (b), espectros FT-IR (c) de las fracciones de TPS. [TPS20, extracción con etanol al 20% (v/v); TPS40, extracción con etanol al 40% (v/v); TPS60, extracción con etanol al 60% (v/v); TPS80, extracción con etanol al 80% (v/v)]
![Figure 1. UV spectra of TPS fractions (a),TPS fractions with I2-KI (b), FT-IR spectra (c) of TPS fractions. (TPS20, 20% (v/v) ethanol precipitation; TPS40, 40% (v/v) ethanol precipitation; TPS60, 60% (v/v) ethanol precipitation; TPS80, 80% (v/v) ethanol precipitation).Figura 1. Espectros UV de las fracciones TPS (a), fracciones TPS con I2-KI (b), espectros FT-IR (c) de las fracciones de TPS. [TPS20, extracción con etanol al 20% (v/v); TPS40, extracción con etanol al 40% (v/v); TPS60, extracción con etanol al 60% (v/v); TPS80, extracción con etanol al 80% (v/v)]](/cms/asset/e4da77b9-e613-453e-b800-2784bed72828/tcyt_a_1950212_f0001_oc.jpg)
As shown in ), the maximum UV absorption were all observed before 400 nm and no absorption peak appeared at 565 nm, indicating that TPS fractions may have complex branched chain structure which contain more branches and longer side chains. In addition, the color of the mixtures of four TPS fractions could not change into blue, indicating that they did not contain starch.
The infrared spectrograms of TPS20, TPS40, TPS60, and TPS80 are shown in ). The FT-IR spectra of these TPS were similar. The absorbance band at around 3400 cm−1 was assigned to stretching vibration of hydroxyl groups. The band at 2925 cm−1 and 1400–1200 cm−1 represented C-H stretching vibration and variable angle vibration, respectively. The absorption peak that appeared near 1735 cm−1 was associated with the stretching vibration of C=O bonds in -COOH. Absorption peaks discussed above indicate that TPS may be an acidic polysaccharide (Liu et al., Citation2016). Also, stretching peaks between 1000 cm−1 and 1100 cm−1 belonged to the vibrations of C-O-C or C-O-H group, whereas the intense band near 1420 cm−1 and 1618 cm−1 were assigned to the symmetric and asymmetric stretching vibration of -COO−, indicating that the compound contains uronic acid (Q. Li et al., Citation2013; Zhao et al., Citation2007). Meanwhile, the peak at 800 cm−1 was attributed to mannose. These results suggest that TPS20, TPS40, TPS60, and TPS80 are acidic heteropolysaccharides with mannose as the main chain.
3.3. Monosaccharide composition
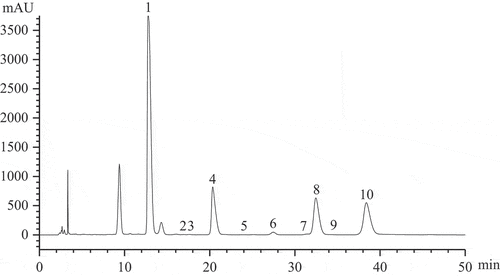
As the main component of TPS, monosaccharide composition of TPS60 was determined after it was purified and freeze-dried. The HPLC chromatogram of purified TPS60 was shown in . Results showed that purified TPS60 fraction was composed of 10 kinds of monosaccharides, including mannose, fucose, xylose, glucuronic acid, glucose, galactose, arabinose, rhamnose, ribose, and galacturonic acid in a mole ratio of 871.72:323.94:251:218.03:15.51:3.95:2.01:1.66:1.03:0.74, of which mannose composed its main chain and the other nine monosaccharides constituted its side chains. TPS60 had a similar monosaccharide composition to TPS reported by Ukai et al. (Ukai et al., Citation1972), but their monosaccharide content are remarkably different, especially the content of fucose in TPS60 fraction is significantly higher. This may be related to the culture way of T. fuciformis and culture material composition. For example, The TPS extracted from T. fuciformis cultivated in the substitute and the wood were both composed of mannose, glucose, xylose, and glucuronic acid, but their glucose content were remarkably different (Q. Zhang et al., Citation2019).
Figure 2. HPLC chromatogram of purified TPS60. (1. Mannose; 2. Ribose; 3. Rhamnose; 4. Glucuronic acid; 5. Galacturonic acid; 6. Glucose; 7. Galactose; 8. Xylose; 9. Arabinose; 10. Fucose).
Figura 2. Cromatograma de HPLC de la TPS60 purificada. (1. Manosa; 2. Ribosa; 3. Ramnosa; 4. Ácido glucurónico; 5. Ácido galacturónico; 6. Glucosa; 7. Galactosa; 8. Xilosa; 9. Arabinosa; 10. Fucosa)
3.4. Rheological properties
3.4.1. Steady shear properties
Since rheological properties of polysaccharides can directly affect its processing, researches on rheological properties of polysaccharide are of great significance. As can be seen from , the viscosity of four TPS solutions increased with the increase of their mass concentration and decreased with the increase of shear rate. Similar behaviors have been observed for polysaccharides from raspberry fruits (Xu et al., Citation2019). For TPS20, TPS40 and TPS60 solutions, when the concentration of TPS20, TPS40, and TPS60 was 1%, the viscosity of these solutions gradually decreased with the increase of shear rate ranging from 0 s−1 to 600 s−1, showing an obvious non-Newtonian fluid characteristic. However, when the concentration of the three solutions was 0.1% or 0.5%, their viscosities experienced a sharp decrease in the shear rate range of 0–100 s−1, showing a non-Newtonian fluid characteristic, and then their viscosity changed little with the shear rate increasing continuously, exhibiting an ideal constant Newtonian fluid characteristic when the shear rate exceeded 300 s−1. For TPS80 solutions of different concentration at 0.1%, 0.5%, or 1%, the changes of viscosity were almost the same as that of the other three kinds of solutions at 0.1% and 0.5%, showing a non-Newtonian fluid characteristic in the shear rate range of 0–100 s−1 and Newtonian fluid characteristic with shear rate exceeding 300 s−1.
Figure 3. Viscosity of four TPS fraction solutions at different concentrations as a function of shear rate at 25°C. (TPS20, 20% (v/v) ethanol precipitation; TPS40, 40% (v/v) ethanol precipitation; TPS60, 60% (v/v) ethanol precipitation; TPS80, 80% (v/v) ethanol precipitation).
Figura 3. Viscosidad de cuatro soluciones de fracciones de TPS a diferentes concentraciones en función de la velocidad de cizallamiento a 25°C. [TPS20, extracción de etanol al 20% (v/v); TPS40, extracción de etanol al 40% (v/v); TPS60, extracción de etanol al 60% (v/v); TPS80, extracción de etanol al 80% (v/v)]
![Figure 3. Viscosity of four TPS fraction solutions at different concentrations as a function of shear rate at 25°C. (TPS20, 20% (v/v) ethanol precipitation; TPS40, 40% (v/v) ethanol precipitation; TPS60, 60% (v/v) ethanol precipitation; TPS80, 80% (v/v) ethanol precipitation).Figura 3. Viscosidad de cuatro soluciones de fracciones de TPS a diferentes concentraciones en función de la velocidad de cizallamiento a 25°C. [TPS20, extracción de etanol al 20% (v/v); TPS40, extracción de etanol al 40% (v/v); TPS60, extracción de etanol al 60% (v/v); TPS80, extracción de etanol al 80% (v/v)]](/cms/asset/1681053a-b1d3-4edb-b811-a6d03a6b8b65/tcyt_a_1950212_f0003_oc.jpg)
The viscosity of TPS solutions is directly proportional to their mass concentrations. This may be attributed to enhanced interactions of TPS chains and more entanglements between their molecules at higher concentrations (S. N. Wang et al., Citation2019). Except for TPS80, TPS fraction solutions demonstrated more pronounced shear-thinning at higher concentrations, which may be related to the critical concentration of the solution. When the concentration of solution was higher than the critical one, it presented non-Newtonian fluid characteristic, and the degree of its pseudo-plasticity increased with the increase of its concentration. When solution concentration was lower than the critical concentration, it was Newtonian fluid. TPS80 solution at 1% may not reach its critical concentration, thus no obvious shear-thinning phenomenon was observed (Barrangou et al., Citation2006; Che et al., Citation2008).
TPS fraction solutions showed a shear-thinning non-Newtonian fluid characteristic within a certain range of shear rate but demonstrated a Newtonian fluid characteristic over this range. This can be explained as follows: gradually increasing shear force destroys entanglement structures between TPS molecular chains, producing scattered polysaccharide chains which are difficult to re-entangle after they rotate and contract into clusters. At the same time, the orientation effect of polysaccharide chains makes the flow direction of disordered polysaccharide chains gradually tend to be consistent with the increase of shear rate, and the interaction between polysaccharide chains is weakened, leading to the reconstruction speed of TPS chains is slower than the destruction speed. Thus, the viscosity of the solution decreased continuously, showing a pseudoplastic characteristic of non-Newtonian fluid. When the shear rate continues to increase, it accelerates the disintegration of the entanglement structure between the polysaccharides, and the disintegration speed is much faster than their reconstruction speed. As a result, the viscosity of TPS solution reaches a minimum value and remains basically constant, showing the characteristic of Newtonian fluid (Adeli & Samavati, Citation2015; Vardhanabhuti & Ikeda, Citation2006).
Among the four TPS fractions, the viscosity of TPS20 solution dropped most, showing an obvious pseudoplastic characteristic, but the viscosity of TPS80 solution decreased slightly, demonstrating an obvious Newtonian fluid characteristic. This may be related to their relative molecular weights (Tabasi & Razavi, Citation2017). TPS20 had the most obvious pseudo-plasticity, owing to its highest molecular weight.
According to the above mentioned results, TPS solutions at 1% basically presented non-Newtonian fluid characteristics, so this concentration was selected for further investigation. Shear-thinning behavior can also be observed from the change of shear stress (). These curves were consistent with the power-law model τ = Kγn, n < 1. So the four TPS solutions at 1% belonged to pseudo-plastic fluid (Díaz et al., Citation2008). At the same shear rate, TPS20 solution showed the largest shear stress followed by TPS40, TPS60, and TPS80, which is consistent with their change of molecular weights, indicating that TPS fraction with high molecular weight had a stronger interaction force and less deformable under external force. Among them, TPS20 solution had the fastest change of shear stress and the strongest pseudo-plasticity, while TPS80 solution showed the slowest change of shear stress and the weakest pseudo-plasticity. Moreover, a liquid food with a pseudo-plastic property has an excellent mouth feel, showing a stable sense of flow during chewing and viscosity restoration after chewing conducive to swallowing (Marcotte et al., Citation2001). Therefore, TPS20, TPS40 and TPS60 have the potential to be applied in pulp food such as sauce and milk beverage.
Figure 4. The relationship of shear rate with shear stress of four TPS fraction solutions at 1% and 25°C. (TPS20, 20% (v/v) ethanol precipitation; TPS40, 40% (v/v) ethanol precipitation; TPS60, 60% (v/v) ethanol precipitation; TPS80, 80% (v/v) ethanol precipitation).
Figura 4. Relación de la velocidad de cizallamiento con la tensión de cizallamiento de cuatro soluciones de fracciones de TPS al 1% y a 25°C. [TPS20, extracción de etanol al 20% (v/v); TPS40, extracción de etanol al 40% (v/v); TPS60, extracción de etanol al 60% (v/v); TPS80, extracción de etanol al 80% (v/v)]
![Figure 4. The relationship of shear rate with shear stress of four TPS fraction solutions at 1% and 25°C. (TPS20, 20% (v/v) ethanol precipitation; TPS40, 40% (v/v) ethanol precipitation; TPS60, 60% (v/v) ethanol precipitation; TPS80, 80% (v/v) ethanol precipitation).Figura 4. Relación de la velocidad de cizallamiento con la tensión de cizallamiento de cuatro soluciones de fracciones de TPS al 1% y a 25°C. [TPS20, extracción de etanol al 20% (v/v); TPS40, extracción de etanol al 40% (v/v); TPS60, extracción de etanol al 60% (v/v); TPS80, extracción de etanol al 80% (v/v)]](/cms/asset/591626f7-cdda-4660-9508-24da8db9f35d/tcyt_a_1950212_f0004_b.gif)
The thixotropic curves of four TPS fraction solutions are shown in . The rise and fall curves of TPS20, TPS40 and TPS60 solutions were not completely coincident, forming a closed thixotropic ring. The thixotropic ring of TPS20 solution had the largest area, suggesting that TPS20 solution needs longer time and more energy to restore its original state after its structure is destroyed by external force. TPS80 solution’s rise curve almost overlapped with its fall curve, indicating that it is non-thixotropic and can recover rapidly after external force, which may due to its lower molecular weight and lower solution viscosity. Therefore, TPS20, TPS40, and TPS60 can be used in products that do not need to maintain their shape, such as mayonnaise, salad dressing and so on. On the contrary, TPS80 can be added to products that need to maintain a certain shape such as gelatinous foods.
Figure 5. Thixotropy of four TPS fraction solutions at 1% and 25°C. (TPS20, 20% (v/v) ethanol precipitation; TPS40, 40% (v/v) ethanol precipitation; TPS60, 60% (v/v) ethanol precipitation; TPS80, 80% (v/v) ethanol precipitation).
Figura 5. Tixotropía de cuatro soluciones de fracciones de TPS al 1% y a 25°C. [TPS20, extracción con etanol al 20% (v/v); TPS40, extracción con etanol al 40% (v/v); TPS60, extracción con etanol al 60% (v/v); TPS80, extracción con etanol al 80% (v/v)]
![Figure 5. Thixotropy of four TPS fraction solutions at 1% and 25°C. (TPS20, 20% (v/v) ethanol precipitation; TPS40, 40% (v/v) ethanol precipitation; TPS60, 60% (v/v) ethanol precipitation; TPS80, 80% (v/v) ethanol precipitation).Figura 5. Tixotropía de cuatro soluciones de fracciones de TPS al 1% y a 25°C. [TPS20, extracción con etanol al 20% (v/v); TPS40, extracción con etanol al 40% (v/v); TPS60, extracción con etanol al 60% (v/v); TPS80, extracción con etanol al 80% (v/v)]](/cms/asset/fb79917a-6d24-4228-8a29-73b0f48b5815/tcyt_a_1950212_f0005_oc.jpg)
3.4.2. Dynamic viscoelastic properties
shows the dynamic viscoelastic curves of four TPS solutions. They all demonstrated a characteristic of viscoelastic polymer. At low frequency, G’’ of TPS solutions exceeded G’, so they mainly presented the flow state and viscosity characteristics of a liquid. As frequency increased, their G’ surpassed G’’, showing an elastic characteristic similar to a solid. This can be explained as follows: when oscillation frequency is low, the stress relaxation time of the solution is sufficient to let TPS undergo slow deformation. The viscous flow dissipates most of the energy, so the energy of the solution system is low, showing G’<G’’. With the increment of frequency, the relaxation time among the chains of TPS is shortened, resulting in no enough time to slide, then gradually forming a network structure similar to solid, so that the energy of solution system can be stored until G’> G’’. However, only the TPS80 fraction showed an increased G’ value after the crossover point. The results of TPS20, TPS40, and TPS60 were different from the results of Wang et al. (L. Wang et al., Citation2021) may due to the concentration of ethanol while precipitation. Among four TPS solutions, TPS20 was the first to show an elastic characteristic. That is probably due to more intertwining points between polysaccharide chains formed for its relatively high molecular weight, which makes its solution easy to form a solid-like network structure and begin to store energy at a lower frequency.
Figure 6. Dynamic rheological curves of four TPS fraction solutions at 0.5% and 25°C. (TPS20, 20% (v/v) ethanol precipitation; TPS40, 40% (v/v) ethanol precipitation; TPS60, 60% (v/v) ethanol precipitation; TPS80, 80% (v/v) ethanol precipitation).
Figura 6. Curvas reológicas dinámicas de cuatro soluciones de fracciones de TPS a 0.5% y 25°C. [TPS20, 20% (v/v) de extracción de etanol; TPS40, 40% (v/v) de extracción de etanol; TPS60, 60% (v/v) de extracción de etanol; TPS80, 80% (v/v) de extracción de etanol]
![Figure 6. Dynamic rheological curves of four TPS fraction solutions at 0.5% and 25°C. (TPS20, 20% (v/v) ethanol precipitation; TPS40, 40% (v/v) ethanol precipitation; TPS60, 60% (v/v) ethanol precipitation; TPS80, 80% (v/v) ethanol precipitation).Figura 6. Curvas reológicas dinámicas de cuatro soluciones de fracciones de TPS a 0.5% y 25°C. [TPS20, 20% (v/v) de extracción de etanol; TPS40, 40% (v/v) de extracción de etanol; TPS60, 60% (v/v) de extracción de etanol; TPS80, 80% (v/v) de extracción de etanol]](/cms/asset/eb05c25e-ed02-4ffb-9e1a-b33f3515ea93/tcyt_a_1950212_f0006_oc.jpg)
In addition, crossover points were observed in the dynamic rheological curves of four TPS solutions, indicating that they all have the ability to form gels. Tan δ, which was equal to G’’/G’, could also be used to describe the rheological behavior of the solution. Tan δ at the crossover point of TPS20, TPS40, TPS60, and TPS80 solution was 0.985, 0.988, 0.990, and 0.978, respectively, which were all greater than 0.1, showing certain weak gel property. It is worth noting that the crossover point of TPS20 and TPS80 appeared at lower frequency and higher frequency, respectively, suggesting that TPS20 solution has stronger elasticity, while the solution of TPS fraction with high molecular weight is more likely to form a gel state (W. H. Wang et al., Citation2017).
3.4.3. Effect of temperature on the viscosity of TPS fraction solutions
Here in, the influence of temperature on the viscosity of TPS solutions was explored, since temperature is an important parameter in food and cosmetics processing. As shown in , the viscosity of four TPS solutions decreased gradually with the increase of temperature at 20–80°C, which is consistent with the changes in the viscosity of tara gum solution affected by temperature (Y. B. Wu et al., Citation2015). The reason is that the rising temperature accelerates the molecular motion, reducing the interaction force between the polysaccharide molecules and the internal friction of the flow (Xu et al., Citation2019).
Figure 7. Effect of temperature on viscosity of four TPS fraction solutions at 0.5%. (TPS20, 20% (v/v) ethanol precipitation; TPS40, 40% (v/v) ethanol precipitation; TPS60, 60% (v/v) ethanol precipitation; TPS80, 80% (v/v) ethanol precipitation).
Figura 7. Efecto de la temperatura en la viscosidad de cuatro soluciones de fracciones de TPS al 0.5%. [TPS20, extracción con etanol al 20% (v/v); TPS40, extracción con etanol al 40% (v/v); TPS60, extracción con etanol al 60% (v/v); TPS80, extracción con etanol al 80% (v/v)]
![Figure 7. Effect of temperature on viscosity of four TPS fraction solutions at 0.5%. (TPS20, 20% (v/v) ethanol precipitation; TPS40, 40% (v/v) ethanol precipitation; TPS60, 60% (v/v) ethanol precipitation; TPS80, 80% (v/v) ethanol precipitation).Figura 7. Efecto de la temperatura en la viscosidad de cuatro soluciones de fracciones de TPS al 0.5%. [TPS20, extracción con etanol al 20% (v/v); TPS40, extracción con etanol al 40% (v/v); TPS60, extracción con etanol al 60% (v/v); TPS80, extracción con etanol al 80% (v/v)]](/cms/asset/9784d305-88b1-46cb-a053-b3dfa85ce516/tcyt_a_1950212_f0007_b.gif)
The viscosity of TPS fraction solutions is unstable with temperature change. Among them, the viscosity of TPS20 solution varied the most, indicating that temperature had a more obvious influence on the viscosity of TPS with higher molecular weight. The Andrade equation η ≈ Aexp (E/RT) (E, R and T represent the flow activation energy, gas constant and temperature, respectively) reflects the dependence of fluid viscosity on temperature. According to this equation, the higher the E value, the more sensitive the viscosity is to temperature changes. And E value is related to the molecular weight and structure of the fluid. TPS20 had the highest molecular weight and the highest E value, so the viscosity of its solution decreased most obviously with enhancement of temperature. Moreover, four TPS fractions can play a good role in thickening and stabilization of food products processed at low temperatures. TPS80 with lower molecular weight has better thermal stability and can be used in hot-processed food products.
3.4.4. Effect of salts on the viscosity of TPS fraction solutions
As known to all, salts are commonly used in food. For example, NaCl is the main ingredient of salt and the basic flavoring agent in food. CaCl2, as a commonly used coagulant, is used in thin cream, jam, canned fruits, and vegetables and other foods. In order to let TPS remain relatively stable, research on the effect of salt concentration on the viscosity of TPS solutions is of great importance. As shown in , the viscosity of four TPS solutions decreased after adding different concentrations of NaCl and CaCl2, and their viscosity decreased significantly especially at lower salt concentrations, which is ascribed to that the addition of Na+ and Ca2+ are capable of reducing the repulsion and molecule expansion, and hence producing a significant reduction in viscosity (Y. B. Wu et al., Citation2015). Besides, Na+ and Ca2+ may prompt salting out in TPS solution, resulting in reducing polysaccharide solution concentration and ultimately decreasing viscosity (B. Yang et al., Citation2019). When the concentration of NaCl and CaCl2 in the system exceeded 5 mg/mL and 1 mg/mL respectively, the viscosity of TPS solutions tended to be stable gradually. This may be due to that Na+ and Ca2+ in the solutions are saturated and their continuous addition cannot affect the thickness of the charged ion double layer. After the addition of NaCl and CaCl2, the change in the viscosity of TPS80 solution was less than that of other three fraction solutions, indicating that it has a better stability in salt solutions. This is related to the difference in their molecular weights. The smaller the molecular weight of the polysaccharide, the viscosity of its solution is less sensitive to salts. However, at higher concentrations of NaCl and CaCl2, the viscosity of TPS20 solution was still significantly higher than that of the other three TPS fraction solutions due to the largest molecular weight of TPS20 and its highest viscosity. Therefore, TPS80 can be utilized in food products with NaCl concentration less than 5 mg/mL and CaCl2 concentration less than 1 mg/mL, for example, the canned fruits and vegetables with a maximum dosage of 1 mg/mL CaCl2. While TPS20 can be used in those food products containing high concentrations of NaCl and CaCl2 as a thickening agent.
Figure 8. Effect of different concentrations of NaCl (a) and CaCl2 (b) on the viscosity of four TPS fraction solutions. (TPS20, 20% (v/v) ethanol precipitation; TPS40, 40% (v/v) ethanol precipitation; TPS60, 60% (v/v) ethanol precipitation; TPS80, 80% (v/v) ethanol precipitation).
Figura 8. Efecto de diferentes concentraciones de NaCl (a) y CaCl2 (b) en la viscosidad de cuatro soluciones de fracciones de TPS. [TPS20, extracción de etanol al 20% (v/v); TPS40, extracción de etanol al 40% (v/v); TPS60, extracción de etanol al 60% (v/v); TPS80, extracción de etanol al 80% (v/v)]
![Figure 8. Effect of different concentrations of NaCl (a) and CaCl2 (b) on the viscosity of four TPS fraction solutions. (TPS20, 20% (v/v) ethanol precipitation; TPS40, 40% (v/v) ethanol precipitation; TPS60, 60% (v/v) ethanol precipitation; TPS80, 80% (v/v) ethanol precipitation).Figura 8. Efecto de diferentes concentraciones de NaCl (a) y CaCl2 (b) en la viscosidad de cuatro soluciones de fracciones de TPS. [TPS20, extracción de etanol al 20% (v/v); TPS40, extracción de etanol al 40% (v/v); TPS60, extracción de etanol al 60% (v/v); TPS80, extracción de etanol al 80% (v/v)]](/cms/asset/b6e75897-9f12-4d42-b53d-e257d2bb2711/tcyt_a_1950212_f0008_oc.jpg)
3.4.5. Effect of sucrose on the viscosity of the TPS fraction solutions
Sucrose is widely used in food processing. The effect of sucrose concentration on the viscosity of TPS fraction solutions is demonstrated in . As sucrose concentration went up, the viscosity of TPS20, TPS40, and TPS60 fraction solutions first increased, then decreased and reached the maximum at 60 mg/mL. The reason for the increased viscosity may be that hydrated sucrose enters into the voids of the network structure entangled by the polysaccharide molecule chains in a certain concentration range, and forms a bridge connection with polysaccharide molecules by hydrogen bonds (Z. Yang et al., Citation2018). Additionally, sucrose itself contributes to the viscosity of the system at a certain extent (H. Li et al., Citation2019). When the concentration of sucrose exceeded 60 mg/mL, the viscosity of the three TPS solutions began to decrease. This may be that the higher the concentration of sucrose, the greater its obstacle to the interaction between the polysaccharide molecules, which in turn weakens the entanglement between the polysaccharide molecules, resulting in a decrease in the viscosity of solution.
Figure 9. Effect of different concentrations of sucrose on the viscosity of four TPS fraction solutions. (TPS20, 20% (v/v) ethanol precipitation; TPS40, 40% (v/v) ethanol precipitation; TPS60, 60% (v/v) ethanol precipitation; TPS80, 80% (v/v) ethanol precipitation).
Figura 9. Efecto de diferentes concentraciones de sacarosa en la viscosidad de cuatro soluciones de fracciones de TPS. [TPS20, extracción de etanol al 20% (v/v); TPS40, extracción de etanol al 40% (v/v); TPS60, extracción de etanol al 60% (v/v); TPS80, extracción de etanol al 80% (v/v)]
![Figure 9. Effect of different concentrations of sucrose on the viscosity of four TPS fraction solutions. (TPS20, 20% (v/v) ethanol precipitation; TPS40, 40% (v/v) ethanol precipitation; TPS60, 60% (v/v) ethanol precipitation; TPS80, 80% (v/v) ethanol precipitation).Figura 9. Efecto de diferentes concentraciones de sacarosa en la viscosidad de cuatro soluciones de fracciones de TPS. [TPS20, extracción de etanol al 20% (v/v); TPS40, extracción de etanol al 40% (v/v); TPS60, extracción de etanol al 60% (v/v); TPS80, extracción de etanol al 80% (v/v)]](/cms/asset/5b0c7e47-e2df-4690-b77a-ae23af80a703/tcyt_a_1950212_f0009_oc.jpg)
The viscosity of TPS80 solution remained basically unchanged with the increase of sucrose concentration. When the amount of sucrose reached 150 mg/mL, the viscosity decreased slightly. TPS80 has small molecular weight, fewer entanglement points and fewer structural voids available for filling after sucrose hydration, thus sucrose had little effect on the viscosity of its solution. Hence, TPS80 has a high stability to sucrose and can be used for processing various sugary food products. TPS20, TPS40, and TPS60 have good thickening and stabilizing effects, so they are suitable for applying in the low sugar food products.
3.4.6. Effect of pH on the viscosity of the TPS fraction solutions
Foods are usually processed under different environments in practice, and pH is a key factor in production. The effect of pH on the viscosity of TPS solutions is shown in . Their viscosity reached maximum at pH = 7. With the increase of acid strength or alkali strength, the viscosity of all the solutions decreased, indicating that both strong acid or strong alkali can cause the cleavage of partial hydrogen bonds, leading to the damage of their partial structure and decrease in the viscosity of TPS fraction solutions. This result is similar to that of polysaccharide from okra pulp (Y. P. Li et al., Citation2020).
Figure 10. Effect of pH on the viscosity of four TPS fraction solutions. (TPS20, 20% (v/v) ethanol precipitation; TPS40, 40% (v/v) ethanol precipitation; TPS60, 60% (v/v) ethanol precipitation; TPS80, 80% (v/v) ethanol precipitation).
Figura 10. Efecto del pH en la viscosidad de cuatro soluciones de fracciones de TPS. [TPS20, extracción de etanol al 20% (v/v); TPS40, extracción de etanol al 40% (v/v); TPS60, extracción de etanol al 60% (v/v); TPS80, extracción de etanol al 80% (v/v)]
![Figure 10. Effect of pH on the viscosity of four TPS fraction solutions. (TPS20, 20% (v/v) ethanol precipitation; TPS40, 40% (v/v) ethanol precipitation; TPS60, 60% (v/v) ethanol precipitation; TPS80, 80% (v/v) ethanol precipitation).Figura 10. Efecto del pH en la viscosidad de cuatro soluciones de fracciones de TPS. [TPS20, extracción de etanol al 20% (v/v); TPS40, extracción de etanol al 40% (v/v); TPS60, extracción de etanol al 60% (v/v); TPS80, extracción de etanol al 80% (v/v)]](/cms/asset/9eafeceb-98e6-4f95-8113-cf5fed45e683/tcyt_a_1950212_f0010_b.gif)
The viscosity of four TPS solutions under strong acid condition decreased more than that under strong alkali condition, showing that TPS fractions have better resistance to alkali. This may be related to that TPS is an acid polysaccharide. When the acid or the alkali cause the same damage to the structure of TPS fractions and cause a decrease in the viscosity of their solutions, the charge density of acidic polysaccharide group increases as pH increases, resulting in improvement of viscosity (Chen & Chen, Citation2001; Oliveira et al., Citation2001). The viscosity of TPS20 fraction solution was most affected by pH while pH exhibited the least influence on that of TPS80 solution. This may be related to their molecular weights. The larger the molecular weight of the polysaccharide, the easier it is to form a small molecular segment under the destruction of acid or alkali to lower the viscosity of its solution. Therefore, the four TPS fractions can be applied in neutral, weak acidic or weak alkaline food products, and TPS80 fraction can also be used in food products with strong acidity or alkalinity.
4. Conclusions
Four TPS including TPS20, TPS40, TPS60, and TPS80 were obtained by stepwise ethanol precipitation. They had a similar structure but different chemical composition. They were all acidic heteropolysaccharides with mannans as the main chain. Within a certain range of shear rate, their solutions were a kind of shear-thinning pseudoplastic fluid, demonstrating a similar dynamic viscoelastic property. They all exhibited a viscous characteristic at low vibration frequencies and an elastic characteristic at higher vibration frequencies. Furthermore, they had weak gel property. The viscosity of TPS fraction solutions decreased with increasing temperature or the concentrations of salts. And the viscosity decreased with the increase of acidity and alkalinity. TPS80 solution had a better stability and its viscosity was minimally affected by temperature, NaCl, CaCl2, sucrose, and pH. The results of this study can provide a guideline to the application of TPS fractions in the food and cosmetic industry.
However, there are still some limitations. The other three fractions of TPS except TPS60 were not further purified. Only the monosaccharide composition and molar ratio of TPS60 were determined, and further studies should be carried out on the types of glycosidized bonds and molecular conformation in order to elucidate the differences in physicochemical properties, rheological properties and biological activities of TPS fractions from the molecular level.
Disclosure statement
No potential conflict of interest was reported by the authors.
Additional information
Funding
References
- Adeli, M., & Samavati, V. (2015). Studies on the steady shear flow behavior and chemical properties of water-soluble polysaccharide from Ziziphus lotus fruit. International Journal of Biological Macromolecules, 72, 580–587. https://doi.org/https://doi.org/10.1016/j.ijbiomac.2014.08.047
- Barrangou, L. M., Drake, M. A., Daubert, C. R., & Foegeding, E. A. (2006). Textural properties of agarose gels. II. relationships between rheological properties and sensory texture. Food Hydrocolloids, 20(2–3), 196–203. https://doi.org/https://doi.org/10.1016/j.foodhyd.2005.03.013
- Blumenkrantz, N., & Hansen, G. A. (1973). New method for quantitative determination of uronic acids. Analytical Biochemistry, 54(2), 484–489. https://doi.org/https://doi.org/10.1016/0003-2697(73)90377-1
- Bradford, M. M. (1976). A rapid and sensitive method for the quantitation of microgram quantities of protein utilizing the principle of protein-dye binding. Analytical Biochemistry, 72, 248–254. https://doi.org/https://doi.org/10.1016/0003-2697(76)90527-3
- Che, L. M., Li, D., Wang, L. J., Özkan, N., Chen, X. D., & Mao, Z. H. (2008). Rheological properties of dilute aqueous solutions of cassava starch. Carbohydrate Polymers, 73(3), 385–389. https://doi.org/https://doi.org/10.1016/j.carbpol.2008.03.007
- Chen, B. (2010). Optimization of extraction of Tremella fuciformis polysaccharides and its antioxidant and antitumour activities in vitro. Carbohydrate Polymers, 81(1–2), 420–424. https://doi.org/https://doi.org/10.1016/j.carbpol.2010.02.039
- Chen, R. H., & Chen, W. Y. (2001). Rheological properties of the water-soluble mucilage of a green laver. Monostroma nitidium. Journal of Applied Phycology, 13, 481–488. https://doi.org/https://doi.org/10.1023/A:1012580604417
- Cho, H. M., & Yoo, B. (2015). Rheological characteristics of cold thickened beverages containing xanthan gum–based food thickeners used for dysphagia diets. Journal of the Academy of Nutrition & Dietetics, 115(1), 106–111. https://doi.org/https://doi.org/10.1016/j.jand.2014.08.028
- Dai, J., Wu, Y., Chen, S. W., Zhu, S., Yin, H. P., Wang, M., & Tang, J. (2010). Sugar compositional determination of polysaccharides from Dunaliella salina by modified RP-HPLC method of precolumn derivatization with 1-phenyl-3-methyl-5-pyrazolone. Carbohydrate Polymers, 82(3), 629–635. https://doi.org/https://doi.org/10.1016/j.carbpol.2010.05.029
- Danalache, F., Mata, P., Martins, M. M., & Alves, V. D. (2015). Novel mango bars using gellan gum as gelling agent: Rheological and microstructural studies. LWT-Food Science Technology, 62(1), 576–583. https://doi.org/https://doi.org/10.1016/j.lwt.2014.09.037
- Díaz, D. G., Navaza, J. M., & Riveiro, L. C. Q. (2008). Influence of mixing and temperature on the rheological properties of carboxymethyl cellulose/k-carrageenan mixtures. European Food Research and Technology, 32(9), 312–315. https://doi.org/https://doi.org/10.1007/s00217-008-0858-2
- Dodgson, K. S., & Price, R. G. (1962). A note on the determination of the ester sulphate content of sulphated polysaccharides. Biochemistry Journal, 84(1), 106–110. https://doi.org/https://doi.org/10.1042/bj0840106
- Dubois, M., Gilles, K. A., Hamilton, J. K., Rebers, P. A., & Smith, F. (1956). Colorimetric method for determination of sugars and related substances. Analytical Chemistry, 28(3), 350–356. https://doi.org/https://doi.org/10.1021/ac60111a017
- Feng, L., Yin, J. Y., Nie, S. P., Wan, Y. Q., & Xie, M. Y. (2016). Fractionation, physicochemical property and immunological activity of polysaccharides from. Cassia Obtusifolia. International Journal of Biological Macromolecules, 91, 946–953. https://doi.org/https://doi.org/10.1016/j.ijbiomac.2016.05.030
- García, M. C., Alfaro, M. C., & Muñoz, J. (2015). Influence of the ratio of amphiphilic copolymers used as emulsifiers on the microstructure, physical stability and rheology of α-pinene emulsions stabilized with gellan gum. Colloids and Surfaces B: Biointerfaces, 135, 465–471. https://doi.org/https://doi.org/10.1016/j.colsurfb.2015.07.060
- Gu, J. Y., Zhang, H. H., Zhang, J. X., Wen, C. T., Ma, H. L., Duan, Y. Q., & He, Y. Q. (2020). Preparation, characterization and bioactivity of polysaccharide fractions from Sagittaria sagittifolia L. Carbohydrate Polymers, 229, 115355. https://doi.org/https://doi.org/10.1016/j.carbpol.2019.115355
- Hu, J., Zhao, T. F., Li, S. J., Wang, Z. Y., Wen, C. G., Wang, H. T., Yu, C. X., & Ji, C. F. (2019). Stability, microstructure, and digestibility of whey protein isolate-Tremella fuciformis polysaccharide complexes. Food Hydrocolloids, 89, 379–385. https://doi.org/https://doi.org/10.1016/j.foodhyd.2018.11.005
- Li, H., Wang, Z. C., Sun, X. Y., Pan, C., Gao, X. D., & Liu, W. (2019). Chemical and rheological properties of proteoglycans from Sarcandra glabra (Thunb.) Nakai. International Journal of Biological Macromolecules, 132, 641–650. https://doi.org/https://doi.org/10.1016/j.ijbiomac.2019.03.228
- Li, Q., Yu, N. W., Wang, Y. P., Sun, Y. P., Lu, K. P., & Guan, W. L. (2013). Extraction optimization of Bruguiera gymnorrhiza polysaccharides with radical scavenging activities. Carbohydrate Polymers, 96(1), 148–155. https://doi.org/https://doi.org/10.1016/j.carbpol.2013.03.054
- Li, Y. P., Wang, X. Y., Lv, X. Y., Wang, X. X., Wang, X. S., Cui, J. L., & Yan, M. Y. (2020). Extractions and rheological properties of polysaccharide from okra pulp under mild conditions. International Journal of Biological Macromolecules, 148, 510–517. https://doi.org/https://doi.org/10.1016/j.ijbiomac.2020.01.163
- Liu, J., Meng, C. G., Yan, Y. H., Shan, Y. N., Kan, J., & Jin, C. H. (2016). Structure, physical property and antioxidant activity of catechin grafted Tremella fuciformis polysaccharide. International Journal of Biological Macromolecules, 82, 719–724. https://doi.org/https://doi.org/10.1016/j.ijbiomac.2015.11.027
- Mao, G. H., Zou, Y., Feng, W. W., Zhao, T., Ye, C. W., Zhu, Y., Wu, X. S., Yang, L. Q., & Wu, X. Y. (2014). Extraction, preliminary characterization and antioxidant activity of Se-enriched Maitake polysaccharide. Carbohydrate Polymers, 101, 213–219. https://doi.org/https://doi.org/10.1016/j.carbpol.2013.09.034
- Marcotte, M., Hoshahili, A. R. T., & Ramaswamy, H. S. (2001). Rheological properties of selected hydrocolloids as a function of concentration and temperature. Food Research International, 34(8), 695–704. https://doi.org/https://doi.org/10.1016/S0963-9969(01)00091-6
- Oliveira, J. D., Silva, D. A., de Paula, R. C. M., Feitosa, J. P. A., & Paula, H. C. B. (2001). Composition and effect of salt on rheological and gelation properties of Enterolobium contortisilliquum gum exudates. International Journal of Biological Macromolecules, 29(1), 35–44. https://doi.org/https://doi.org/10.1016/S0141-8130(01)00151-9
- Reshetnikov, S. R., Wasser, S. P., Duckman, I., & Tsukor, K. (2000). Medicinal value of the genus Tremella pers. (Heterobasidiomycetes). International Journal of Medicinal Mushrooms, 2(3), 169–193. https://doi.org/https://doi.org/10.1615/IntJMedMushr.v2.i3.10
- Schmitt, C., & Turgeon, S. L. (2011). Protein/polysaccharide complexes and coacervates in food systems. Advance in Colloid and Interface Science, 167(1–2), 63–70. https://doi.org/https://doi.org/10.1016/j.cis.2010.10.001
- Shen, T., Duan, C., Chen, B. D., Li, M., Ruan, Y., Xu, D. N., Shi, D. D., Yu, D., Li, J., & Wang, C. T. (2017). Tremella fuciformis polysaccharide suppresses hydrogen peroxide-triggered injury of human skin fibroblasts via upregulation of SIRT1. Molecular Medicine Reports, 16(2), 1340–1346. https://doi.org/https://doi.org/10.3892/mmr.2017.6754
- Shi, Z. W., Liu, Y., Xu, Y., Hong, Y. R., Liu, Q., Li, X. L., & Wang, Z. G. (2014). Tremella polysaccharides attenuated sepsis through inhibiting abnormal CD4+ CD25high regulatory T cells in mice. Cellular Immunology, 288(1–2), 60–65. https://doi.org/https://doi.org/10.1016/j.cellimm.2014.02.002
- Tabasi, S. N., & Razavi, S. M. A. (2017). New studies on basil (Ocimum bacilicum L.) seed gum: Part III – steady and dynamic shear rheology. Food Hydrocolloids, 67, 243–250. https://doi.org/https://doi.org/10.1016/j.foodhyd.2015.12.020
- Tao, R. X., Jia, D. Y., Yao, K., & Chi, Y. L. (2015). Extraction of polysaccharide from Tremella fuciformis under high pressure. Food Science and Technology, 40(6), 229–233. https://doi.org/https://doi.org/10.13684/j.cnki.spkj.2015.06.053
- Ukai, S., Hirose, K., Kiho, T., Hara, C., Irikura, T., Kanechika, T., & Hasegawa, Y. (1972). Antitumor activity on sarcoma 180 of the polysaccharides from Tremella fuciformis Berk. Chemical and Pharmaceutical Bulletin, 20(10), 2293–2294. https://doi.org/https://doi.org/10.1248/cpb.20.2293
- Vardhanabhuti, B., & Ikeda, S. (2006). Isolation and characterization of hydrocolloids from monoi (Cissampelos pareira) leaves. Food Hydrocolloids, 20(6), 885–891. https://doi.org/https://doi.org/10.1016/j.foodhyd.2005.09.002
- Wang, L., Wu, Q., Zhao, J. Y., Lan, X. Y., Yao, K., & Jia, D. Y. (2021). Physicochemical and rheological properties of crude polysaccharides extracted from Tremella fuciformis with different methods. CyTA-Journal of Food, 19(1), 247–256. https://doi.org/https://doi.org/10.1080/19476337.2021.1884607
- Wang, S. N., Zhao, L. L., Li, Q. H., Liu, C., Han, J. L., Zhu, L. J., Zhu, D. S., He, Y. T., & Liu, H. (2019). Rheological properties and chain conformation of soy hull water-soluble polysaccharide fractions obtained by gradient alcohol precipitation. Food Hydrocolloids, 91, 34–39. https://doi.org/https://doi.org/10.1016/j.foodhyd.2018.12.054
- Wang, W. H., Li, C., Du, G. H., Zhang, X. L., & Zhang, H. J. (2017). Characteristics and rheological properties of polysaccharide nanoparticles from edible mushrooms (Flammulina velutipes). Journal of Food Science, 82(3), 687–693. https://doi.org/https://doi.org/10.1111/1750-3841.13626
- Wang, X. M., Zhang, Z. S., & Zhao, M. X. (2015). Carboxymethylation of polysaccharides from Tremella fuciformis for antioxidant and moisture-preserving activities. International Journal of Biological Macromolecules, 72, 526–530. https://doi.org/https://doi.org/10.1016/j.ijbiomac.2014.08.045
- Wu, Y. B., Ding, W., Jia, L. R., & He, Q. (2015). The rheological properties of tara gum (Caesalpinia spinosa). Food Chemistry, 168, 366–371. https://doi.org/https://doi.org/10.1016/j.foodchem.2014.07.083
- Wu, Y. J., Wei, Z. X., Zhang, F. M., Linhardt, R. J., Sun, P. L., & Zhang, A. Q. (2019). Structure, bioactivities and applications of the polysaccharides from Tremella fuciformis mushroom: A review. International Journal of Biological Macromolecules, 121, 1005–1010. https://doi.org/https://doi.org/10.1016/j.ijbiomac.2018.10.117
- Xu, L., Qiu, Z., Gong, H. J., Zhu, C. F., Li, Z. J., Li, Y. J., & Dong, M. Z. (2019). Rheological behaviors of microbial polysaccharides with different substituents in aqueous solutions: Effects of concentration, temperature, inorganic salt and surfactant. Carbohydrate Polymers, 219, 162–171. https://doi.org/https://doi.org/10.1016/j.carbpol.2019.05.032
- Xu, Y. Q., Liu, N. Y., Fu, X. T., Wang, L. X., Yang, Y., Ren, Y. Y., Liu, J. Y., & Wang, L. B. (2019). Structural characteristics, biological, rheological and thermal properties of the polysaccharide and the degraded polysaccharide from raspberry fruits. International Journal of Biological Macromolecules, 132, 109–118. https://doi.org/https://doi.org/10.1016/j.ijbiomac.2019.03.180
- Yang, B., Wu, Q. J., Luo, Y. X., Yang, Q., Chen, G. J., Wei, X. Y., & Kan, J. Q. (2019). Japanese grape (Hovenia dulcis) polysaccharides: New insight into extraction, characterization, rheological properties, and bioactivities. International Journal of Biological Macromolecules, 134, 631–644. https://doi.org/https://doi.org/10.1016/j.ijbiomac.2019.05.079
- Yang, Z., Yang, H. J., & Yang, H. S. (2018). Effects of sucrose addition on the rheology and microstructure of κ-carrageenan gel. Food Hydrocolloids, 75, 164–173. https://doi.org/https://doi.org/10.1016/j.foodhyd.2017.08.032
- Zhang, Q., Yuan, Y., Deng, Y. L., Zhou, Y. X., & Li, Y. F. (2019). Monosaccharide composition analysis and antioxidant activity comparison of polysaccharides from Tremalla fuciformis cultivated in different methods. Science and Technology of Food Industry, 40(8), 54–60. https://doi.org/https://doi.org/10.13386/j.1002-0306.2019.08.010
- Zhang, Y. K., Zhang, Q., Lu, J., Xu, J. L., Zhang, H., & Wang, J. H. (2017). Physicochemical properties of Tremella fuciformis polysaccharide and its interactions with myofibrillar protein. Bioactive Carbohydrates and Dietary Fibre, 11, 18–25. https://doi.org/https://doi.org/10.1016/j.bcdf.2017.06.002
- Zhao, M. M., Yang, N., Yang, B., Jiang, Y. M., & Zhang, G. H. (2007). Structural characterization of water-soluble polysaccharides from Opuntia monacantha cladodes in relation to their anti-glycated activities. Food Chemistry, 105(4), 1480–1486. https://doi.org/https://doi.org/10.1016/j.foodchem.2007.05.031