
 ?Mathematical formulae have been encoded as MathML and are displayed in this HTML version using MathJax in order to improve their display. Uncheck the box to turn MathJax off. This feature requires Javascript. Click on a formula to zoom.
ABSTRACT
This paper investigated the effect of freezing methods on moisture distribution, freshness, protein properties, and microstructure of large yellow croaker (Pseudosciaena crocea) during freezing and frozen (−18°C) storage. The methods of freezing include, refrigerator freezing (RF), plate freezing (PF), spiral freezing (SF), immersion freezing (IF), and liquid nitrogen freezing (NF). The results showed that RF took the longest time, 587.3 min, and the freezing rate of PF, SF, IF and NF was more than ten times that of RF. In general, the SF, IF, and NF have better-related quality characteristics during 90 days of frozen storage, with a small change in quality compared to day 5, but for water distribution, IF performed poorly. For microstructure and protein-related characteristics, NF somewhat destroyed the fiber of muscle and the structure of the myofibrillar protein. In conclusion, SF was a worthy method to maintain the quality of large yellow croaker fish during freezing.
Resumen
En este trabajo se investigó el efecto de los métodos de congelación sobre la distribución de humedad, la frescura, las propiedades proteicas y la microestructura de la corvina amarilla grande (Pseudosciaena crocea) durante el proceso de congelación y su almacenamiento congelado (a −18°C). Los métodos de congelación aplicados incluyen la congelación en frigorífico (RF), la congelación en placa (PF), la congelación en espiral (SF), la congelación por inmersión (IF) y la congelación con nitrógeno líquido (NF). Los resultados dieron cuenta de que la RF fue el método que tardó más tiempo, 587.3 minutos, mientras la velocidad de congelación de la PF, SF, IF y NF fue más de diez veces superior a la de la RF. En general, se constató que la SF, la IF y la NF preservaron mejor las características de calidad en el producto durante los 90 días en que se extendió su almacenamiento congelado, registrándose un pequeño cambio en la calidad en comparación con el día 5. En cambio, respecto a la distribución del agua, el IF obtuvo malos resultados. En cuanto a la microestructura y las características relacionadas con las proteínas, la NF destruyó un poco la fibra del músculo y la estructura de la proteína miofibrilar. En conclusión, la SF resultó ser el método más adecuado para conservar la calidad de las corvinas grandes durante su congelación.
1. Introduction
Marine fish is popular among consumers because of its high nutritional value and delicious taste. The sales of marine fish are currently increasing, and as one of the most productive types of farmed marine fish, the large yellow croaker has become one of the most important marine fish, especially in China (Cai et al., Citation2020). According to a report in 2020 (Anonymous, Citation2020), the farmed production of large yellow croaker reached 225,549 tons in 2019, accounting for about 14% of the total marine fish farm in 2019. However, the high moisture content, the microenvironment suitable for microbial growth and the rich nutrient content lead to short shelf life (Abdollahi et al., Citation2014).
Freezing followed by frozen storage is becoming a useful technique for preserving fish without significant quality deterioration because this method effectively inhibits microbial and enzymatic activity, slows down the process of unsaturated fatty acid and soluble protein degradation of the product while making stored products easier to use over long distances (Li et al., Citation2020). However, several parameters, including the freezing temperature and freezing rate, can affect the quality of the product because if the biochemical reactions within the product do not achieve maximum inhibition, the sample will continue to undergo lipid oxidation, protein denaturation. to varying degrees, ultimately affecting the quality of the product (English et al., Citation2020).
The common freezing methods include cold store freezing, immersion freezing, liquid nitrogen freezing. Cold store freezing uses cold air of −33°C and the airspeed of 3 m/s in the form of convection to lower the temperature of the products. The freezing process requires an extremely long time because the heat transfer coefficient of air is very low. Spiral freezing is a special type of cold store freezing, which has the advantage that the air temperature can reach −40°C and the air speed can reach more than 8 m/s. Liquid nitrogen freezing is considered a promising technology because of its extremely low phase change temperature (−196°C), which can cause the temperature of food to drop rapidly. However, the very fast freezing speed maybe lead to an increase in the instantaneous temperature difference between the surface and the interior of the aquatic product, which generates a large expansion pressure and leads to the destruction of the food structure and affects its quality. The high cost of liquid nitrogen also limits its application in freezing processes to some extent. Immersion freezing is a less applied freezing method than air freezing and liquid nitrogen freezing, compared to a method with a suitable freezing temperature (−40°C). At the same time, immersion freezing is the use of liquid secondary refrigerant,; the food is in direct contact with the secondary refrigerant, which can greatly improve the rate of food freezing. Another advantage is that the impregnating liquid can be recycled and therefore has a lower cost. However, the quality of food is easily affected by the impregnating liquid. Horizontal and vertical cooling plate refrigeration units are commonly used on fishing vessels (Lee et al., Citation2015)
Whilst the research on fish freezing and storage continues, little information is available on the effects of freezing methods and storage time on large yellow croaker. The aim of this article is to investigate the effect of different freezing methods on the quality of large yellow croaker. In order to recommend a suitable freezing method, five freezing methods, namely, refrigerator freezing, plate freezing, spiral freezing, immersion freezing, and nitrogen freezing were compared, and a study on the physicochemical properties, protein characteristics, and freshness of large yellow croaker were made, in order to provide a reference for the freezing preservation of large yellow croaker.
2. Materials and methods
2.1. Preparation of large yellow croaker
Fresh large yellow croakers of about 650 g each were purchased from the Shanghai Luchao Port seafood market and transported back to the laboratory in fresh condition (42 pieces in total, 2 of which were used for fresh testing), slaughtered, gutted, rinsed, dried, and packed in sealed bags and pre-chilled to 4°C in a refrigerator for further experiments.
2.2. Freezing process and freezing temperature curve
Forty large yellow croakers were randomly divided into five groups and treated separately. In order to evaluate the effect of different freezing methods on the quality of large yellow croaker, five different freezing methods with different temperatures were used. Refrigerator freezing group (AF): samples were placed in −20°C refrigerator for freezing. Flat plate freezing group (PF): the large yellow croaker was laid flat in trays and put into the plate freezer (PF-500, Nantong Sinrofreeze equipment CO., Ltd, Jiangsu, China) freezing at −30°C. Spiral freezing group (SF): the large yellow croaker was placed on the conveyor belt of the spiral freezer (Yantai Moon Co., Ltd, Shandong, China freeze at −40°C with a fan frequency of 50 kHz. Salt solution immersion freezing group (IF): CaCl2 with a mass concentration of 29.3% was used as the non-freezing liquid, and the large yellow croaker was submerged in the non-freezing liquid to freeze at a freezing temperature of −40°C. Liquid nitrogen freezing group (NF): the large yellow croaker was put into a steel container and continuously injected with liquid nitrogen for freezing, and the freezing temperature was −196°C. In order to monitor the internal temperature change of large yellow croaker during the freezing process, a piercing temperature probe (2640A, Fluke, USA) was inserted into the fish to detect the temperature at an interval of 10s, and the temperature reached −18°C was regarded as the endpoint of freezing. After the freezing process, the fish was transferred to −18°C and kept for 90 d, and the samples were evaluated at 5 d, 30 d, 60 d, 90 d.
2.3. Water holding capacity (WHC)
2.3.1. Thawing loss
The thawing loss was determined according to the method of Sun et al. (Citation2019). In brief, the mass W1 before thawing and the mass W2 after thawing were weighed, and each measurement was taken in triplicate, and the thawing loss was calculated as a percentage loss in weight with the following equation:
2.3.2. Centrifugal loss
Referring to the method ofTan et al. (Citation2019), about 2 g of thawed fish pieces were weighed, and the centrifugal loss of the samples was calculated from the mass of the fish pieces before centrifugation (W3) and the mass after centrifugation (W4), each measurement was taken in triplicate with the following equation:
2.3.3. Cooking loss
Using the method described by Sun, Sun et al. (Citation2019), about 5 g of thawed large yellow croaker pieces (W5) were weighed, packed in a steaming bag, heated in an 85°C water bath for 15 min, dried and weighed on the surface (W6), and each measurement was taken in triplicate, with the steaming loss calculated as follows:
2.4. Low-field nuclear magnetic resonance (LF-NMR)
The method described by Tan et al. (Citation2019). was used with slight modifications. Briefly, the thawed dorsal backbone portion of large yellow croaker was taken, cut into 2 cm × 2 cm × 1 cm pieces, cling film wrapped and then measured in triplicate for each measurement using an LF-NMR analyzer (MesoMR23-060 H.I, NiuMeng, Shanghai, China). The specific parameters are set as follows: receiver bandwidth frequency (SW) = 100 kHz, SF = 21 MHz, RFD = 0.08 ms, RG1 = 20 db, P1 = 19 us, DRG1 = 6, TD = 400,100, DR = 1, TW = 2,000 ms, NS = 4, P2 = 37 us, TE = 0.5 ms and NECH = 8000.
2.5. Determination of total volatile base nitrogen (TVB-N)
TVB-N values were determined according to the method indicated by Li et al. (Citation2020) with slight modifications by accurately weighing 5 g of fish, adding it to a Kjeldahl tube together with 1.5 g of MgO, and analyzing it using a Kjeldahl nitrogen tester (Kjeltec 8400, Foss, Denmark). The results of the experiment were obtained in triplicate. The measurement results were expressed as mg N/100 g of large yellow croaker sample.
2.6. Determination of free amino acids (FAAs)
Myofibrillar proteins (MP) was extracted according to the method of Li, Chen et al. (Citation2020) with slight modifications. Accurately weigh 2 g of ground fish with 20 mL of 20 mmol/L Tris-HCl buffer (containing 0.1 mol/L KCl, pH 7.5), centrifuge at 10,000 r/min for 15 min, discard the supernatant, and repeat twice. Add 20 mL of 20 mmol/L Tris-HCl buffer (containing 0.6 mol/L KCl, pH 7.0) to the precipitate, homogenize, extract for 3 h at 4°C, centrifuge at 8000 r/min for 10 min at low temperature, and take the supernatant as myofibrillar proteins. FAAs were measured in triplicate using the method of Li et al. Their content was determined by using an automatic amino acid analyzer (Hitachi L-8800, Tokyo, Japan).
2.7. Fourier transform infrared absorption spectroscopy (FT-IR)
The analysis of protein secondary structure was done using FT-IR analysis (Nicolet 380, Thermo Scientific Inc., Waltham, MA, USA), scanning samples from 500 to 4000 cm−1 with a resolution of 1 cm−1, using OMNIC Professional version 8.0, with test results in duplicate.
2.8. Fluorescence emission spectra
The analysis of protein tertiary structure was done using fluorescence spectroscopy analysis, referring to the method of Shi et al. (Citation2019). Myofibrillar proteins were extracted according to the method in section 2.6, and MP was dissolved in 0.6 mol/L NaCl for dilution and measured using a fluorescence spectrophotometer (Hitachi F-7100, Tokyo, Japan).
2.9. Microstructure observation
The size of ice crystals in large yellow croaker samples was observed by scanning electron microscopy (SEM). The samples were processed concerning Syamaladevi et al. (Citation2012), frozen large yellow croaker was cut to the size of 5 mm*5 mm*3 mm, lyophilized in a freeze dryer and the surface and cross-sectional microstructures were visualized under scanning electron microscopy (SU5000, HITACHI, Japan) with an accelerating voltage of 5 kV.
The light microscope observation was based on the method of Jiang et al. (Citation2020) with slight modifications. A 5 mm × 5 mm × 3 mm piece of fish dorsal muscle was taken and fixed in Carnoy solution (anhydrous ethanol: toluene: glacial acetic acid = 6:3:1) for 24 hours (stored at −18°C). After draining and gradient elution with anhydrous ethanol, the treatment was repeated three times using xylene immersion for 15 min for transparency. Subsequently, the samples were soaked in molten paraffin at 70°C for 1 h and then fixed in molds. The fixed samples were then cut into 10 μm slices, flattened on slides and dried in an oven at 70°C for 2 days to remove the paraffin. The samples were then eluted with xylene for 15 min and repeated twice. Xylene was removed by rinsing with anhydrous ethanol. Finally, the samples were stained with hematoxylin-eosin and observed under a light microscope (Eclipse E200, Nikon, Japan).
2.10. Statistical analysis
All experiments were performed with three replicate measurements unless otherwise specified and analyzed by analysis of variance (ANOVA) using Excel and SPSS 26.0 (SPSS Inc., Chicago, IL, USA), and significance analysis was detected at the 5% level using Tukey’s multiple range test. A significant difference was indicated as PP<.05. The final results were expressed as the means ± SD. Graphing with Origin 2021.
3. Results and discussion
3.1. Freezing process
To facilitate the understanding of the characteristics of large yellow croaker during freezing, temperature curves are usually used to observe. The freezing curves and the time of different freezing periods are shown in and , respectively. There was a significant difference (P < .05) in the total freezing time (4°C to −18°C) for the different freezing methods. The total freezing time of RF was the longest, reaching 587.3 min, which was more than 10 times those of the other groups. The main reasons for such results were the lower freezing temperature of −20°C in the refrigerator and the low heat transfer coefficient of air.
Table 1. Time spent in different freezing periods with different frozen treatments of large yellow croaker.
Tabla 1. Tiempo de permanencia en diferentes periodos de congelación aplicando diferentes tratamientos de congelación a la corvina amarilla grande
Figure 1. Freezing curves of large yellow croaker with different freezing treatments. RF, refrigerator freezing; PF, plate freezing; SF, spiral freezing; IF, immersion freezing; NF, nitrogen freezing.
Figura 1. Curvas de congelación de la corvina amarilla grande a la que se aplicaron diferentes tratamientos de congelación. RF, congelación en frigorífico; PF, congelación en placa; SF, congelación en espiral; IF, congelación por inmersión; NF, congelación por nitrógeno
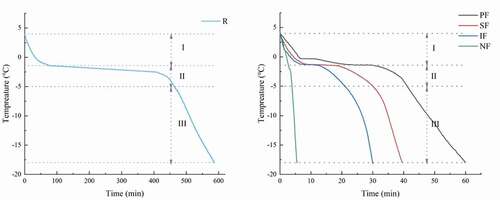
The freezing times of PF, SF, IF, and NF were 58.7 min, 39.81 min, 32.57 min, and 4.75 min, in order. Although the plate freezing was done by direct heat transfer from the refrigeration plate, the freezing temperature was slightly higher than those of IF and SF. IF had a shorter freezing time compared to SF because the freezing medium of IF was liquid and the heat transfer rate was faster. The super low temperature of liquid nitrogen −196°C enabled the large yellow croaker to freeze completely in less than 5 min. The results showed that a lower freezing temperature could significantly reduce the freezing time, while the freezing medium can also affect on the freezing time.
The freezing curve can usually be divided into three stages, which include the pre-cooling stage (4 to −1.3°C), the phase transition stage (−1.3 to −5°C) and the sub-cooling stage (−5 to −18°C), corresponding to the three regions I, II and III in (Sun, et al., Citation2019). The phase transition stage is the stage in which the quality of the product is relevant, and due to most ice crystals produced in this stage (B. Xu et al., Citation2015), so it is important to freeze quickly through the phase change stage. As shown in , the phase transition time of RF was 409.17 min, which was more than 20 times of the other groups, and therefore was not a recommended freezing method. Ultra-low temperature freezing can produce fine and uniform ice crystals and produce the least ultrastructural displacement (Jiang et al., Citation2020), so PF, SF, IF, and NF can maintain the quality of large yellow croaker better compared with RF.
3.2. Microstructure of muscle fibers
The muscles of fish are highly susceptible to the growth of ice crystals during the freezing process. In general, small and uniform ice crystals produced during freezing are considered better quality because they cause minimal mechanical damage to the fish flesh (Herrero et al., Citation2005; Jiang et al., Citation2020). Therefore, the mechanical damage due to ice crystal growth can be determined by observing the microscopic morphology of the myogenic fibers of fish treated in the freezing process. shows the light microscopic observation (cross-section) at 40x magnification (a) and scanning electron microscopic (SEM) observation (longitudinal section) at 100x magnification (b) at the initial (5 d) and end of frozen storage (90 d).
Figure 2. Light microscope observation (a, magnification ×40) and scanning electron microscope observation (b, magnification ×100) of frozen large yellow croaker.
Figura 2. Observación al microscopio óptico (a, aumento ×40) y al microscopio electrónico de barrido (b, aumento ×100) de la corvina amarilla grande congelada
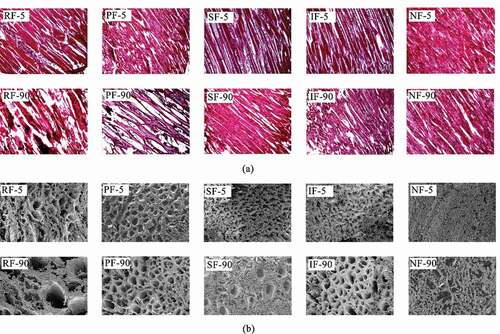
In the early stage of frozen storage, there were no significant differences between the groups except for NF, in which the cross-section and longitudinal section were closely arranged without large gaps. With the extension of frozen storage time to 90d, the gaps between the muscle fibers in the RF group increased significantly and gradually separated, followed by the PF group. The SF and IF groups hardly found any obvious gaps, and were basically the same as the NF group samples in the late stage of cold store. The changes in the longitudinal section of large yellow croaker were consistent with those in the transverse section, and after 90 d of cold store, the ice crystals in the RF group grew large enough to destroy the structure of the muscle fibers relatively severely, while only a small number of large ice crystals were produced in the SF group. However, it was of interest to note that, although the NF group had the densest ice crystals compared to the other groups, their muscle fibers were severely damaged during the freezing process, probably due to the expansion pressure caused by the extremely low freezing temperature, which led to muscle fiber rupture. Microstructural analysis showed that SF could effectively reduce the mechanical damage and maintain the morphology of muscle fibers during the freezing of large yellow croaker.
3.3. Changes in water holding capacity (WHC)
Thawing loss is a remarkably important indicator in the frozen food industry; the loss of water and nutrients during thawing affects the quality of fish (Olsson et al., Citation2003). As shown in ), the thawing loss rates on 5 d were 2.41%, 2.03%, 1.64%, 1.59%, and 1.60% for RF, PF, SF, IF, and NF, respectively. During the 90 d period of frozen storage increased to 5.58%, 3.46%, 2.85%, 2.61%, and 2.57% respectively. The highest thawing loss rate was observed for RF, which increased by 2.32 times compared to that of 5 d. This was because RF had the slowest freezing rate, long time to pass through the phase change stage, and massive ice crystal growth, causing extrusion damage and outward water seepage. Due to the similar freezing temperatures and freezing rates of SF, IF, there was no significant difference (P < .05) in thawing loss. Although NF had a very fast freezing rate, its thawing loss was similar to SF and IF, which had the same results of Z. Xu et al. (Citation2014). When fish was directly exposed to extremely low temperatures such as liquid nitrogen, an ice layer was rapidly formed on the surface. This hindered the volume expansion of the unfrozen phase inside the fish, and the internal stress caused by temperature inhomogeneity gradually increases. When the internal stress rose to a certain level, the internal seams or weak parts of the fish would rupture, leading to low-temperature fracture and moisture loss.
Figure 3. Thawing loss (a), centrifugal loss (b), and cooking loss (c), T2 relaxation time (d) and magnetic resonance imaging (e) of large yellow croaker with different freezing treatments. The means between freezing methods on the same days with different uppercase letters (A-D) differ significantly (p < .05), the means for the same freezing method with different lowercase letters (a-d) differ significantly (p < .05). RF, refrigerator freezing; PF, plate freezing; SF, spiral freezing; IF, immersion freezing; NF, nitrogen freezing.
Figura 3. Pérdida por descongelación (a), pérdida por centrifugación (b) y pérdida por cocción (c), tiempo de relajación T2 (d), e imágenes por resonancia magnética (e) de la corvina amarilla grande a la que se aplicaron diferentes tratamientos de congelación. Las medias para el mismo método de congelación con diferentes letras mayúsculas (A-D) difieren significativamente (p < 0.05); las medias correspondientes al mismo método de congelación con diferentes letras minúsculas (a-d) difieren significativamente (p < 0.05). RF, congelación en frigorífico; PF, congelación en placa; SF, congelación en espiral; IF, congelación por inmersión; NF, congelación por nitrógeno
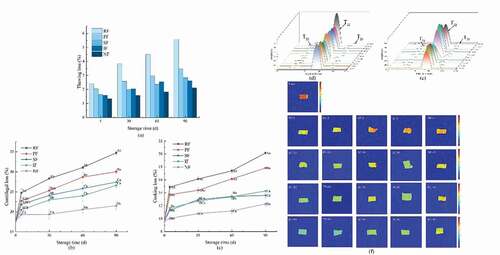
and c) represent the changes in centrifugal loss and cooking loss of large yellow croaker during the 90 d freezing periods, respectively. It was clear that both centrifugal loss and cooking loss showed a significant increase (P < .05) throughout the freezing period. RF had the most severe and fastest increasing loss compared to the other groups, followed by PF. There was no significant difference (P > .05) between SF and IF, and these results were consistent with that of thawing loss.
3.4. Water distribution
Water distribution is another very important indicator to explain the water holding capacity of fish, which is usually determined by LF-NMR. As shown in and e), the T2 relaxation times of large yellow croaker were concentrated in the distribution of 0–10 ms, 10–100 ms, and 100–1000 ms. T21 (0–10 ms) was defined as the bound water tightly bound to the hydrophilic groups on protein side chains and macromolecules, and T22 (10–100 ms) represented the fixed water physically retained by the myogenic fiber structure. T23 (100–1000 ms) represented the most mobile water outside the myofibrils, which was called free water.
shows the T2 relaxation times and relative proportions (P2) of large yellow croaker. From the table, it was observed that the T21 relaxation time gradually increased during the 90 d frozen storage. The T21 values of all groups showed a significant increase and difference (P < .05) after 30 d of freezing, in descending order of RF, PF, NF, IF, SF. The change in T21 relaxation time was associated with the degeneration of myogenic fibers (Sun, Sun et al., Citation2019), and the amount of water through non-covalent interaction decreased when the structure of protein changed during the process of frozen storage (Rao et al., Citation2018). The large ice crystals in the RF samples disrupted the cell structure. They released the cell contents, thus accelerating the denaturation of proteins, so that the group maintained the highest T21 values throughout the 90 d of frozen storage, and the SF samples had the shortest T21 relaxation time, indicating that the SF samples had the least space for bound water and the lowest mobility. In addition to this, the growth of ice crystals caused damage to the cells, the movement of bound and less mobile water to free water, and the increase in free content, which was reflected in the peak area of free water (P23). There was no significant change (P > .05) in the value of T22 between the different freezing methods, but there was a significant difference (P < .05) in the content of non-fluidizable water (P22). The RF was the lowest, probably due to the long freezing time caused contraction of the reticular structure of the myogenic fibers and weakened their ability to absorb water. It also caused a decrease in the electrostatic charge of the protein, which weakened its hydration and caused the movement of less mobile water to free water and increased free water content (Bertram et al., Citation2001). Therefore, it could be shown that SF and IF can well delay the water loss in the process of frozen storage from the experimental results of T2 relaxation time and relative proportions in , which was consistent with the research results of water holding capacity.
Table 2. The TVB-N and T2 transverse relaxation time and peak scales of large yellow croaker with different freezing treatments.
Tabla 2. Tiempo de relajación transversal TVB-N y T2 y escalas de pico de la corvina amarilla grande a la que se aplicaron diferentes tratamientos de congelación
Nuclear magnetic resonance imaging (MRI) can visualize the water distribution and migration in the internal tissues of fish during processing and is now widely used (Nian et al., Citation2019). The corresponding pseudo-color images are shown in ), in which red indicates high proton signal density and blue indicates low proton signal density (Cheng et al., Citation2019). It could be seen that the red signals of MRI images of fish meat in each group after freezing were significantly reduced relative to those of fresh samples, indicating that there was a loss of moisture during the frozen storage., and the loss of water became more severe with the increase of storage time. The red signal of the pseudo-color images was consistently higher in the SF and NF groups with the least moisture loss and the most severe moisture loss in the RF group during the 90 d of frozen storage. It was of interest that for MRI, the IF group did not perform satisfactorily, probably because CaCl2 entered the bag during the freezing process, which led to the formation of osmotic pressure difference in the fish cells, and all three forms of water loss were produced to different degrees.
3.5. TVB-N
The sum of primary, secondary and tertiary amines in volatile amines and toxic nitrogen compounds is classified as TVB-N compounds (Bekhit et al., Citation2021). TVB-N has been widely used in determining the freshness of fish, and the National Standard of the People’s Republic of China (PRC) (SC/T 3101–2010) always stipulates that the acceptable range of TVB-N values for large yellow croaker is below 30 mg N/100 g, and value below 13 mg N/100 g is considered as first-grade freshness standard. The TVB-N values of large yellow croaker during three months of storage in the five freezing methods are shown in , and the TVB-N value of fresh samples was 8.02 mg N/100 g. During the 90 d of cold store, the TVB-N values of all five freezing methods increased significantly, and at day 90, the samples of RF, PF were no longer in the category of first-grade freshness standard. There was no significant difference (P > .05) in SF and IF, 12.70 mg N/100 g and 12.43 mg N/100 g, respectively, which were still in the range of first-grade freshness standard. The values of NF were always the lowest and the best performers during the 90 d of freezing. This was similar to the results of Jiang et al. (Citation2020) who found grass carp frozen by air-blast freezing (AF) had TVB-N values higher than the limit for fresh grass carp that in the 12th week,, while grass carp frozen immersion freezing (IF), and liquid nitrogen freezing (LNF) did not exceed the maximum limit.
3.6. FAA analysis
FAA may change during processing and storage, which is really important because certain FAA are essential for biogenic amine production (Özden, Citation2005). At the same time, FAA is also an important contributor to the development of flavors involved in fish products, which can provide different taste characteristics such as freshness, sweetness and bitterness (Yu et al., Citation2021). The FAA content of large yellow croaker at the beginning and end of frozen storage is shown in . Most of the FAA a3nd total FAA showed an upward trend. Among them, SF could best control the degradation of protein during storage and delay the increase of free amino acid content. The major FAAs in large yellow croaker were Glycine (Gly), Alanine (Ala), and Lysine (Lys), accounting for 40.85 to 59.30% of the total FAA content and contributing to the taste of the fish (Li, et al., Citation2020). Histidine (His) is an amino acid that presents a bitter taste and the content of His was below 5 mg/100 g in all periods, but different freezing methods during the same period resulted in significantly different results (P < .05) of His content. Both at the beginning and at the end of frozen storage, the RF group maintained the highest His content and the IF and SF groups maintained the lowest content.
Table 3. FAA content of large yellow croaker with different freezing treatments.
Tabla 3. Contenido de FAA de la corvina amarilla grande a la que se aplicaron diferentes tratamientos de congelación
Based on the study of Chen and Zhang (Citation2007) and taking into account the different thresholds of FAA ()), the taste activity value (TAV) presenting bitterness was calculated and used to further respond to the effect of different freezing methods on the flavor characteristics of large yellow croaker. The TAV-bitter calculated from the eight bitter-presenting amino acids, mainly lysine, is shown in ). The TAV-bitter of each group showed significant difference (P < .05) at 5 d, and the IF group’ was the lowest. At 90 d, the TAV-bitter all showed a significant increase, with the IF group maintaining the lowest TAV-bitter value throughout this period, followed by the SF group. It was of interest that fresh fish had a higher TAV-bitter, which may be due to the fact that fish undergoes the freezing-thawing process and some FAA was lost with moisture, resulting in lower actual measured values. In summary, the results showed that IF and SF could delay the degradation of protein and the accumulation of bitterness during the frozen storage of large yellow croaker.
Figure 4. The thresholds of different amino acids taste (a), and changes in bitterness-TAV (b) of large yellow croaker with different freezing treatments. RF, refrigerator freezing; PF, plate freezing; SF, spiral freezing; IF, immersion freezing; NF, nitrogen freezing.
Figura 4. Umbrales de sabor de diferentes aminoácidos (a), y cambios en el amargor-TAV (b) de la corvina amarilla grande a la que se aplicaron diferentes tratamientos de congelación. RF, congelación en frigorífico; PF, congelación en placa; SF, congelación en espiral; IF, congelación por inmersión; NF, congelación por nitrógeno
3.7. MP secondary structure
FT-IR spectra can be used to estimate the secondary structure of MP by examining the amide I region (1700–1600 cm−1), which provides some information on the scaling of, for example, α-helices, β-sheets, β-turns and random coils (Kobayashi et al., Citation2017; Wang et al., Citation2020). The overall appearance of the FT-IR spectra of the 11 samples in the amide I region was similar ()), so for a better evaluation, the amide I region was selected after deconvolution, second-order derivatives, and iterative curve fitting produced information on individual peaks ()), assigning α-helices, β-sheets, β-turns, and random coils to the corresponding central bands, respectively.
Figure 5. FT-IR spectral curves (a), iterative curve-fitted (b), the contents of α-helices, β-sheets, β-turns and random coils (c), and Intrinsic fluorescence intensity (IFI) (d) of MP. RF, refrigerator freezing; PF, plate freezing; SF, spiral freezing; IF, immersion freezing; NF, nitrogen freezing.
Figura 5. Curvas espectrales FT-IR (a), curva iterativa ajustada (b), contenido de α-hélices, β-hojas, β-giros y bobinas aleatorias (c), intensidad de fluorescencia intrínseca (IFI) (d) de MP. RF, congelación en frigorífico; PF, congelación en placa; SF, congelación en espiral; IF, congelación por inmersión; NF, congelación en nitrógeno
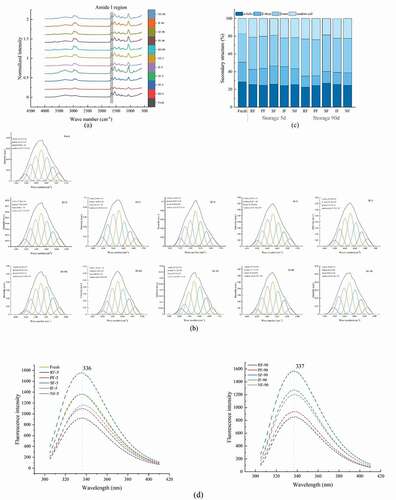
The ratios of α-helices (1650–1660 cm−1), β-sheets (1600–1640 cm−1), β-turns (1660–1700 cm−1) and random coils (1640–1650 cm−1) could be analyzed by the peak areas in ), and the ratios of the four structures were displayed in ). Z. Zhang et al. (Citation2017) found that the intra-hydrogen and inter-hydrogen bonds in the peptide chain could stabilize α -helix, β-sheets, respectively. At the same time, high content of α – helices and β – sheets could represent the secondary structure of MP with high stability. From ), it could be seen that with the storage of the samples, there was no obvious difference in α-helices, but the content of β-sheets decreased to some extent, which indicated that the inter-hydrogen bonds in the peptide chains were destroyed during the freezing storage, and also meant that the protein-protein interactions were weakened during the freezing storage. Comparing different freezing methods at the same storage time could reveal that the SF had a higher content of α-helices, β-sheets than other groups throughout the frozen storage, which implied that the relative stability of its MP secondary structure was the best, followed by IF and NF, and the RF group was the least stable. This may be related to the water loss of large yellow croaker, and the group with more water loss would expose more hydrophobic groups, increasing the surface hydrophobicity and leading to accelerated protein degradation (J. Zhang et al., Citation2020).
3.8. MP tertiary structure
Due to the higher inherent quantum yield and environmental sensitivity of tryptophan residues, the fluorescence intensity is usually assessed by its polar reflection to the microenvironment to assess the changes in the tertiary structure of MP (Li et al., Citation2021; Royer, Citation2006). The changes in the fluorescence intensity of MP shows in ), the maximum wavelength (λmax) of MP was almost unchanged for each group of samples at the same frozen storage. However, a slight increase in λmax was found after 90 days of frozen storage, which indicated that the buried tryptophan was exposed to a polar environment and the microenvironment of the tryptophan residues in MP changed. The maximum fluorescence intensity (FImax) of SF remained maximum at both the beginning and the end of freezing, which indicated that SF could reduce the damage that occurred in the tertiary structure of MP during frozen, and followed by IF and NF. A notable phenomenon could be found that the fresh group did not possess the highest FImax, and the study by Zhang and Ertbjerg (Citation2019) suggested that it might be that protein-protein binding occurs in MP during freeze-thawing, leading to the actual measured high FImax.
4. Conclusion
In this study, the effects of the quality associated with different freezing methods of large yellow croaker were evaluated. The results showed that NF, IF, SF, and PF all significantly reduced the freezing time compared to freezing in the refrigerator, while SF, NF, and IF maintained good water retention, freshness, and stability of MP secondary and tertiary structures, among others, during 90 days of frozen storage. However, both NF and IF did not perform well in some aspects; for example, NF recorded poor myofibrillar protein structure with FAA, and IF had poor water distribution, etc. In conclusion, SF is the best freezing method to maintain the quality of large yellow croaker. IF might also be a good method if direct contact between the fish and the freezing dip can be avoided.
This paper identified the best freezing method for subsequent studies. Future studies will continue to reveal the effects of some other treatments on the frozen quality of large yellow croaker based on spiral freezing.
Disclosure statement
No potential conflict of interest was reported by the authors.
Additional information
Funding
References
- Abdollahi, M., Rezaei, M., & Farzi, G. (2014). Influence of chitosan/clay functional bionanocomposite activated with rosemary essential oil on the shelf life of fresh silver carp. International Journal of Food Science & Technology, 49(3), 811–818. https://doi.org/https://doi.org/10.1111/ijfs.12369
- Anonymous. (2020). China fishery statistical yearbook (pp. 22–23). China Agricultural Press.
- Bekhit, A. E.-D. A., Holman, B. W. B., Giteru, S. G., & Hopkins, D. L. (2021). Total volatile basic nitrogen (TVB-N) and its role in meat spoilage: A review. Trends in Food Science & Technology, 109, 280–302. https://doi.org/https://doi.org/10.1016/j.tifs.2021.01.006
- Bertram, H. C., Dønstrup, S., Karlsson, A. H., Andersen, H. J., & Stødkilde-Jørgensen, H. (2001). Post mortem energy metabolism and pH development in porcine M. longissimus dorsi as affected by two different cooling regimes. A 31 P-NMR spectroscopic study. Magnetic Resonance Imaging, 19(7), 993–1000. https://doi.org/https://doi.org/10.1016/S0730-725X(01)00412-X
- Cai, X., Zhang, J., Lin, L., Li, Y., Liu, X., & Wang, Z. (2020). Study of a noninvasive detection method for the high-temperature stress response of the large yellow croaker (Larimichthys crocea). Aquaculture Reports, 18, 100514. https://doi.org/https://doi.org/10.1016/j.aqrep.2020.100514
- Chen, D.-W., & Zhang, M. (2007). Non-volatile taste active compounds in the meat of Chinese mitten crab (Eriocheir sinensis). Food Chemistry, 104(3), 1200–1205. https://doi.org/https://doi.org/10.1016/j.foodchem.2007.01.042
- Cheng, S., Wang, X., Li, R., Yang, H., Wang, H., Wang, H., & Tan, M. (2019). Influence of multiple freeze-thaw cycles on quality characteristics of beef semimembranous muscle: With emphasis on water status and distribution by LF-NMR and MRI. Meat Science, 147, 44–52. https://doi.org/https://doi.org/10.1016/j.meatsci.2018.08.020
- English, M. M., Scrosati, P. M., Aquino, A. J., McSweeney, M. B., & Gulam Razul, M. S. (2020). Novel carbohydrate blend enhances chemical and sensory properties of lobster (Homarus americanus) after one-year frozen storage. Food Research International, 137, 109697. https://doi.org/https://doi.org/10.1016/j.foodres.2020.109697
- Herrero, A. M., Carmona, P., García, M. L., Solas, M. T., & Careche, M. (2005). Ultrastructural changes and structure and mobility of myowater in frozen-stored hake (Merluccius merluccius L.) muscle: Relationship with functionality and texture. Journal of Agricultural and Food Chemistry, 53(7), 2558–2566. https://doi.org/https://doi.org/10.1021/jf0490706
- Jiang, Q., Yin, T., Yang, F., Yu, D., Xu, Y., Tie, H., Gao, P., Wang, B., & Xia, W. (2020). Effect of freezing methods on quality changes of grass carp during frozen storage. Journal of Food Process Engineering, 43(11), e13539. https://doi.org/https://doi.org/10.1111/jfpe.13539
- Kobayashi, Y., Mayer, S. G., & Park, J. W. (2017). FT-IR and Raman spectroscopies determine structural changes of tilapia fish protein isolate and surimi under different comminution conditions. Food Chemistry, 226, 156–164. https://doi.org/https://doi.org/10.1016/j.foodchem.2017.01.068
- Lee, J.-C., Jeong, J.-H., Kim, B.-M., Shin, S.-C., Kim, S.-Y., & Jeong, B.-Y. (2015). A study on freezing efficiency improvement of horizontal-plate freezer for fishing vessel. Journal of the Society of Naval Architects of Korea, 52(1), 19–24. https://doi.org/https://doi.org/10.3744/SNAK.2015.52.1.19
- Li, F., Du, X., Ren, Y., Kong, B., Wang, B., Xia, X., & Bao, Y. (2021). Impact of ice structuring protein on myofibrillar protein aggregation behaviour and structural property of quick-frozen patty during frozen storage. International Journal of Biological Macromolecules, 178, 136–142. https://doi.org/https://doi.org/10.1016/j.ijbiomac.2021.02.158
- Li, F., Zhong, Q., Kong, B., Wang, B., Pan, N., & Xia, X. (2020). Deterioration in quality of quick-frozen pork patties induced by changes in protein structure and lipid and protein oxidation during frozen storage. Food Research International, 133, 109142. https://doi.org/https://doi.org/10.1016/j.foodres.2020.109142
- Li, P., Chen, Z., Tan, M., Mei, J., & Xie, J. (2020). Evaluation of weakly acidic electrolyzed water and modified atmosphere packaging on the shelf life and quality of farmed puffer fish (Takifugu obscurus) during cold storage. Journal of Food Safety, 40(3), e12773. https://doi.org/https://doi.org/10.1111/jfs.12773
- Li, P., Zhou, Q., Chu, Y., Lan, W., Mei, J., & Xie, J. (2020). Effects of chitosan and sodium alginate active coatings containing ε-polysine on qualities of cultured pufferfish (Takifugu obscurus) during cold storage. International Journal of Biological Macromolecules, 160, 418–428. https://doi.org/https://doi.org/10.1016/j.ijbiomac.2020.05.092
- Nian, L., Cao, A., Cai, L., Ji, H., & Liu, S. (2019). Effect of vacuum impregnation of red sea bream (Pagrosomus major) with herring AFP combined with CS@Fe3O4 nanoparticles during freeze-thaw cycles. Food Chemistry, 291, 139–148. https://doi.org/https://doi.org/10.1016/j.foodchem.2019.04.017
- Olsson, G. B., Ofstad, R., Lødemel, J. B., & Olsen, R. L. (2003). Changes in water-holding capacity of halibut muscle during cold storage. LWT - Food Science and Technology, 36(8), 771–778. https://doi.org/https://doi.org/10.1016/S0023-6438(03)00098-7
- Özden, Ö. (2005). Changes in amino acid and fatty acid composition during shelf-life of marinated fish. Journal of the Science of Food and Agriculture, 85(12), 2015–2020. https://doi.org/https://doi.org/10.1002/jsfa.2207
- Rao, W., Wang, Z., Shen, Q., Li, G., Song, X., & Zhang, D. (2018). LF-NMR to explore water migration and water–protein interaction of lamb meat being air-dried at 35°C. Drying Technology, 36(3), 366–373. https://doi.org/https://doi.org/10.1080/07373937.2017.1339084
- Royer, C. A. (2006). Probing protein folding and conformational transitions with fluorescence. Chemical Reviews, 106(5), 1769–1784. https://doi.org/https://doi.org/10.1021/cr0404390
- Shi, J., Lei, Y., Shen, H., Hong, H., Yu, X., Zhu, B., & Luo, Y. (2019). Effect of glazing and rosemary (Rosmarinus officinalis) extract on preservation of mud shrimp (Solenocera melantho) during frozen storage. Food Chemistry, 272, 604–612. https://doi.org/https://doi.org/10.1016/j.foodchem.2018.08.056
- Sun, Q., Sun, F., Xia, X., Xu, H., & Kong, B. (2019). The comparison of ultrasound-assisted immersion freezing, air freezing and immersion freezing on the muscle quality and physicochemical properties of common carp (Cyprinus carpio) during freezing storage. Ultrasonics Sonochemistry, 51, 281–291. https://doi.org/https://doi.org/10.1016/j.ultsonch.2018.10.006
- Sun, Q., Zhao, X., Zhang, C., Xia, X., Sun, F., & Kong, B. (2019). Ultrasound-assisted immersion freezing accelerates the freezing process and improves the quality of common carp (Cyprinus carpio) at different power levels. LWT, 108, 106–112. https://doi.org/https://doi.org/10.1016/j.lwt.2019.03.042
- Syamaladevi, R. M., Manahiloh, K. N., Muhunthan, B., & Sablani, S. S. (2012). Understanding the influence of state/phase transitions on ice recrystallization in Atlantic Salmon (Salmo salar) during frozen storage. Food Biophysics, 7(1), 57–71. https://doi.org/https://doi.org/10.1007/s11483-011-9243-y
- Tan, M., Li, P., Yu, W., Wang, J., & Xie, J. (2019). Effects of glazing with preservatives on the quality changes of squid during frozen storage. Applied Sciences, 9(18), 3847. https://doi.org/https://doi.org/10.3390/app9183847
- Wang, B., Kong, B., Li, F., Liu, Q., Zhang, H., & Xia, X. (2020). Changes in the thermal stability and structure of protein from porcine longissimus dorsi induced by different thawing methods. Food Chemistry, 316, 126375. https://doi.org/https://doi.org/10.1016/j.foodchem.2020.126375
- Xu, B., Zhang, M., Bhandari, B., Cheng, X., & Sun, J. (2015). Effect of ultrasound immersion freezing on the quality attributes and water distributions of wrapped red radish. Food and Bioprocess Technology, 8(6), 1366–1376. https://doi.org/https://doi.org/10.1007/s11947-015-1496-x
- Xu, Z., Guo, Y., Ding, S., An, K., & Wang, Z. (2014). Freezing by immersion in liquid CO2 at variable pressure. Innovative Food Science & Emerging Technologies, 22, 167–174. https://doi.org/https://doi.org/10.1016/j.ifset.2013.06.005
- Yu, D., Jing, D., Yang, F., Gao, P., Jiang, Q., Xu, Y., Yu, P., & Xia, W. (2021). The factors influencing the flavor characteristics of frozen obscure pufferfish (Takifugu Obscurus) during storage: Ice crystals, endogenous proteolysis and oxidation. International Journal of Refrigeration, 122, 147–155. https://doi.org/https://doi.org/10.1016/j.ijrefrig.2020.10.028
- Zhang, J., Zhou, D., Zhong, X., Pei, Z., Tian, Y., Xiang, D., Cao, J., Shen, X., & Li, C. (2020). Quality and protein degradation of golden pompano (Trachinotus blochii) fillets during four drying methods. LWT, 130, 109638. https://doi.org/https://doi.org/10.1016/j.lwt.2020.109638
- Zhang, Y., & Ertbjerg, P. (2019). On the origin of thaw loss: Relationship between freezing rate and protein denaturation. Food Chemistry, 299, 125104. https://doi.org/https://doi.org/10.1016/j.foodchem.2019.125104
- Zhang, Z., Yang, Y., Zhou, P., Zhang, X., & Wang, J. (2017). Effects of high pressure modification on conformation and gelation properties of myofibrillar protein. Food Chemistry, 217, 678–686. https://doi.org/https://doi.org/10.1016/j.foodchem.2016.09.040