
 ?Mathematical formulae have been encoded as MathML and are displayed in this HTML version using MathJax in order to improve their display. Uncheck the box to turn MathJax off. This feature requires Javascript. Click on a formula to zoom.
ABSTRACT
Electrospinning technology is a common method for preparing ultrafine fibers and nanofibers. Using natural or synthetic polymers as raw materials, fibers with diameters ranging from tens of nanometers to several microns can be prepared. Using hexafluoroisopropanol as solvent, electrospinning was applied to peanut protein, and the resulting fiber morphology was observed by scanning electron microscopy. Using the Box–Behnken design for the response surface method, the solution concentration, voltage, and spinning speed were selected as the three main influencing factors, the peanut protein isolate(PPI) fiber diameter was the object of investigation, and the second-order multiple regression model was established through regression analysis. The results showed that solution mass fraction had the most significant effect on fiber diameter, followed by voltage and spinning speed. The optimal conditions obtained by the simulated annealing algorithm were, as follows: Solution mass fraction, 10%; voltage, 16 kV; spinning speed, 0.6 mL/h. The predicted fiber diameter was 151 nm and the actual fiber diameter obtained experimentally was 164 nm. The fiber diameter predicted by the model was in good agreement with the real value, indicating that the model effectively predicted the diameter of electrospun PPI fiber. The use of response surface methodology to design experiments is of great significance for nanofiber preparation by electrospinning technology.
RESUMEN
La tecnología de electrohilado es un método habitual para preparar fibras ultrafinas y nanofibras. Utilizando polímeros naturales o sintéticos como materia prima, pueden prepararse fibras con diámetros que van desde decenas de nanómetros hasta varias micras. En este sentido, y empleando como disolvente hexafluoroisopropanol, se aplicó el electrohilado a la proteína de cacahuate. La morfología de la fibra resultante se observó mediante microscopía electrónica de barrido. Usando el diseño Box-Behnken para el método de superficie de respuesta, se seleccionaron los tres principales factores de influencia: la concentración de la solución, el voltaje y la velocidad de hilatura. El objeto de investigación fue el diámetro de la fibra de aislado de proteína de cacahuate (PPI), estableciéndose el modelo de regresión múltiple de segundo orden por medio del análisis de regresión. Los resultados permitieron constatar que la fracción de masa de la solución tuvo el efecto más significativo sobre el diámetro de la fibra, seguido por el voltaje y la velocidad de hilado. Mediante el algoritmo de recocido simulado se obtuvieron las condiciones óptimas, a saber: fracción de masa de la solución, 10%; voltaje, 16 kV; velocidad de hilado, 0.6 mL/h. El diámetro previsto para la fibra fue de 151 nm y el diámetro real de la misma obtenido experimentalmente fue de 164 nm. En otras palabras, el diámetro de la fibra previsto por el modelo está en buena concordancia con el valor real, lo que indica que el modelo predijo efectivamente el diámetro de la fibra PPI electrohilada. En conclusión, el uso de la metodología de superficie de respuesta para diseñar experimentos resulta de gran importancia en la preparación de nanofibras empleando la tecnología de electrohilado.
1. Introduction
With the development of nanomaterials, nanofibers have recently received extensive research attention owing to their excellent properties. Presently, nanofibers are mainly prepared using self-assembly, template, phase-separation, and electrospinning methods (Greiner & Wendorff, Citation2007; Rostamabadi et al., Citation2020). Among these, electrospinning has received much attention for its simple equipment and easy operation (Chuangchote & Supaphol, Citation2006). Electrospinning is a process in which a polymer solution overcomes surface tension in a high-voltage electrostatic field, is then split and refined under the action of electrostatic repulsion, and forms fibrous substances through solution solidification and solvent volatilization (Baji et al., Citation2010). Nanofibers prepared by electrospinning have excellent characteristics, such as controllable fiber diameter, high porosity, and large specific surface area. Furthermore, various functional active substances can be added to the spinning solution to prepare nanofibers with a wide range of functional properties.
Polymer materials currently used for electrospinning include synthetic and natural substances, and mixtures of both (Barnes, Citation2007). Compared with synthetic polymers (such as polyurethane (X. Wang & Hsiao, Citation2016), polylactic acid (Kang et al., Citation2018), and polycaprolactone (Maame et al., Citation2015)), natural polymers (such as polysaccharides, proteins, and lipids) have good biocompatibility, low toxicity, and renewable and controllable biodegradability (Nieuwland et al., Citation2013; Stijnman et al., Citation2011). For example, Mori et al. (Citation2014) prepared zein/tannin nanofibers using electrospinning technology, finding that adding tannin increased the glass transition temperature of the fiber membrane. The resulting nanofiber had the good thermal and chemical properties of tannin, and was compatible with some hydrophobic polymer media. Cho et al. (Citation2010) studied the effects of temperature, heating time, and pH on protein denaturation in SPI/PVA films, finding that, at temperature exceeding 80°C, the carbon chain structure of soy protein was destroyed. However, a heating time of over 30 min did not further change the solution viscosity and increased the SPI concentration in the mixed solution, promoting shear thinning, which was conducive to obtaining fibers by electrospinning. Meanwhile, increasing the pH reduced bead formation in the electrospun fiber. Sullivan et al. (Citation2014) prepared electrospun WPI/PEO nanofiber membranes, showing that the fiber diameter increased with increasing polymer solution concentration, and that the secondary structure of WPI changed with different WPI concentrations and pH values. The study also found that when the temperature exceeded 160°C (higher than the melting point of PEO), the morphology of the WPI/PEO fiber was still not destroyed. Furthermore, treating the fiber at a temperature higher than the protein gelation temperature improved its thermal stability. Celebioglu and Uyar (Citation2019, Citation2020) studied the electrospinning of cyclodextrin under different solvent conditions, and the results showed that cyclodextrin can form nanofibers in different solvents, and mixed with curcumin for electrospinning, and found that turmeric in composite nanofibers The activity of curcumin can be completely preserved, and the fiber diameter is relatively uniform, and the solubility and antioxidant properties of curcumin are also significantly improved. Dhandayuthapani et al. (Citation2010) obtained gelatin/chitosan nanofibers by electrospinning, and investigated the effects of spinning parameters and polymer solution properties on the fiber morphology. When the concentration of the solution decreased, the viscosity also decreased. Beaded fibers formed readily, and when the voltage was sufficiently low to overcome the surface tension, the solution was unable to form Taylor cones, which also affected spinning. Meanwhile, the mechanical properties of composite nanofibers, gelatin nanofibers, and chitosan nanofibers were studied comparatively. The results showed that phase separation of chitosan and gelatin did not occur, with intermolecular hydrogen bonding improving their miscibility and strength. Intermolecular and intramolecular hydrogen bonds endowed the fibers with strong tensile properties, and the composite nanofibers had a higher prestretch strength than that of gelatin nanofibers. Ji et al. (Citation2010) used coaxial electrospinning and blended electrospinning to prepare polycaprolactone (PCL)/bovine serum albumin nanofibers. The fibers obtained by coaxial electrospinning had uniform morphology and even protein distribution, while those obtained by blended electrospinning had a beaded structure and uneven protein distribution. Both methods reduced the protein activity. When polyethylene glycol was added, the coaxial electrospun nanofibers retained 75% of the protein activity. However, for peanut protein, another common natural food protein, there are few studies on nanofiber preparation by electrospinning.
The protein content of peanuts is 24%–36%, which is second only to soybeans among several major oil crops. peanut protein isolate(PPI) contains eight types of amino acid necessary to humans, making it easily absorbed by the human body. PPI has relatively complete nutrition and contains fewer antinutritional factors. Its nutritional value is similar to that of animal protein, making it another high-quality protein resource in addition to soybean protein. As a natural biodegradable macromolecule, PPI has abundant sources, high availability, and a low price. The PPI nanofiber membrane prepared by electrospinning has advantages of high porosity, a large specific surface area, and good biocompatibility and degradability. Good application prospects include food preservation, sustained drug release, and wound dressing. Therefore, this article used PPI as raw material and hexafluoroisopropanol (HFIP) as solvent. According to the experimental conditions, a three-level Box–Behnken design (BBD) method comprising three factors (solution concentration, voltage, and spinning speed) was used to systematically study the effect of electrospinning parameters on peanut protein. The influence on fiber diameter and morphology were optimized to obtain the best condition parameters.
2. Materials and methods
2.1. Materials
Peanuts were purchased from Henan Zhengyang Sannong Seed Industry Co., Ltd. A cold-pressed peanut cake (DPF; protein content, 50.12%) was prepared by pressing peanuts using a hydraulic oil press at room temperature and 55 MPa for 65 min. After crushing the peanut cake, the residue was removed with petroleum ether, passing through an 80-mesh sieve, to obtain DPF, which was stored at 4°C for later use.
2.2. Extraction of peanut protein
PPI was extracted according to the method of Zhao et al. (Citation2018) with some modifications. DPF and distilled water were mixed evenly with a material-to-liquid ratio of 1:10. The pH was adjusted to 9.0 with NaOH solution (1 mol/L), followed by stirring at 50°C for 100 min and centrifugation at 4000 × g for 20 min, with the supernatant collected. The solution pH was adjusted to the isoelectric point of PPI with HCl solution (1 mol/L), followed by stirring for 30 min and centrifugation at 4000 × g for 20 min. The resulting lower sediment was washed with water until neutral and then freeze-dried to obtain PPI.
2.3. Preparation of spinning solution
The extracted PPI and polylactic acid (PLLA) were completely dissolved in hexafluoroisopropanol at PPI/PLLA concentrations of 10%. Six solutions were prepared at different ratios (100, 10:90, 30:70, 50:50, 70:30, 90:10, w/v). Five mixed solutions with a 50:50 ratio and concentrations of 6%, 8%, 10%, 12%, and 14% were also prepared.
2.4. Single factor tests of electrospun PPI nanofiber
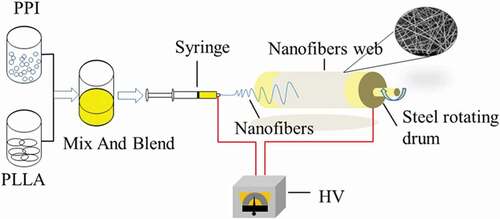
Single-factor experiments were conducted using selected PPI/PLLA mass ratios (100, 10:90, 30:70, 50:50, 70:30, 90:10, w/w), solution concentrations using a mass ratio of 50:50 (6%, 8%, 10%, 12%, and 14%), voltages (14, 16, 18, 20, and 22 kV), and spinning speeds (0.3, 0.6, 0.9, 1.2, and 1.5 mL/h) to explore their influence on PPI fiber diameter. The nanofiber electrospinning process is shown in . (W. Y. Wang et al., Citation2019)
Figure 1. Flow chart of electrospinning.
Figura 1. Diagrama de flujo del electrohilado
2.5. Response surface optimization experiment
Based on the single-factor experiments, and using Box–Behnken experimental design, a total of 15 experiments with three factors and three levels were conducted with fiber diameter as an indicator, and a response surface model was established to optimize spinning process conditions.
2.6. Scanning electron microscopy (SEM)
A small sample was cut from the center of the spun aluminum foil paper and fixed on the sample table with conductive glue. After spraying with gold, the appearance of the fiber was observed using a scanning electron microscope (JSM-7800F) with 3000 × magnification. Image Pro Plus 6 software was used to analyze the SEM images, and 100 fibers were randomly selected to calculate the average nanofiber diameter.
2.7. Statistical analysis
All tests were repeated three times and the results were averaged. Image Pro Plus 6 software was used to analyze the SEM images, ISIGHT 2016 software was used for result analysis and prediction, and Origin 8.5 software was used for drawing.
3. Results and discussion
3.1. Influence of PPI/PLLA blend ratio on nanofiber morphology
As shown in , when the PPI content in the mixed solution increased, the average diameter of the nanofibers gradually decreased. This change was mainly attributed to the viscosity and conductivity of the mixed solution. With increasing PPI content, the PLLA content decreased, which, as the viscosity of PLLA was much higher than that of PPI, resulted in the viscosity of the mixed solution and the average fiber diameter decreasing. However, when the PPI ratio was higher than 50%, the spinnability of PPI was poor and the solution viscosity was too low, resulting in a discontinuous spinning process, poor fiber morphology, and serious fiber beading and bonding. This occurred because the solution viscosity decreased and conductivity increased, which increased the electric field force on the jet. This resulted in an increased jet flow rate, jet instability, and incomplete solidification in the air (Doshi & Reneker, Citation1995), causing beads or spherical particles to appear on the fiber. Therefore, a PPI/PLLA ratio of 50:50 was selected for subsequent experiments.
Figure 2. Effect of different PPI/PLLA blend ratios on electrospun fiber diameter.
Figura 2. Efecto de diferentes proporciones de mezcla PPI/PLLA en el diámetro de la fibra electrohilado
3.2. Influence of solution concentration on nanofiber morphology and diameter
Solution concentration is an important factor affecting electrospinning. When the solution concentration is lower than the critical entanglement concentration, molecular chains in the solution cannot form effective entanglements (Gupta et al., Citation2005), making solution spinning difficult to conduct. When the solution concentration is greater than the critical entanglement concentration, entanglement between the molecular chains is tight, and a Taylor cone is formed under the action of static electricity, producing effective continuous fibers (Drosou et al., Citation2018). For electrospinning technology, the solution mass fraction is a very important factor. The greater the mass fraction of the solution, the higher the zero-shear viscosity (as shown in ), and the diameter and morphology of the resulting nanofibers will be significantly affected by the viscosity of the solution. If the mass fraction of the solution does not exceed its critical value, the molecular chains in it will not be effectively entangled (Gupta et al., Citation2005), making solution spinning difficult; when the critical mass fraction of entanglement is exceeded, the molecular chains can be tightly entangled. The Taylor cone is obtained by electrostatic action, and finally a fiber with higher continuity is produced . As the mass fraction of the solution increases, the polymer chains in it will be significantly entangled, which will increase the viscosity of the solution and reduce the beaded structure. There is no adhesion between different fibers. When the spinning speed is constant As the mass fraction of the solution increases, the amount of spinnable solution increases, and the average diameter of PPI/PLLA nanofibers increases.
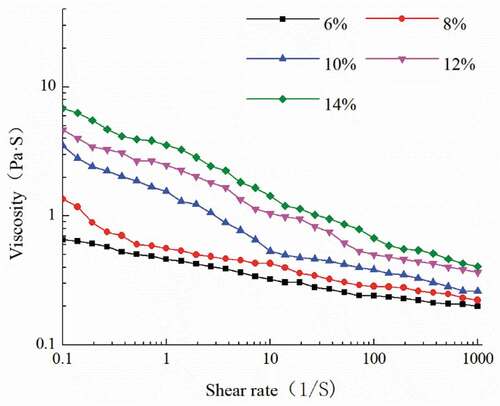
Figure 3. Viscosity-shear rate curves of PPI/PLLA blend solutions with different mass fractions.
Figura 3. Curvas de viscosidad y velocidad de cizallamiento de las soluciones de la mezcla de PPI/PLLA con diferentes fracciones de masa
Under certain electrospinning conditions, the success of electrospinning depends on the surface tension, conductivity and viscosity of the solution, and also has a certain influence on the morphology of the nanofibers formed. When the mass fraction of the polymer solution reaches a certain value, continuous fibers can be obtained. However, it is also necessary to ensure that the viscosity and mass fraction of the solution are more appropriate. If it is too high, it will adversely affect the movement of the polymer in the solution. The solution was smoothly ejected from the needle, and the spinning goal could not be successfully achieved in the end . In the process of electrospinning, the jet gradually becomes spherical due to the effect of surface tension. However, in the formation of beads, the electric field force of the excess charge on the jet surface is opposite to the electric field force of the electric field itself. As the surface tension of the solution increases, the fiber diameter increases, and the probability of forming beads increases . According to , as the mass fraction of the PPI/PLLA solution increases, the surface tension of the solution does not change significantly, always between 16 mN/m and 18 mN/m, which is related to the solvent used (Bhardwaj & Kundu, Citation2010; Huang et al., Citation2003).
Table 1. Spinning dope properties of PPI/PLLA blend solutions with different mass fractions.
Tabla 1. Diagrama de flujo del electrohilado
In terms of fiber morphology, solution conductivity also has a significant effect on fiber diameter. The higher the conductivity of the solution, the stronger its ability to carry charges. Therefore, when subjected to electric field force, the traction force of the fiber jet formed by the solution with high conductivity will be greater, the conductivity of the solution will increase, and the fiber diameter will decrease (Aneli et al., Citation2012). According to the data in , as the concentration of the PPI/PLLA solution increases, the conductivity of the solution decreases. This is mainly because the amino groups on the amino acids in the protein are positively charged. After increasing the concentration of the solution (6%-14%), the degree of protein unfolding will be reduced. In addition, as the content of PLLA increases, the viscosity of the PPI/PLLA solution increases, and the conductivity decreases, and the solution has better spinnability, so that fiber products with fewer or no defects can be obtained (Gouga et al., Citation2010; Karim et al., Citation2009) .
As shown in , as the concentration of the PPI/PLLA solution increases, the zero-shear viscosity of the solution increases. When the concentration is 6%, the zero-shear viscosity of the solution is the smallest; when the concentration is 14%, the zero-shear viscosity of the solution is maximum. As the shear rate of the PPI/PLLA blend solution increases, the shear viscosity decreases significantly, and it can be observed that the solution exhibits significant shear thinning, showing typical non-Newtonian fluid characteristics. This is mainly because there are more entanglement points in PLLA macromolecules. When the shear rate is increased, the destruction rate of the intermolecular entanglement node will exceed its reconstruction rate, thereby reducing the shear viscosity. As the mixed solution concentration increases, entanglement of the molecular chains in the polymer solution increases, solution viscosity gradually increases, beaded structures are significantly reduced, the fibers no longer adhere, and solute in the solution increases at the same flow rate. Furthermore, the average fiber diameter gradually increases. As shown in , with increasing solution concentration, the average nanofiber diameter gradually increased. This might be due to the mass fraction of PPI increasing, the degree of protein spreading decreasing gradually, and the viscosity increasing, with the spinning process becoming sticky. Furthermore, the knot was higher and the diameter was larger. Additionally, with increasing concentration, the solvent content decreases, and jet stream volatilization decreases, which also explains why the fiber diameter increased (Kutzli et al., Citation2019). The PPI/PLLA mass fraction was between 10% and 14%. The spinnability was good and the fiber diameter was smaller at a lower concentration. However, when the concentration was further reduced, the spinning membrane began to bead, eventually forming microspheres.
Figure 4. Effect of solution concentration on electrospun fiber diameter.
Figura 4. Efecto de la concentración de la solución en el diámetro de la fibra electrohilada
3.3. Influence of voltage on nanofiber morphology
Voltage is an important factor affecting the electrospinning process. Increasing voltage can cause greater jet acceleration and exert greater tensile stress on the formed fibers, which is conducive to obtaining fine fibers. However, too high a voltage will cause an unstable jet flow, resulting in the fiber forming bead particles in its radial direction (Deitzel et al., Citation2001). As shown in , with increasing voltage, electrostatic repulsion on the surface of the electrospinning solution increased, droplets on the Taylor cone surface became smaller, and the electric field stretching force increased, leading to further fiber stretching and a decreased fiber diameter. When the voltage was further increased, the fiber diameter gradually increased. This was due to the increase in electrostatic repulsion on the surface of the spinning solution with increasing voltage, and the spinning solution being directly ejected from the nozzle, causing an unstable jet, which resulted in a significantly increased fiber diameter and uneven thickness (Greiner & Wendorff, Citation2007).
Figure 5. Effect of voltage on electrospun fiber diameter.
Figura 5. Efecto del voltaje en el diámetro de la fibra electrohilada
3.4. Influence of spinning speed on nanofiber morphology
The flow rate affects the spray speed and transfer rate of the solution. When the flow rate is appropriate, the solvent has sufficient to evaporate (Yuan et al., Citation2004) and smooth continuous fibers can be obtained. As the flow rate us further increased, the fiber bundle cannot be fully stretched and the fiber diameter increases. As shown in , when the spinning speed was gradually increased from 0.50 mL/h, the spun fiber diameter also increased significantly. The flow rate of the solution determined the amount of solution and jet speed at the nozzle during the spinning process. As the spinning speed increases, suspended droplets at the nozzle increase, and the amount of solvent required to be volatilized during the spinning process increases. Simultaneously, the solution spraying speed increases and the time available for solvent volatilization becomes relatively short. Therefore, in general, a larger fiber diameter is obtained at a high spinning speed, with beads formed readily, while a lower spinning speed is conducive to the formation of fibers with uniform morphology and smaller diameters (Ghorani & Tucker, Citation2015). However, compared with fibers obtained at a spinning speed of 0.6 mL/h, spun fiber obtained at a spinning speed of 0.3 mL/h had a larger diameter. This might be due to the latter spinning speed being too low, which impacts the rheological properties of the solution and, ultimately, affects the spun fiber.
Figure 6. Effect of spinning speed on electrospun fiber diameter.
Figura 6. Efecto de la velocidad de hilado en el diámetro de la fibra electrohilada
3.5. Establishment and analysis of polynomial response surface
BBD is an experimental design method that can evaluate the nonlinear relationship between indicators and factors. Combining the collection of sample points with RSM can ensure rotational symmetry and avoid the emergence of extreme points. BBD is often used to establish a secondary fit for the response surface and simulations. The annealing algorithm optimizes the electrospinning conditions to obtain the optimized experimental conditions. As shown in , BBD factor levels were selected according to the results of single factor experiments.
Table 2. Experimental design factors and levels.
Tabla 2. Factores y niveles del diseño experimental
Using a three-factor three-level BBD method, a total of 15 experimental programs were obtained. Scanning and analyzing the fiber surface morphology by electron microscopy showed that the fiber surface was smooth, without obvious beading or bonding, the diameter distribution was relatively uniform, and the thickness of a single fiber was consistent without obvious curling. The folding phenomenon is shown in . The fiber diameters were measured, as shown in .
Table 3. Test combination and results.
Tabla 3. Combinación de pruebas y resultados
Figure 7. Scanning electron micrographs of PPI/PLLA fibers from experimental runs.
Figura 7. Micrografías electrónicas de barrido de fibras de PPI/PLLA de series experimentales
Using PPI solution concentration (A), spinning speed (B), and voltage (C) as inputs, and fiber average diameter (D) as the output, a quadratic polynomial response surface model was established using ISIGHT 2016 software, as shown in EquationEquation (1)(1)
(1) :
R2 is often used to test the fitting accuracy of the approximation model. R2 was defined as shown in EquationEquation (2)(2)
(2) :
where P is the number of design points, and ,
, and
are the predicted value of the response, the average value of the measured value, and the measured value, respectively. R2 values closer to 1 indicate higher prediction accuracy of the approximation model. General engineering problems require R2 values above 0.9. The polynomial response surface approximation model was used to predict the average nanofiber diameter, with an R2 value of 0.99. Therefore, the approximation model showed high fitting accuracy and reliable results, and can be used to predict the diameter of electrospun PPI fibers.
The main effects and interaction effects of this polynomial model were analyzed, with the results shown in . As shown in ), the fiber diameter increased with increasing PPI solution concentration and increasing voltage, but initially decreased and then increased with increasing spinning speed. The interaction effect results are shown in ). The interaction effect diagram reflects the relationship and degree of interaction between two specific factors and the response. If the two lines are parallel, no interaction occurs. However, if the two lines are not parallel or cross, an interaction is present. The degree of nonparallelism reflects the strength of the interaction effect. As shown in ), the interaction effects between voltage and spinning speed and between PPI solution concentration and spinning speed were strong, while that between PPI solution concentration and voltage was weak.
Figure 8. Factor effect analysis (a) Main effect, (b) Solution concentration and voltage, (c) Solution concentration and spinning speed, (d) Voltage and spinning speed).
Figura 8. Análisis del efecto de los factores (a) efecto principal, (b) concentración de la solución y el voltaje, (c) concentración de la solución y velocidad de hilado, (d) voltaje y velocidad de hilado)
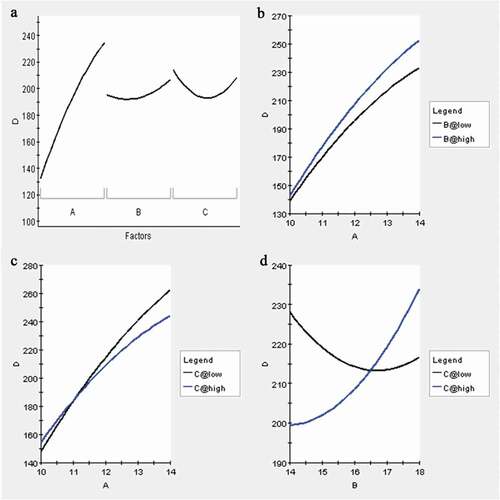
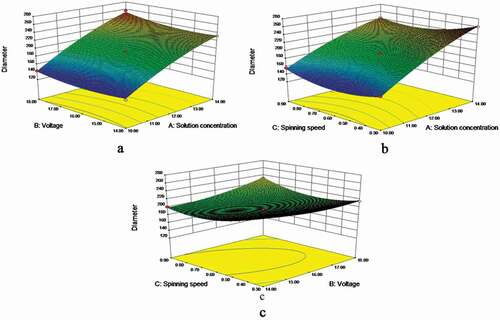
The response surface trend can be used to assess the effect of the selected factors and their interactions on the PPI nanofiber diameter. If the curve trend is steep and large, the selected factor has a large impact on the fiber diameter, while the opposite trend indicates a low impact. As shown in , when the solution concentration (A) was fixed, the interaction between voltage (B) and spinning speed (C) had a significant effect on the fiber diameter, followed by the interaction between solution concentration (A) and spinning speed (C), while the interaction between solution concentration (A) and voltage (B) was more obvious. These results showed that solution concentration had the greatest impact on PPI nanofibers, followed by voltage and spinning speed.
Figure 9. Response surface diagrams of interactions of various factors.
Figura 9. Diagramas de superficie de respuesta de las interacciones de varios factores
3.6. Establishing optimal conditions
To determine the experimental conditions that produce the smallest fiber diameter, fiber diameter (D) was selected as the optimization target, and the PPI solution concentration (A), spinning speed (B), and voltage (C) were used as design variables. Accordingly, the mathematical model shown in EquationEquation (3)(3)
(3) was established:
where D is the nanofiber diameter, Cmin and Cmax are the upper and lower limits of the solution concentration (10% and 14%, respectively), Vmin and Vmax are the upper and lower limits of the voltage (14 and 18 kV, respectively), and Smin and Smax are the upper and lower limits of the spinning speed (0.3 and 0.9 mL/h, respectively). Using ISIGHT 2016 optimization software and the simulated annealing optimization algorithm, an optimization model for determining the optimal nanofiber diameter was established. The final optimal conditions were a solution concentration of 10%, voltage of 16 kV, and spinning speed of 0.6 mL/h. The theoretical average nanofiber diameter obtained by electrospinning under these conditions was predicted to be 151 nm.
3.7. Verification test
PPI nanofibers were prepared using the optimal conditions established in the previous section, resulting in good morphology without obvious beading or nodules. The average fiber diameter predicted by the model was 132 nm, while the measured value was 164 nm, corresponding to an error of 7.9%. This indicated that the model was accurate, reliable, and suitable for use in analysis and predicting the diameter of PPI nanofibers.
4. Conclusion
PPI nanofibers were prepared by electrospinning, the influence of spinning process conditions on fiber diameter and morphology was analyzed using response surface experiments, and the process parameters were optimized. Through regression analysis, a multiple response surface model of the effect of mass fraction, voltage, and spinning speed on the diameter of electrospun PPI fibers was established. The predicted and actual values fitted well, indicating that the prediction of electrospun PPI fiber diameter was valid. Among the factors assessed, solution concentration had the most effect on fiber diameter, followed by voltage and spinning speed. The optimal spinning conditions were as follows: Solution concentration, 10%; voltage, 16 kV; and spinning speed, 0.6 mL/h. Under these conditions, the nanofibers obtained had a good morphology, no obvious beads or nodules, and a uniform diameter distribution of 143 nm. It provides a useful reference for the potential application value and prospects of PPI nanofibers in food packaging, air filtration, wound dressing, tissue engineering and other fields.
Note
In this study, the electrospinning technology was used to successfully prepare peanut protein isolate nanofibers, and the influence of process parameters on the diameter of peanut protein isolate nanofibers was analyzed, and the optimal spinning conditions were obtained through optimization of response surface technology. It provides a useful reference for the potential application value and prospects of PPI nanofibers in food packaging, air filtration, wound dressing, tissue engineering and other fields.
Author contributions
Fei Yao designed and conducted the experiments, performed data analysis, and wrote the manuscript. Yuhang Gao helped complete the experiment. Fusheng Chen supervised the study and helped to initiate the project. Yimiao Xia revised the manuscript.
Disclosure statement
No potential conflict of interest was reported by the author(s).
Additional information
Funding
References
- Aneli, J., Zaikov, G., & Mukbaniani, O. (2012). Physical principles of the conductivity of electrically conductive polymer composites (Review). Molecular Crystals & Liquid Crystals, 554(1), 167–187. https://doi.org/https://doi.org/10.1080/15421406.2012.633866
- Baji, A., Mai, Y. W., Wong, S. C., Abtahi, M., & Chen, P. (2010). Electrospinning of polymer nanofibers: Effects on oriented morphology, structures and tensile properties. Composites Science and Technology, 70(5), 703–718. https://doi.org/https://doi.org/10.1016/j.compscitech.2010.01.010
- Barnes, C. (2007). Nanofiber technology: Designing the next generation of tissue engineering scaffolds. Advanced Drug Delivery Reviews, 59(14), 1413–1433. https://doi.org/https://doi.org/10.1016/j.addr.2007.04.022
- Bhardwaj, N., & Kundu, S. C. (2010). Electrospinning: A fascinating fiber fabrication technique[J]. Biotechnology Advances, 28(3), 325–347. https://doi.org/https://doi.org/10.1016/j.biotechadv.2010.01.004
- Celebioglu, A., & Uyar, T. (2019). Fast dissolving oral drug delivery system based on electrospun nanofibrous webs of cyclodextrin/ibuprofen inclusion complex nanofibers. Molecular Pharmaceutics, 16(10), 4387–4398. https://doi.org/https://doi.org/10.1021/acs.molpharmaceut.9b00798
- Celebioglu, A., & Uyar, T. (2020). Electrospinning of cyclodextrins: Hydroxypropyl-alpha-cyclodextrin nanofibers. Journal of Materials Science, 55(8), 1–17. https://doi.org/https://doi.org/10.1007/s10853-019-03983-x
- Cho, D., Nnadi, O., Netravali, A., & Joo, Y. L. (2010). Electrospun hybrid soy protein/PVA fibers. Macromolecular Materials and Engineering, 295(8), 763–773. https://doi.org/https://doi.org/10.1002/mame.201000161
- Chuangchote, S., & Supaphol, P. (2006). Fabrication of aligned poly (vinyl alcohol) nanofibers by electrospinning. Journal of Nanoscience and Nanotechnology, 6(1), 125–129. https://doi.org/https://doi.org/10.1166/jnn.2006.043
- Deitzel, J. M., Kleinmeyer, J. D., Harris, D. E. A., Tan, N., & Beck, C. (2001). The effect of processing variables on the morphology of electrospun nanofibers and textiles. Polymer, 42(1), 261–272. https://doi.org/https://doi.org/10.1016/S0032-3861(00)00250-0
- Dhandayuthapani, B., Krishnan, U. M., & Sethuraman, S. (2010). Fabrication and characterization of chitosan-gelatin blend nanofibers for skin tissue engineering. Journal of Biomedical Materials Research Part B-Applied Biomaterials, 94B(1), 264–272. https://doi.org/https://doi.org/10.1002/jbm.b.31651
- Doshi, J., & Reneker, D. H. (1995). Electrospinning process and applications of electrospun fibers. Journal of Electrostatics, 35(2), 151–160. https://doi.org/https://doi.org/10.1016/0304-3886(95)00041-8
- Drosou, C., Krokida, M., & Biliaderis, C. G. (2018). Composite pullulan-whey protein nanofibers made by electrospinning: Impact of process parameters on fiber morphology and physical properties. Food Hydrocolloids, 77, 726–735. https://doi.org/https://doi.org/10.1016/j.foodhyd.2017.11.014
- Ghorani, B., & Tucker, N. (2015). Fundamentals of electrospinning as a novel delivery vehicle for bioactive compounds in food nanotechnology. Food Hydrocolloids, 51, 227–240. https://doi.org/https://doi.org/10.1016/j.foodhyd.2015.05.024
- Gouga, M. E., Xu, S. Y., & Zhang, W. (2010). Film forming mechanism and mechanical and thermal properties of whey protein isolate‐based edible films as affected by protein concentration, glycerol ratio and pullulan content[J]. Journal of Food Biochemistry, 34(3), 501–519. https://doi.org/https://doi.org/10.1111/j.1745-4514.2009.00294.x
- Greiner, A., & Wendorff, J. H. (2007). Electrospinning: A fascinating method for the preparation of ultrathin fibres. Angewandte Chemie-International Edition, 46(30), 5670–5703. https://doi.org/https://doi.org/10.1002/anie.200604646
- Gupta, P., Elkins, C., Long, T. E., & Wilkes, G. L. (2005). Electrospinning of linear homopolymers of poly(Methyl methacrylate): Exploring relationships between fiber formation, viscosity, molecular weight and concentration in a good solvent. Polymer, 46(13), 4799–4810. https://doi.org/https://doi.org/10.1016/j.polymer.2005.04.021
- Huang, Z. M., Zhang, Y. Z., Kotaki, M., & Ramakrishna, S. (2003). A review on polymer nanofibers by electrospinning and their applications in nanocomposites. Composites Science and Technology, 63(15), 2223–2253. https://doi.org/https://doi.org/10.1016/S0266-3538(03)00178-7
- Ji, W., Yang, F., van den Beucken, J. J. J. P., Bian, Z., Fan, M., Chen, Z., & Jansen, J. A. (2010). Fibrous scaffolds loaded with protein prepared by blend or coaxial electrospinning. Acta Biomaterialia, 6(11), 4199–4207. https://doi.org/https://doi.org/10.1016/j.actbio.2010.05.025
- Kang, Y., Chen, P., Shi, X. T., Zhang, G. C., & Wang, C. L. (2018). Multilevel structural stereocomplex polylactic acid/collagen membranes by pattern electrospinning for tissue engineering. Polymer, 156, 250–260. https://doi.org/https://doi.org/10.1016/j.polymer.2018.10.009
- Karim, M. R., Lee, H. W., Kim, R., Ji, B. C., Cho, J. W., Son, T. W., Oh, W., & Yeum, J. H. (2009). Preparation and characterization of electrospun pullulan/montmorillonite nanofiber mats in aqueous solution[J]. Carbohydrate Polymers, 78(2), 336–342. https://doi.org/https://doi.org/10.1016/j.carbpol.2009.04.024
- Kutzli, I., Gibis, M., Baier, S. K., & Weiss, J. (2019). Electrospinning of whey and soy protein mixed with maltodextrin - Influence of protein type and ratio on the production and morphology of fibers. Food Hydrocolloids, 93, 206–214. https://doi.org/https://doi.org/10.1016/j.foodhyd.2019.02.028
- Maame, B., Nava, R., Udhab, A., & Narayan, B. (2015). Fabrication and characterization of electrospun PCL-MgO-Keratin-based composite nanofibers for biomedical applications. Materials, 8(7), 4080. https://doi.org/https://doi.org/10.3390/ma8074080
- Mori, C. L. S., dos Passos, N. A., Oliveira, J. E., Mattoso, L. H. C., Mori, F. A., Carvalho, A. G., de Souza Fonseca, A., & Tonoli, G. H. D. (2014). Electrospinning of zein/tannin bio-nanofibers. Industrial Crops and Products, 52, 298–304. https://doi.org/https://doi.org/10.1016/j.indcrop.2013.10.047
- Nieuwland, M., Geerdink, P., Brier, P., van den Eijnden, P., Henket, J., Langelaan, M. L. P., Stroeks, N., Van Deventer, H. C., & Martin, A. H. (2013). Food-grade electrospinning of proteins. Innovative Food Science & Emerging Technologies, 20, 269–275. https://doi.org/https://doi.org/10.1016/j.ifset.2013.09.004
- Rostamabadi, H., Assadpour, E., Tabarestani, H. S., Falsafi, S. R., & Jafari, S. M. (2020). Electrospinning approach for nanoencapsulation of bioactive compounds; recent advances and innovations. Trends in Food Science & Technology, 100, 190–209. https://doi.org/https://doi.org/10.1016/j.tifs.2020.04.012
- Stijnman, A. C., Bodnar, I., & Tromp, R. H. (2011). Electrospinning of food-grade polysaccharides. Food Hydrocolloids, 25(5), 1393–1398. https://doi.org/https://doi.org/10.1016/j.foodhyd.2011.01.005
- Sullivan, S. T., Tang, C., Kennedy, A., Talwar, S., & Khan, S. A. (2014). Electrospinning and heat treatment of whey protein nanofibers. Food Hydrocolloids, 35, 36–50. https://doi.org/https://doi.org/10.1016/j.foodhyd.2013.07.023
- Wang, W. Y., Zheng, Y. D., Jin, X., Sun, Y., Lu, B. B., Wang, H. X., & Lin, T. (2019). Unexpectedly high piezoelectricity of electrospun polyacrylonitrile nanofiber membranes. Nano Energy, 56, 588–594. https://doi.org/https://doi.org/10.1016/j.nanoen.2018.11.082
- Wang, X., & Hsiao, B. S. (2016). Electrospun nanofiber membranes. Current Opinion in Chemical Engineering, 12, 62–81. https://doi.org/https://doi.org/10.1016/j.coche.2016.03.001
- Yuan, X., Zhang, Y., Dong, C., & Sheng, J. (2004). Morphology of ultrafine polysulfone fibers prepared by electrospinning. Polymer International, 53(11), 1704–1710. https://doi.org/https://doi.org/10.1002/pi.1538
- Zhao, X. Y., Zhang, X. W., Liu, H. K., Zhang, G. X., & Ao, Q. (2018). Functional, nutritional and flavor characteristic of soybean proteins obtained through reverse micelles. Food Hydrocolloids, 74, 358–366. https://doi.org/https://doi.org/10.1016/j.foodhyd.2017.08.024