
ABSTRACT
Seven different methods of DNA extraction were performed and compared in order to have the better DNA recovery in terms of quality and quantity. A PCR assay was realised based on the Cytb mitochondrial gene to identify 53 commercial food products of wide range diversity (Scombridae Thunnus species) commercialised in the Tunisian market, and we checked whether these products were correctly labelled under European and national legislations. Phylogenetic analyses on Cytb mitochondrial gene were used to study the relationships among the considered species. Tuna species was easily differentiated and confirmed by direct sequencing. The results showed a high deficiency in labelling: 96% of canned tuna did not specify the species, although the name of the species had to be mentioned. Partial least squares regression (PLS) showed relatively high values (45%) in all analysed data, suggesting substantial difference between the extraction procedures and matrices with SDS/PCI method being the most convenient.
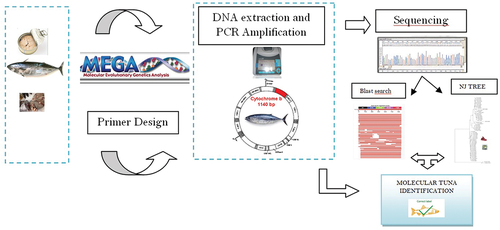
Graphical abstract
Resumen
Con el fin de obtener la mejor recuperación de ADN en términos de calidad y cantidad, en este estudio se aplicaron y compararon siete métodos diferentes de extracción de ADN. Así, se realizó un ensayo de RCP (reacción en cadena de la polimerasa) basado en el gen mitocondrial Cytb con la finalidad de identificar 53 productos alimentarios comerciales de amplia diversidad (especies de Scombridae Thunnus) comercializados en el mercado tunecino y de comprobar si estos productos estaban correctamente etiquetados según las legislaciones europea y nacional. Asimismo, para estudiar las relaciones entre las especies consideradas, se llevaron a cabo análisis filogenéticos sobre el gen mitocondrial Cytb. Las especies de atún fueron fácilmente diferenciadas y confirmadas por secuenciación directa. Los resultados permitieron constatar una elevada deficiencia en el etiquetado: 96% de las conservas de atún no especificaban la especie, aunque sí indicaban el nombre de la misma. La regresión por mínimos cuadrados parciales (MCP) mostró valores relativamente altos (45%) en todos los datos analizados, lo que da cuenta de una diferencia sustancial entre los procedimientos de extracción y las matrices, verificándose que el método SDS/PCI resultó ser el más adecuado.
PALABRAS CLAVE:
1. Introduction
Seafood and aquaculture products are among the most vulnerable produces to food fraud. Therefore, traceability in these relative sectors is essential to prevent fraud, guarantee compliance with food safety regulations and enforce sustainable fisheries management. Traceability is also critical for ensuring the quality of fish products and minimising health risks for consumers (FAO, Citation2018; Van Ruth & Granato, Citation2017; Velasco et al., Citation2020). Tuna fisheries and processing represent economic activities of primordial importance around the world. They are greatly demanded commodities, and most of these products are internationally traded for human consumption. However, not all tuna products have the equal market price as for certain species, such as Thunnus thynnus though not always available, there are consumers who are even prepared to pay huge sums, while other species are quite affordable (for instance, Skip jack). Therefore, specious labelling has been commonly detected (Sotelo et al., Citation2018). The best instrument used to combat seafood fraud is through legislation (Ferrito et al., Citation2019). For instance, the European labelling regulation aims to provide consumers information on seafood product including the commercial and scientific names, to ensure their traceability and identification along the value chain (EU 1379/2013). However, such regulation excludes prepared and processed aquatic product from the application of the mandatory labelling and therefore remains a gap to be considered by the legislator (D’Amico et al., Citation2016). For example, in the reglementation (EEC 1536/92) where it is specified that preserved tuna and bonito must be prepared exclusively from certain fish species (i.e. tuna cans should contain only any Thunnus species or Katsuwonus pelamis), mixing of species is not allowed in each tin (unless muscular structure has disappeared), only commercial names are required.
To overcome these problems, there are many recent genetic methodologies available for this purpose (Gordoa et al., Citation2017; Mata et al., Citation2020; Sotelo et al., Citation2018). Most of the genetic approaches used for the determination of species identity are based on the amplification of a region of mitochondrial (mtDNA) DNA by polymerase chain reaction (PCR; Piskata et al., Citation2017; Xiong et al., Citation2016; Yang et al., Citation2016). Cytochrome b is one of the familiar mitochondrial genes used in DNA barcoding. The mitochondrial cytochrome b gene is widely used in systematic studies to resolve divergences at many taxonomic levels. In addition, cytochrome b has some advantages such as its resistance against high temperature, abundancy in cell, following maternal heredity, as well as its high mutation. The authentication of tuna fresh, steak, as well as canned tuna using cytochrome b is reported in previous study (Besbes et al., Citation2011; Pedrosa-Gerasmio et al., Citation2012; Abdullah & Rehbein, Citation2014; Wulansari; Wulansari & Nurilmala, Citation2015).
Several protocols for DNA extraction from fish samples have been described including chemical reagents and commercial kit (Chapela et al., Citation2007; Besbes et al., Citation2011; Piskata et al., Citation2017). In general, fresh tissue of fish that has not been thermally treated has the best probability of yielding adequate DNA. However, the detection of DNA in processed products can be adversely affected by DNA fragmentation during the processing steps and the use of ingredients that may inhibit the PCR reaction. The critical step remains the extraction of high-quality DNA in sufficient large quantities from heterogeneous food matrices. In fact, DNA amplification on which rely the effectiveness of the method for species identification requires expensive reagents, which are not always available in laboratories especially in developing countries. Therefore, the choice of the extraction method should consider the reagent efficiency in term of DNA quantity/purity as well as their relative costs . In this study, we aimed in the first step to extract DNA using different protocols to initiate harmonised method for species identification among Mediterranean area including Tunisian and Spanish laboratories. In a second step, PCR of a 250-bp fragment in the mitochondrial Cytb region followed by a phylogenetic analysis were applied for the identification of species in 53 canned tuna brand commercialised in Tunisian market.
2. Materials and methods
2.1. Commercial food products
The fresh tuna samples used in this study were caught along the Tunisian coast and identified morphologically by researchers; Tuna-type products were purchased at local supermarkets or directly from Tunisian companies specialised in the commercialisation of aquatic food products. The scientific names are given in . All samples were frozen at −80°C upon arrival in the laboratory and canned tuna was kept at room temperature. Upon arrival in the laboratory, all samples were stored at −80°C until analysis.
Table 1. Authenticity determination of Tuna species in commercial fresh and canned product.
Tabla 1. Determinación de la autenticidad de las especies de atún en productos comerciales frescos y en conserva
2.2. DNA extraction
The DNA of tuna samples was extracted with the sterile scalpel from tissue of each sample according to the different protocols (EX1- EX7).
2.2.1. Kit fast DNA (EX1)
The DNA was extracted following the Kit -manufacturer’s instructions. To the weighed subsample (0.1 g); 800 µL Genomic Lyse buffer was added (to lyse the cells and solubilise the proteins, DNA and other cellular constituents) in the presence 0.1 mg (3.2 U) of Proteinase K (to digest the protein) and incubated at 65°C for 10 to 30 minutes. The DNA-containing solution was mixed with the genomic binding buffer (100 µL), then loaded on a column which binds the DNA.
2.2.2. Method sing the Phenol–chloroform–isoamyl Alcohol: SDS/PCI (EX2)
The extraction of DNA was performed according to (Besbes et al., Citation2011) with the following modifications. As tuna tissue contains fewer lipids, a one-step DNA extraction was performed. Sample (0.1 g) was homogenised with 500 µL of the buffer A (50 mM Tris–HCl, 100 mM EDTA and 1% SDS with pH 8.0) and 0.1 mg (3.2 U) of proteinase K (Sigma Aldrich, France). The mixture was incubated at 55°C with continuous shaking during 4 h, cooled on ice and then centrifuged at 12,000g for 10 min. The supernatant was extracted with phenol–chloroform–isoamylic alcohol in a 25:24:1 ratio, then precipitated with 600 µL of isopropanol at −20°C and mixed by inversion. Using ethanol (70%), the pellet was washed and dried, then resuspended in 50 µL TE buffer.
2.2.3. Method Using the SDS/PCI/NaCl (EX3)
In this case, the same procedure was applied to 0.1 g of sample using the SDS/PCI method (Hsieh et al., Citation2005), but with the addition of NaCl to the buffer A (final concentration of 0.2 M NaCl).
2.2.4. Method Using chelex (EX4)
The sample (0.1 g) was homogenised in 300 µL of a Chelex water solution (5% -Chelex 100 resin Qiagen) mixed with 20 µL of proteinase K (0.1 mg) and 30 µL TE buffer; incubated at 56°C during 4 h and followed by a heating (100°C) for 15 min (Jérôme et al., Citation2003). The solution was centrifuged (12,000 g for 10 min), the DNA pellet for PCR amplification was stored at 4°C until use.
2.2.5. Method Using CTAB/CI (EX5)
The tuna sample (0.1 g) was grinded in 500 µL pH 8- CTAB buffer (100 mM Tris–HCl, 20 mM EDTA, 2% hexadecyl–trimethyl ammonium bromide, and 1.4 M NaCl), to which was added 50 µL ß-mercaptoethanol 0.2% at final concentration, 0.1 mg (3.2 U) of proteinase K (modified method of Quinta et al., Citation2004), and incubated at 65°C for 12 h. The solution was then centrifuged at 12,000 g (10 min), the supernatant was extracted with chloroform–isoamylic alcohol and precipitated with ethanol. The pellets were finally re-suspended in TE buffer.
2.2.6. Method Using TRITON/CI Chloroform–isoamyl Alcohol (EX6)
The muscle tissue (0.1 g) was homogenised in 500 µL of pH 8.0-buffer B (2 mM EDTA,10 mM Tris–HCl), to which was added 50 µL ß-mercaptoethanol 0.2% at final concentration and 50 µL Triton X-100 at 1% final concentration and 0.1 mg (3.2 U) of proteinase K (Besbes et al., Citation2011). The mixture was incubated at 65°C for 12 h and then centrifuged at 12,000 g (4°C-10 min). The suspended DNA was mixed vigorously with an equal volume of chloroform–isoamylic alcohol and then centrifuged at 12,000 g (10 min). For DNA precipitation, ethanol and sodium acetate were added to the supernatant, the pellets were then resuspended in 50 µL TE buffer.
2.2.7. Method Using dneasy tissue kit (EX7)
DNA was extracted by means of a commercial kit (DNeasy Tissue kit, Qiagen, Darmstadt, Germany), as previously described (Prado et al., Citation2005), 25 mg of sample were homogenised with 180 µL of lysis buffer ATL and 20 µL proteinase K. The homogenate was incubated during 3 h at 56°C and then Vortex for 15 s. 200 µL Buffer AL were then added to the sample, and thoroughly mixed by vortexing. The supernatant, obtained after centrifugation at 6000 g for 5 min at room temperature, was added to 200 µl ethanol. The mixture (400 µL) was then loaded on the DNeasy Mini spin column where DNA was bonded to the silica-gel membrane during the centrifugation steps. The bounded DNA-DNeasy Mini spin membrane was washed using two different washing buffers and then eluted using the elution buffer.
2.3. DNA quantification and purity
Extracted DNA was estimated by absorbance at 260 nm. One optical density ‘DO’ at 260 nm equalling 50 µg/mL DNA. Purity was checked by determining the ratio A260/A280 (Sambrock et al., Citation1989).
2.4. Primer design
About 53 tuna sample Cytb gene sequences were obtained from GenBank. In addition, Cytb gene sequences of tuna species purchased for this study were determined by a direct sequencing analysis of the amplified products using the sequencing primer pairs, namely, TunaF1 (forward primer 5ʹ- TACTGAGGCGAAGGCTGATT-3ʹ) and TunaF2 (reverse primer 5ʹ-CAAAGAAGATTACGCTGTTATCCC-3ʹ). This primer pairs based on the highly conserved sequence among the target species, for detecting tuna, were designed to amplify the Cytb gene. For all species, one set of primer pairs TunaF1/TunaF2 were used in the PCR amplifications to obtain 250bp DNA fragments of Cytb.
2.5. PCR amplification
PCR amplifications were carried out using Bio-Rad MyCycler (Bio-Rad). The reactions were set up in volumes of 50 μL containing PCR buffer [75 mM Tris-HCl, pH 9.0; 50 mM KCI; 20 mM (NH4)2SO4, 2 mM MgCl2]; 400 μM dNTP mix; 0.2 μM each primer; 2.5 units of UptiTherm DNA polymerase (Uptima- Interchim); and 100 ng of template DNA (PCI extracts).
Amplification conditions were as follows: first an initial denaturation step of 94°C for 3 min, followed by 35 cycles of denaturation (30 s at 94°C), annealing (30 s at 55°C) and extension (40 s at 72°C), and a final extension for 5 min at 72°C was also included. The set of newly designed primers used for PCR amplification were designed as follows
TUNAF1: (forward primer 5ʹ-GCGGTATTTTGACCGTGCGAAGG-3ʹ)
TUNAR2: (reverse primer 5ʹ-CCTTAATTCAACATCGAGGTCGC-3ʹ).
2.6. Cleanup and sequencing of PCR products
Before sequencing, double-stranded PCR products were purified by filtration through a DNA Clean & Concentrator-25 of ZYMO RESEARCH CORP according to the manufacturer’s protocol.
PCR fragments were used for direct cycle sequencing with the dye terminator cycle sequencing kit (Beckman). Sequencing analysis was performed with a Beckman Coulter CEQ 8000 DNA sequencer in both directions with the primers used for PCR amplification
2.7. Sequence alignment, genetic distances, and phylogenetic analyses
The DNA sequences were edited with BioEdit software (Hall, Citation1999). In addition, the sequences were also compared to the Genbank data base by BLAST (Altschul et al., Citation1990) using the high similarity algorithm. The sequences were aligned by Clustal W, then the generated cytochrome b sequences were identified in GenBank (www.ncbi.nlm.nih.gov) using the BLASTn search tool.
Phylogenetic and molecular evolutionary analyses were conducted using MEGA X (Kumar et al., Citation2018, Citation2004). Nucleotide divergences were computed using the Tamura-Nei model, (Tamura & Nei, Citation1993), which takes substitutional rate biases and the inequality of base frequencies into account. Phylogenetic trees were constructed using the neighbor-joining (NJ) method, (Saitou & Nei, Citation1987) and the robustness of topology nodes was tested by the bootstrap method with 1500 iterations were shown in the branches (Altschul et al., Citation1990). Genetic distance was measured using the Tamura-Nei model with number of nucleotide substitutions per site (Bartlett & Davidson, Citation1992).
2.8. Multivariate analysis
For each extraction, the results were presented as mean ± standard deviation (n = 6). All the data were statistically treated using ANOVA with an SPSS Statistical Software System version 11.01 (SPSS Chicago, IL, USA). Tukey’s test was used to determine the possible significant differences among mean values at the 5% level. The results were also analysed by partial least squares (PLS) regression using multivariate statistical software (The Unscrambler version 9.8, CAMO Software AS, Oslo, Norway). Leverage correction and cross-validation of all the data were applied. The variables were weighted with the inverse of the standard deviation of all the objects in order to compensate for the different scales of the variables. Martens Uncertainty test was used to examine the influence of considered variables on the PCR amplification.
Finally, (DO A260/A280, DNA YIELD and tuna sample type) were also analysed by principal component analysis (PCA) using Past Software (Past 3.20, University of Oslo). Variables were scaled by columns so they have a mean of zero and a variance of one in order to compensate for their different scales.
3. Results and discussion
3.1. Evaluation of DNA yield, purity and amplificability
The different samples used to evaluate the DNA yield and purity, included the tissue of fresh tuna and processed products (). Gel electrophoresis and spectrophotometry analysis revealed significant differences (p < .05) in DNA yield and purity according to the procedure of extraction and sample matrix (). In the process of DNA extraction, three steps are necessary including breaking cell walls, nucleic material release from the nuclei into the media and DNA precipitation. In this study, the highest precipitated amount of DNA was obtained following the PCI/SDS protocol and that, independently of fresh or processed tuna. However, adding NaCl to the PCI/SDS medium induced a significant decrease in DNA levels in all analysed samples. Such result could be due to the inadequate concentration of NaCl used in this experiment as it has either dispersive or binding effects on DNA fragment causing its precipitation along with proteins (Bauer et al., Citation2003; Besbes et al., Citation2011). However, no optimisation of NaCl concentration was performed in this study as sufficient quantity of DNA level with good purity (A260/A280 ratio >1.81) was obtained in all cases.
Table 2. Comparison of DNA yield, purity, PCR positive amplification for several foodstuffs of Tuna extracted with seven different methods studied.
Tabla 2. Comparación del rendimiento del ADN, la pureza y la amplificación positiva de la RCP para varios productos alimenticios de atún extraídos con siete métodos diferentes estudiados
Significant lower DNA contents were obtained for canned tuna when using specific method such as the Chelex method. Moreover, for such processed samples, both methods yielded poor DNA quality (A260/A280 < 1.21) which may be attributed to interferences with substances such as protein and flavouring aromatic compounds added to tuna preparation.
Similarly, CTAB methods revealed considerable low DNA quantities with poor DNA quality (A260/A280 = 1.51–1.67, respectively). In addition, poor reproducibility of DNA extraction was noticed as generally high standard errors were found for DNA quantification for fresh and processed tuna.
Among all trials, Fast DNA kit method yielded the lowest DNA recovery in all samples with values ranging from 20.8 to 42.8 ng DNA/µL of extract. Such kit was found inappropriate to DNA precipitation and recovery in tuna matrix.
The quantity and quality of the extracted DNA from tuna clearly depended on the type of matrix and on the level of processing.
Several parameters including the degree of DNA damage occurring during processing and the extraction procedure, as well as the average length of DNA fragments, affect considerably the success of DNA amplification. In this study, the DNA extracted from the different tuna matrices were differently amplified with a set of primers amplifying the 250 bp-cytochrome b fragments as shown in and . The amplification was successful particularly in fresh tuna, which was used as reference, but it was difficult in processed tuna; proving that processing may damage the DNA. Thus DNA-fragments from fresh tuna tissues were amplified by PCR independently of the extracting methods ().
Figure 1. Example of Electrophoretic analysis gel (1% agarose) of PCR products of the cytochrome b fragments from left to right. Lanes 1 and 8: Amplification of DNA of canned tuna fish, Mq: Lanes 9 molecular weight marker 100-bp ladder; PCR products for tuna fresh samples: sample reference lanes 10: Katsowonus pelamis, lanes 11–12 Thunnus Thynnus, lanes 13: Thunnus albacares, lanes 14: Euthynnus alleteratus, lanes 15: Auxis rochei and lanes 16: Sarda sarda.
Figura 1. Ejemplo de gel de análisis electroforético (agarosa al 1%) de los productos de RCP en los fragmentos del citocromo b, de izquierda a derecha. Filas 1 y 8: amplificación del ADN del atún en conserva; Mq: filas 9 marcador de peso molecular, escalera de 100-bp; productos RCP para muestras de atún fresco: filas de referencia de la muestra 10: Katsowonus pelamis; filas 11–12 Thunnus Thynnus; filas 13: Thunnus albacares; filas 14: Euthynnus alleteratus; filas 15: Auxis rochei; y filas 16: Sarda sarda.
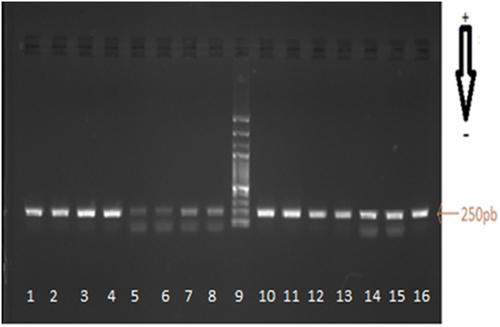
Concerning the DNA from the various processed tuna matrices, only DNA extracted with the PCI/SDS and DNeasy Tissue kit gave a PCR product of the 250 bp-expected size for all the analysed samples ().
3.2. PCR amplification of thon mtDNA from commercial food products
Several parameters including the degree of DNA damage occurring during processing and the extraction procedure, as well as the average length of DNA fragments, affect considerably the success of DNA amplification. In this study, the DNA-fragments from fresh tuna tissues were amplified by PCR independently of the extracting methods. Concerning the DNA from the various processed tuna matrices, only DNA extracted with the PCI/SDS and DNeasy Tissue kit gave a PCR product of the 250 bp-expected size for all the analysed samples (). The PCR products were individually amplified by primers TUNAF1 and TUNAR2. Including 2 primers, the length of each consensus mitochondrial cytochrome b gene fragment was 250 bp, as shown in .
In this study, a total of 53 different commercial food products of TUNA were subjected to DNA extraction and purification. DNA amplification was successful in all primers and all samples analysed (). Accordingly, the size of the molecular target 250 bp proved to be accurate to achieve PCR amplification even in processed foods that included tuna as ingredients and that have been subjected to a variety of technological treatments such as boiling or freezing.
3.3. Species identification of commercial TUNA food product
The best labelling that can be found for the different fresh tuna found in the local market was the species common name such as the Thunnus thynnus. The other canned tuna products were labelled tuna or did not have any species or genera specification on their labels. In 43 of such processed products, the tuna species included were generically referred to as “tuna” (). The DNA amplification products were sequenced and aligned against the Cytb sequences of tuna obtained from the NCBI GenBank ().
The sequences acquired in this study were deposited in GenBank with accession numbers: (MT240963–MT241007/MT274604-MT274604) and all the sequences of the tuna-food products compared and identified by BLAST ().
Authentication of Thunnus species with Cytb as a “barcode gene” by BLAST showed the high similarity, this is exemplified by reference sample of K.pelamis (TKP), which gave the best hit (98% identity) to KP669125.1 (T. albacares), and a percent ID of 99% for the next following tuna species (T. thynnus, KJ623830.1).
The new sequences, which were equally deposited in the NCBI GenBank, were aligned against the other scombridae species sequences allowing the construction of a neighbour-joining tree (NJ; ).
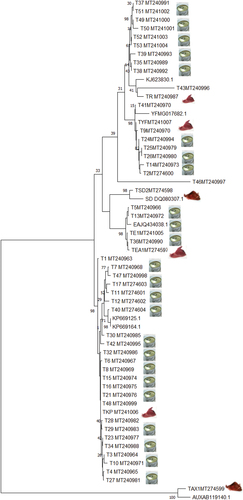
Figure 2. Phylogenetic tree obtained from sequence divergence of a Cytb gene for 53 sequences of Tuna. NJ tree inferred from TN distances between sequences of partial Cytb gene in 25 samples of Katsowonus pelamis Sequences starting with “TKP” species, 10 samples of Thunnus Thynnus Sequences starting with “TR” species, 8 samples Thunnus albacares sequences starting with “TYF” species, 5 samples Euthynnus alleteratus sequences starting with “TEU” species, 1 sample Auxis rochei sequences starting with “TAX” species, 1 sample Sarda sarda Sequences starting with “TSD” species and the sequenced gene referenced in the NCBI GenBank; Numbers denote bootstrap percentages based on 1500 replications from neighbor-joining analysis.
Figura 2. Árbol filogenético obtenido a partir de la divergencia de secuencias de un gen Cytb para 53 secuencias de atún. Árbol NJ inferido a partir de las distancias TN entre las secuencias del gen Cytb parcial en 25 muestras de Katsowonus pelamis; secuencias que comienzan con la especie “TKP”, 10 muestras de Thunnus Thynnus; secuencias que comienzan con la especie “TR”, ocho muestras de Thunnus albacares; secuencias que comienzan con la especie “TYF”, cinco muestras de Euthynnus alleteratus; secuencias que comienzan con la especie “TEU”, una muestra de Auxis rochei; secuencias que comienzan con la especie “TAX”, una muestra de Sarda sarda; secuencias que comienzan con la especie “TSD” y el gen secuenciado referenciado en el NCBI GenBank. Los números denotan los porcentajes de bootstrap basados en 1,500 réplicas del análisis de unión de vecinos.
The European labelling regulations establish compulsory information such as the scientific name and the corresponding commercial denomination according to the official list of names of each species tuna.
The Tunisian list of commercial names for tuna species is according to European regulations (EEC 1536/92), for canned tuna the type of fish, which can be marketed (tuna or bonito) with the following genus and species:
The genus Thunnus, contained species albacore tuna (thunnus alalunga), Yellowfin (Thunnus Albacores), Bluefin tuna (Thunnus Thynnus), Bigeye tuna (Thunnus Obesus) and Skipjack (Katsuwonus pelamis), are grouped in the clade Tuna. The Clade bonito grouped the genus sarda contained species Striped bonito (Sarda Sarda), Eastern Pacific bonito (Sarda Chiliensis) and Indian Ocean bonito (Sarda Orientalis) and grouped the genus Euthynnus contained Common tuna (Euthynnus Alleteratus), Eastern bluefin tuna (Euthynnus Affinis), Black tuna (Euthynnus Lineatus) and the genus Auxis contained Melva (Auxis Thazard) and Auxi srochei.
Thus, the constructed phylogram showed two distinct family clades (tuna and bonito), for the scombridae families, each associated with each reference species.
We found that the 24 canned tuna products were in the same cluster with K. pelamis and these tuna products exhibiting the highest values of intraspecific homology (99%) and the bootstrap value were high. Additionally, when we compared the sequences of the tuna-food products by BLAST (), 24 products were also identified as K.pelamis.
The rest of tuna-processed products were grouped together with three cluster Thunnus albacores (seven canned tuna products were grouped in the same cluster of T.albacares reference with a bootstrap values at the nodes of 84%), Euthynnus alleteratus (five canned tuna products were grouped in the same cluster of E.alleratus reference with a bootstrap values at the nodes of 99%) and Thunnus thynnus (nine canned tuna products were grouped in the same cluster of T.thynnus reference with a bootstrap values at the nodes of 99%) in the tree ().
From the NJ tree (), we found two tuna type products (T43 MT240996 and T46 MT240997) were mislabelled. The alignment results against available online database in GenBank showed a despite the high similarity of the Thunnus maccoyii and Thunnus tonggol, respectively, thus confirming mislabelling of samples.
Species divergence is another tool to evaluate similarity of an unknown sequence with a pool of reference samples. In this study, the genetic distances of Auxis rochei was easily differentiated from the studied Katsowonus pelamis, Thunnus thynnus and Euthunnus alleteratus species was 0.96, 0.94 and 1.04, respectively (Supplementary material Table 3).
The genetic distance measured between K.pelamis (KP669125.1) and the K.pelamis (MT241006) fresh tuna species was 0.04 and with K.pelamis tuna product (MT274604) was 0.01. The genetic distance measured between T.albacares (MG017682.1) and the T.albacares (MT241007) fresh tuna species was 0.04 and with T.albacares tuna product (MT240970) was 0.04.
The degree of unlabelled or unspecific cases, similar to the findings of other studies on tuna, was observed from the beginning of the commercial chain. These results suggested that labelling is overlooked by control inspections (Gordoa et al., Citation2017).
The results showed that the use of the unspecific generic name hamper the detection of species substitution. This is also covered by the attitude of consumers, who rarely ask about the tuna species at the time of buying, because in Tunisia the public are usually unaware of the existence of other tuna species and are not well informed about fish products and policy. In this scenario of incomplete information and consumer ignorance, deception conditions are favourable (Gordoa et al., Citation2017), as was proved in this study.
Consumers are misinformed about tuna species sold, which makes them unable to differentiate between species and has a negative financial impact on them. We conclude that the Tunisian regulations on labelling and on bluefin catch certificates have proven to be ineffective, highlighting the need for policy enforcements and a review of the accepted commercial names. Several actions should be taken, efforts should be made to have more effective control on labelling and labelling authenticity, including genetic testing, and on the required documentation, and it needs to be accompanied by dissuasive sanctions, proportionate to deception turnover and its associated risks and economic losses. There is also an urgent need for information campaigns addressed to Tunisian consumers: species substitution must be fought from above with efficient control and from below through well-informed and conscientious consumers.
This study showed that DNA barcoding is a fast and high accuracy tool to identify the species in order to avoid economic fraudulent such as illegal trading and mislabelling as reported in previous study (Nurilmala et al., Citation2013; Sotelo et al., Citation2018).
3.4. Partial least square regression analysis
Due to the complexity of data originating from the different extraction methods and the different matrices, multivariate statistical procedure such as principal component analysis (PCA) and Partial least squares regression models (Martens & Næs, Citation1989) were run to identify the variable most significant to the PCR amplification of tuna product
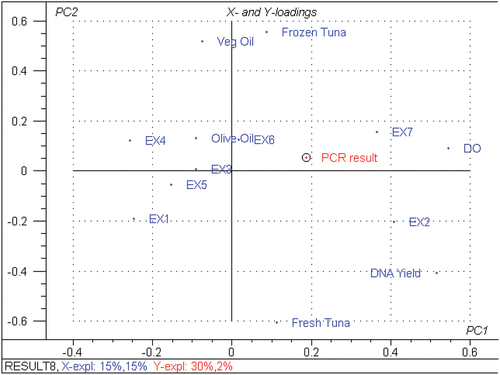
In this study, partial least squares regression models (PLS) were performed to identify the most significant variable relative to the different extraction method to PCR amplification of fresh and tuna products (Martens & Næs, Citation1989). The PCR amplification was used as Y-matrix; all the others parameters (DO, A260/A280, DNA YIELD, extraction methods and tuna sample type) as X–variables. The loading plot of tuna (), corresponded to a variance in PCR result of 32%, of which 30% was along PC1 and 2% along PC2. Of the total variation of all other variables of 30%, 15% was along PC1 and 15% along PC2. Such result highlighted that fresh tissue (right upper region) is a discriminating parameter. The comparison of the different Tuna products revealed that DO A260/A280, DNA YIELD, fresh tuna (right hand side) and processed oil tuna (left hand side) contribute the most to important variation on PC1. The PC2 was mainly describing processed tuna product.
Figure 3. Loading plots from partial least square PLS regression carried out on all X–variables DO: A260/A280, DNA YIELD, EX1: Kit fast DNA method, EX2: PCI/SDS method, EX3: SDS/PCI/NaCl method, EX4: CHELEX method, EX5: CTAB/CI method, EX6: TRITON/CI method, EX7: DNeasy Tissue kit method and all tuna foodstuff and the Y-variable (PCR RESULT: PCR amplification). All data in the PCA projections represent the means value of 6 replicates for each parameter.
Figura 3. Gráficos de carga de la regresión de mínimos cuadrados parciales realizada en todas las variables X DO: A260/A280, rendimiento de ADN, EX1: Método de ADN rápido del kit, EX2: Método PCI/SDS, EX3: Método SDS/PCI/NaCl, EX4: Método CHELEX, EX5: Método CTAB/CI, EX6: Método TRITON/CI, EX7: Método del kit DNeasy Tissue y todos los alimentos del atún y la variable Y (resultado de la RCP: amplificación de la RCP). Todos los datos de las proyecciones del PCA representan el valor medio de seis réplicas para cada parámetro.
When comparing the extraction methods, results showed that DO, A260/A280, DNA YIELD, EX2, EX7 and EX6 (right hand side) and EX1, EX3, EX4 and EX5 (left hand), contribute the most to the significant variation on PC1. Results showed that EX2, EX7 and EX6 were positively correlated with PCR amplification, while EX1, EX3, EX4 and EX5 were negatively correlated with results of PCR. Such data confirmed results previously recorded for the DNA yield/purity and amplicon observed on agarose gel.
The quality of DNA, with the highest amplicon length obtained from the fresh and the different tuna food product, was best preserved using the SDS/PCI precipitation method, with the advantage of being the fastest and simplest protocol and is less expensive than the commercial kit.
The relatively high values of the PLS of all the data (45%) suggest substantial difference between the extraction procedures and matrices when all the studied parameters were compared. Such statistical data confirm results previously recorded. Thus, the SDS/PCI method can be a good choice for processed tuna products.
Based on the result obtained from this study, detection of cyt b gene of species included in a particular processed food may largely dependent on the processing technique applied. The extraction of DNA that is of a high quantity and quality is generally recognised as the most important factor for the success of molecular techniques, such as PCR and DNA sequencing. Overall, this study identified the PCI/SDS method as the most suitable method for the extraction of DNA from tuna, due to the high DNA yields delivered the ease of use and is less expensive than the commercial kit and the applicability for high throughput extraction from multiple specimens.
The partial least squares regression models (PLS) suggest substantial difference between the extraction procedures and matrices when all the studied parameters were compared. Thus, the SDS/PCI method can be a good choice for highly processed foodstuffs.
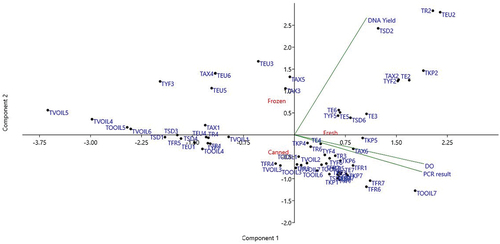
Finally, tuna samples were also analysed by principal component analysis (PCA) to examine the influence of sample matrix (type of tuna) and DNA extraction method on the PCR result, DNA yield and DO. Variables were scaled by column so they have a mean of zero and a variance of one to compensate for their different scales (). Three grouping variables were used to analyse the results: type of DNA extraction method (1–7), product type (fresh, frozen and canned) and processing (none, olive oil and vegetable oil). The tuna sample type was used as Y-matrix; all the other parameters (DO A260/A280, DNA YIELD and PCR RESULTS) as X–variables. In the scores and loadings plot (), the explained variance of the two first principal components was of 82.1%, of which 51.6% was along PC1 and 30.5% along PC2. Such result highlighted that extraction method 2 yielded the higher DNA yield in all cases (upper right region). According to the product type, fresh tuna samples produce better DO and PCR results than frozen or canned tuna. Comparing all products, the fresh tuna yielded the highest amounts of DNA independently of the extraction methods; while matrices with high degree of processing such as canned tuna, yielded the lowest amounts of DNA.
Figure 4. Loading plots from The Principal Component Analysis (PCA) carried out on all variables DO: A260/A280, DNA YIELD, and PCR RESULT: PCR amplification). All data in the PCA projections represent the means value of 6 replicates for each parameter.
Figura 4. Gráficos de carga del análisis de componentes principales (ACP) realizado sobre todas las variables DO: A260/A280, DNA YIELD, y RCP resultado: amplificación RCP. Todos los datos de las proyecciones del PCA representan el valor medio de seis réplicas para cada parámetro.
4. Conclusions
A label indicating authentication of imported products aimed at benefiting producers from developing countries will surely be well-accepted and demanded by an increasing sector of consumers. Additionally, it would encourage traders to avoid fraudulent commercialisation of products from developing countries, even if they have to pay for authentication certificates. Genetic tools for application in food fish traceability are abundant and affordable even for modest budgets, and now it is time to enforce their use in routine controls of international tuna trade. In this study, the processed tuna fish found in 53 samples was confirmed by DNA barcoding method to identify its authenticity. The amplification of extracted DNA was successfully performed. Considering the present results, initiation of method harmonisation and blockchain application should be reinforced to control international tuna trade.
Supplemental Material
Download MS Word (81.7 KB)Acknowledgments
This work was conducted within the SUREFISH project “Fostering Mediterranean fish ensuring traceability and authenticity” is part of the PRIMA Program supported by the European Union under the Grant Agreement number 1933.
Disclosure statement
No potential conflict of interest was reported by the author(s).
Supplementary material
Supplemental data for this article can be accessed on the publisher’s website.
Additional information
Funding
References
- Abdullah, A., & Rehbein, H. (2014). Authentication of raw and processed tuna from Indonesian markets using DNA barcoding, nuclear gene and character based approach. European Food Research and Technology, 239(4), 695–706. https://doi.org/10.1007/s00217-014-2266-0
- Altschul, S. F., Gish, W., Miller, W., Myers, E. W., & Lipman, D. J. (1990). Basic local alignment search tool. Journal of Molecular Biology, 215(3), 403–410. https://doi.org/10.1016/S0022-2836(05)80360-2
- Bartlett, S. E., & Davidson, W. S. (1992). FINS (forensically informative nucleotide sequencing): A procedure for identifying the animal origin of biological specimens. BioTechniques, 12 (3), 408–411 . PMID: 1571152https://pubmed.ncbi.nlm.nih.gov/1476715/
- Bauer, T., Weller, P., Hammes, W. P., & Hertel, C. (2003). The effect of processing parameters on DNA degradation in food. European Food Research and Technology, 217(4), 338–343. https://doi.org/10.1007/s00217-003-0743-y
- Besbes, N., Fattouch, S., & Sadok, S. (2011). Comparison of methods in the recovery and amplificability of DNA from fresh and processed sardine and anchovy muscle tissues. Food Chemistry, 129, 665–671 https://doi.org/10.1016/j.foodchem.2011.05.002.
- Chapela, M.J., Sotelo, C.G., Pérez-Martin, R.I., Pardo, M.A., Pérez-Villareal, B., Gilardi, P., &Riese, J. (2007). Comparison of DNA Extraction Methods from Muscle of Canned Tuna for Species Identification. Food Control, 18, 1211–1215.
- D’Amico, P., Armani, A., Gianfaldoni, D., & Guidi, A. (2016). New provisions for the labelling of fishery and aquaculture products: Difficulties in the implementation of Regulation (EU) n.1379/2013. Marine Policy, 71, 147–156 https://doi.org/10.1016/j.marpol.2016.05.026.
- FAO(2018)Overview of food fraud in the fisheries sector. fisheries and aquaculture circular No. 1165 Rome, Italy. ISBN 978-92-5-130402-0
- Ferrito, V., Raffa, A., Rossitto, L., Federico, C., Saccone, S., & Pappalardo, A. M. (2019). Swordfish or Shark Slice? A RapidResponse by COIBar–RFLP. Foods, 8 (11) , 537 https://doi.org/10.3390/foods8110537.
- Gordoa, A., Carreras, G., Sanz, N., & Viñas, J. (2017). Tuna species substitution in the spanish commercial Chain: A Knock-On Effect. PLoS ONE, 12 (1) , 1–15 doi:10.1371/journal. pone.0170809.
- Hall, T. A. (1999). BioEdit: A user-friendly biological sequence alignment editor and analysis program for Windows 95/98/NT. Nucleic Acids Symposium Series, 41, 9598.
- Hsieh, H. S., Chai, T. J., & Hwang, D. F. (2005). Rapid PCR–RFLP method for the identification of 5 billfish species. Journal of Food Science, 70(4), 246–249. https://doi.org/10.1111/j.1365-2621.2005.tb07167.x
- Jérôme, M., Lemaire, C., Bautista, J. M., Fleurence, J. L., & Etienne, M. (2003). Molecular phylogeny and species identification of sardines. Journal of Agricultural and Food Chemistry, 51(25), 7326–7332. https://doi.org/10.1021/jf034652t
- Kumar, S., Stecher, G., Li, M., Knyaz, C., & Tamura, K. (2018). MEGA X: Molecular Evolutionary Genetics Analysis across Computing Platforms Molecular Biology and Evolution 35 (6) 1547–1549 doi:10.1093/molbev/msy096 .
- Kumar, S., Tamura, K., & Nei, M. (2004). MEGA3: Integrated software or molecular evolutionary genetics analysis and sequence alignment. Briefings Bioinformatics, 5(2), 150–163. https://doi.org/10.1093/bib/5.2.150
- Martens, H., & Næs, T. (1989). Multivariate calibration. WILEY.
- Mata, W., Chanmalee, T., Punyasuk, N., & Thitamadee, S. (2020). Simple PCR-RFLP detection method for genus- and species-authentication offour types of tuna used in canned tuna industry. Food Control, 108, 106842. https://doi.org/10.1016/j.foodcont.2019.106842
- Nurilmala, M., Ushio, H., Kaneko, G., & Ochiai, Y. (2013). Assessment of commercial quality evaluation of yellowfin tuna (thunnus albacares) meat based on myoglobin properties. Food Science Technology, 19 (2) , 237–243 https://doi.org/10.3136/fstr.19.237.
- Pedrosa-Gerasmio, I. R., Babaran, R. P., & Santos, M. D. (2012). Discrimination of juvenile yellowfin (Thunnus albacares) and bigeye (T. obesus) Tunas using mitochondrial DNA control region and liver morphology. PLoS One, 7(4), 35604. https://doi.org/10.1371/journal.pone.0035604
- Piskata, Z., Pospisilova, E., & Borilova, G. (2017). Comparative study of DNA extraction methods from fresh and processed yellowfin tuna muscle tissue. International Journal of Food Properties, 20(S1), S430–S443. https://doi.org/10.1080/10942912.2017.1297953
- Prado, M., Pascoal, A., Calo-Mata, P., & Barros-Velázquez, J. (2005). Molecular methods for meat species identification and its application to foodstuffs and animal feeds. In A. P. Riley (Ed.), Food research, safety and policies (pp. 199–221). Nova Science Publishers Inc.
- Quinta, R., Gomes, L., & Teia Dos Santos, A. (2004). A mitochondrial DNA PCR-RFLP marker for population studies of the black scabbard fish (Aphanopus carbo). Journal of Marine Science, 6 (5) , 864–867 https://doi.org/10.1016/j.icesjms.2004.03.003.
- Saitou, N., & Nei, M. (1987). The neighbor-joining method: A new method for reconstructing phylogenetic trees. Molecular Biology and Evolution, 4(4), 406–425. https://doi.org/10.1093/oxfordjournals.molbev.a040454
- Sambrock, J., Fritsch, E. F., & Maniatis, T. (1989). Molecular cloning: A laboratory manual (2nd ed.). Cold Spring Harbor Laboratory press.
- Sotelo, C. G., Velasco, A., Perez-Martin, R. I., Kappel, K., Schroèder, U., Verrez-Bagnis, V., Jérôme, M., Mendes, R., Silva, H., Mariani, S., Griffiths, A., & Corriero, A. (2018). Tuna labels matter in Europe: Mislabelling rates in different tuna products. PLoS ONE, 13 (5) , 0196641. https://doi.org/10.1371/journal.pone.0196641
- Tamura, K., & Nei, M. (1993). Estimation of the number of nucleotide substitutions in the control region of mitochondrial DNA in humans and chimpanzees. Molecular Biology and Evolution, 10 (3) , 512–526 doi:10.1093/oxfordjournals.molbev.a040023.
- Van Ruth, S. M., & Granato, D. (2017). food identity, authenticity and fraud: The fullspectrum. Foods, 6(7), 49. https://doi.org/10.3390/foods6070049
- Velasco, A., Ramilo-Fernández, G., & Sotelo, C. G. (2020). Food Identity, authenticity and fraud: The full spectrum. Foods, 9(3), 286. https://doi.org/10.3390/foods9030286
- Wulansari, N., & Nurilmala, M. N. (2015). Detection of tuna and processed products based on protein and dna barcoding. Jurnal Pengolahan Hasil Perikanan Indonesia, 18 (2) , 119–127. https://doi.org/10.17844/jphpi.2015.18.2.119
- Xiong, X., Guardone, L., Giusti, A., Castigliego, L., Gianfaldoni, D., Guidi, A., & Andrea, A. (2016). DNA barcoding reveals chaotic labeling and misrepresentation of cod (鳕, Xue) products sold on the Chinese market. Food Control, 60, 519–532. https://doi.org/10.1016/j.foodcont.2015.08.028
- Yang, S., Li, M., Zhang, H., Guo, L., Chen, X., & Meng, Z. (2016). The complete mitochondrial genome of skipjack tuna (Katsuwonus pelamis) determined by HiSeq sequencing. Mitochondrial DNA partA DNA Mapping, Sequencing, and Analysis, 27 (6) , 3973–3974 doi:10.3109/19401736.2014.989510.