
ABSTRACT
The antibacterial activities (ABAC) of white calyces varieties (WCV) of Hibiscus sabdariffa L has not been explored in depth. The aims of the study were to determine the ABAC of WCV and the relationship of phenolic composition with ABAC. Four experimental WCV (W1, W2, W3, and W4), and one with red calyces (RCV) were used. The ABAC of ethanol extracts were tested against Gram (+) and Gram (-) bacteria. WCV showed higher ABAC than RCV, and it was associated to flavonoid content which was 60% higher in WCV with respect to RCV. The free phenolic content of W1, W2, and W4 varieties was 50% higher than that observed in RCV and W3 varieties. The standardized abundance of N-feruloyltiramine and quercetin in the extracts of WCV was related with their highest ABAC. WCV are a promising source of phenolic compounds with high ABAC.
1. Introduction
The search for new vegetal extracts with antimicrobial activities is an active research field (Arjabi et al., Citation2021; Guo et al., Citation2020; Niazmand & Razavizadh, Citation2021). The calyces of Hibiscus sabdariffa L. (Hs), commonly known as roselle, possess a high content of phenolic compounds, among which anthocyanins and phenolic acids are the most important (Camelo-Méndez et al., Citation2016; Jabeur et al., Citation2019; Reyes-Luengas et al., Citation2015). The antibacterial activity (ABAC) of Hs calyces extracts have been reported in different studies (Abdallah, Citation2016; Borrás-Linares et al., Citation2015; Morales-Cabrera et al., Citation2013). The ABAC associated to plant polyphenols is generally attributed to a disturbance of the function of bacterial cell membrane which retards bacterial growth or multiplication (Gonelimali et al., Citation2018). However, compounds such as quercetin could act essentially as DNA gyrase inhibitors (Cushnie & Lamb, Citation2005).
Of the phenolic compounds of Hs calyces, it is not clear which group is the most relevant for the ABAC. Previous reports have documented that anthocyanins are the principal phenolic compounds exhibiting ABAC against Escherichia coli and Salmonella typhimurium (Liu et al., Citation2005), although low or non ABAC were reported in a fraction from Hs calyces rich in anthocyanins (Do et al., Citation2016; Márquez-Rodríguez et al., Citation2020). Differences in terms of ABAC have been reported in function of the color of the calyces of Hs. Morales-Cabrera et al. (Citation2013) evaluated the ABAC of five Hs varieties (one with white calyces and four with red ones) and found that the highest ABAC corresponded to the white calyces variety, reporting inhibitory levels similar to chloramphenicol, and about 40% higher than the extracts obtained from red calyces varieties. However, high ABAC was reported by Borrás-Linares et al. (Citation2015) in extracts from both white and red calyces varieties. The studies reporting high ABAC in the white calyces variety attribute it to the presence of non-colored phenolics such as protocatechuic acid (Chao & Yin, Citation2009).
Several studies have been performed to elucidate the phenolic composition of Hs calyces differing in pigmentation (Borrás-Linares et al., Citation2015; Camelo-Méndez et al., Citation2016; Reyes-Luengas et al., Citation2015). The main differences between red and white calyces varieties are the presence of anthocyanins in the former, and higher content of flavanols in the latter (Camelo-Méndez et al., Citation2016). The phenolic acid profiles of white and red Hs varieties differ mainly in the proportion of p-hydroxybenzoic acid derivatives which is higher in white calyces varieties than in red ones (Reyes-Luengas et al., Citation2015).
Most of the studies about ABAC of extracts of Hs calyces against different pathogenic bacteria (Abdallah, Citation2016; Liu et al., Citation2005; Olaleye, Citation2007) have been performed with red calyces varieties (Abdallah, Citation2016; Majiya & Galstyan, Citation2020; Portillo-Torres et al., Citation2019), which are the most commercialized.
Today, reduced information on the ABAC of Hs varieties with white calyces exists, and limited data was found about the relationship between phenolic composition of white Hs calyces and their antibacterial activity. Information that would be relevant for a better use of white calyces Hibiscus varieties, and the development of specialized varieties to obtain extracts with high ABAC. This study was aimed to determine the ABAC (both bactericidal and bacteriostatic effects) of ethanol extracts from Hs varieties with white calyces and in one with red calyce as reference, and to evaluate the relationship between the phenolic composition of the extracts and their ABAC.
2. Materials and methods
2.1. Plant material
The dried calyces of five varieties of Hibiscus sabdariffa L. were used. Four experimental white calyces varieties (WCV) identified as White 1 (W1), White 2 (W2), White 3 (W3) and White 4 (W4), and a red calyces variety (RCV) identified as Negra Quiviquinta (NQ). The experimental varieties belong to the genetic breeding program of this specie at the National Institute of Forestry, Agriculture and Livestock Research (INIFAP). The plants were cultivated in the location of Rio Grande, Tututepec, Oaxaca, Mexico (16°00′46″N 97°26′15″O). The calyces were manually collected and dehydrated under the sun, spread out on a jute sack, on a cement platform, for two days. The color of the calyces was determined with the Hunter-Lab colorimeter (Mini Scan, Hunter Associates. Reston, VA. USA). The parameters: luminosity (L*), with 0 for black and 100 for white; a* (+a*, red color; -a*, green color) and b* (+b*, yellow color; -b*, blue color) were obtained with the equipment. Four readings were determined for each sample.
2.2. Preparation of the ethanol extracts
For the preparation of the extracts, a 10 g sample of dried calyces was placed into a glass jar and mixed with 200 ml of 96% ethanol. We choose this solvent based in previous results on ABAC of Hs calyces (Morales-Cabrera et al., Citation2013). The jars with the sample were manually shaken, and tightly closed and stored under dark conditions at room temperature for three days. Manual shaking of the glass jars was repeated every 24 hours. At the end of maceration period, the extract was separated and filtered with Whatman No, 4 paper. Afterward, the extract was placed in a flask, previously setting at constant weight, and concentrated to dryness in a rotary-evaporator (BUCHI Vacuum Controller model V-855). The flask with the residue was placed in an oven at 40–42ºC for 24 h, putting in a desiccator to cool, and weighted. The amount of solids recovered from each variety extract was registered. Extractions were performed in duplicated.
2.3. Bacterial isolates
Four different bacterial strains were used: Escherichia coli (ATCC 25,922), Staphylococcus aureus (ATCC 25,923), Salmonella choleraesuis (ATCC 7001), and Salmonella typhimurium (ATCC 19,585). Strains were provided by the Microbial Genetic Resources Laboratory of the National Center of Genetic Resources (CNRG) of INIFAP, located in Tepatitlan de Morelos, Jalisco. The strains were activated on nutrient agar slant (Difco™, Fisher scientific) and incubated for 18–24 h at 37°C. Then, tubes were preserved at 4°C and used as stock solution.
2.4. Bacterial suspensions
Fresh biomass of each bacterial strain was harvested from nutrient plates inoculated by cross streak and incubated at 37°C for 18–24 h. Biomass was briefly transferred into culture tubes containing nutrient broth (Difco™, Fisher scientific) and vortexed until reaching a concentration of 1.5 × 10⁸ CFU/ml based on the McFarland turbidity standards.
2.5. Anti-bacterial assays
Serial dilutions from the solids of Hs extract suspended in sterile distilled water (10% w/v) were prepared in tubes containing 10 ml of Mueller-Hinton sterile broth. Two Hs concentrations (10 mg/ml and 1 mg/ml) of each Hs extract were tested. Sterile assays tubes were inoculated with 10 µl of the 24-h culture bacterial suspension (108 CFU/mL) and 300 µL of Hs. Suspensions were briefly vortexed and incubated at 37°C for 24 h. Negative controls consisted of Muller-Hinton broth inoculated with each pathogen without the Hs extract addition, but with the inclusion of 300 µl of a solution of ampicillin, 100 mM. Meanwhile, tubes with Muller-Hinton sterile broth inoculated with each pathogen without Hs extract and antibiotic free, respectively were used as positive control samples. Samples were prepared in quadruplicate.
2.6. Inhibitory capacity of the extract by tube dilution assay
Turbidity measurements through UV-vis spectroscopy from the 24-h bacterial suspensions with or without the addition of Hs extracts were performed to assess pathogen inhibitions following the dilution test technique with some adjustments (Balouiri et al., Citation2016). Each bacterial suspension was gently vortexed and transferred to a disposable cuvette to measure its turbidity, expressed as absorbance units at 550 nm using a UV-vis spectrometer (Jenway, model 6705. England). Measurements were performed in duplicate for each sample, including the positive and negative controls. Additionally, at the end of the assay and to elucidate if the bacterial inhibition corresponded to a bactericidal or bacteriostatic effect, 100 µl aliquots from the tubes that did not showed changes in turbidity were plated on nutritive agar and incubate at 37°C for 24 h to assess if cultures exhibited viability or not.
2.7. Analysis of phenolic compounds in ethanol Hibiscus extracts
2.7.1. Total soluble phenolics
The quantification of total soluble phenolics (TSP) in the ethanol extract used for the antimicrobial activity was performed by the Folin-Ciocalteu method (Singleton & Rossi, Citation1965). A standard curve of gallic acid (Sigma/Aldrich, MN) was prepared to calculate concentrations. Results were expressed as mg equivalents of gallic acid (GAE)/100 g of dry weight (DW) of calyces. Analysis were performed in duplicate.
2.7.2. Total anthocyanin content
The determination of total anthocyanin content (TAC) in the extracts was done according to the methodology described by Moreno et al. (Citation2005). A standard curve of cyanidin-3-glucoside (Polyphenols, NW) was prepared to calculate TAC concentration as mg equivalents of cyanidin 3-glucoside (CGE)/100 g DW of calyces.
2.7.3. Phenolic acids
The content of phenolic acids in the ethanol extracts was determined using the method described by Bakan et al. (Citation2003), based in the quantification of free, glycosylated and esterified phenolic acids. This method was applied with the modifications outlined by Reyes-Luengas et al. (Citation2015). Briefly, for free phenolic acids (FPA) determination, a volume of 25 ml of each extract was concentrated using a rotary-evaporator (BUCHI Vacuum Controller model V-855) at low pressure and temperature levels. The dried residue was dissolved in 25 ml of distilled water and pH was adjusted at 2 using dilute HCl (0.1N), and three successive liquid extractions with 20 ml of ethyl acetate were performed, recovering the organic phase. The organic phases were pooled and concentrated to dryness in the rotary-evaporator. The residue was dissolved in 2 mL of methanol HPLC grade, deposited in dark vials and storage at −20ºC until analysis.
The aqueous phase of FPA was adjusted to 20 ml with distilled water and divided in two equal volumes; one was used for the analysis of glycosylated phenolic acids (GPA), and the other one for the analysis of the esterified phenolic acids (EPA). For GPA, diluted FPA was mixed with 10 ml of 2N HCl and stored at 4ºC for one hour; then adjusted to pH 2 using a solution of sodium hydroxide and three successive extractions with ethyl acetate were performed, recovering in each case the organic phase. The organic phases were pooled and concentrated to dryness in a rotary evaporator; the residue was dissolved in 2 ml of methanol. For obtaining the EPA, 10 ml of aqueous phase from FPA was combined with 10 ml of 2 N NaOH and digested for 3 h under darkness and nitrogen atmosphere. After digestion, the pH of the solution was adjusted at 2 with 6 M HCl, and it was followed the same procedure of liquid-liquid extraction with ethyl acetate (EA) described for GPA. The methanol extracts of the three fractions (FPA, GPA and EPA) acids were used for total phenolic quantification by Folin-Ciocalteu method, as described previously.
2.7.4. Flavonoids
The colorimetric method of Chang et al. (Citation2002), was used to flavonoids (FLAV) determination. For quantification, a calibration curve was prepared using catechin solubilized in methanol. The total FLAV content was expressed as micrograms of catechin equivalent per 100 g of dried calyx (µg CE/100 g DW).
2.7.5. Hibiscus extracts metabolites pre-identification by UPLC-QTOF HRMS
Dried ethanol extracted samples were reconstituted in 2 mL of acetonitrile and diluted 5 times in ultrapure water containing 1% formic acid. Samples (10 µL) were injected on an Ultra-Performance Liquid Chromatography system (UPLC, Waters Acquity class I, Waters Corporation, MA, USA). Compounds separation was achieved using a Phenyl-Hexyl CSH 2.1 × 150 mm, 1.7 µm column (Waters Corporation, MA, USA), with a binary solvent comprised of A: ultra-pure water with 0.1% formic acid, and B: acetonitrile with 0.1% formic acid together with a gradient programmed as follow, at initial time (%A/%B) 95/5 maintained for 1.0 min, then at 13.0 min 100% B and maintained for 1.0 min, then at 14.10 min changed to initial condition (95/5) and kept for 1.0 min for column re-equilibration. The column was maintained at 30°C and the autosampler at 5°C. LC flow was kept at 0.4 ml/min. The mass spectrometer comprised an orthogonal quadrupole time of flight high resolution mass spectrometer (Q-TOF HRMS Synapt G1, Waters Corporation, MA., USA), equipped with an electrospray ionization (ESI) source which was operated in both positive and negative polarities. Setting for mass spectrometer was as follow: capillary voltage 3.0 and 2.3 kV for positive and negative ionization mode respectively, sampling and extraction cone voltage 40 and 4.0 kV respectively, ESI source and desolvation temperature were set at 110 and 300°C respectively. Data were acquired in MSE experiments; using Argon as the collision gas with a collision energy in the trap region of 6 V (function 1, low energy) and ranged from 10 to 40 V (function 2, high energy) (Cervantes-Hernández et al., Citation2019). Data format was collected in continuum mode with a MS scan time of 1.5 s. Data analysis was carried out with Progenesis QI for small molecules (Non-Linear Dynamics, Waters Corporation, UK), for automatic alignment, normalization, deconvolution, and compound pre-identification. Pre-identification was performed using Chemspider Databases (PlantCyc, Plant Metabolic Network, KEGG, HMDB and ChEBI) and with an in-house database with a minimum match of 90% for precursor ions, MS/MS data and isotope distribution was included for increasing match score values.
2.8. Statistical analysis
Data obtained from pathogen inhibition assessed by dilution tube assay were analyzed under a completely random design using the SAS™ version 9.4. Statistical software by the lineal general model (GLM) procedure and means were analyzed by Tukey´s pairwise comparison (P < .05).
3. Results and discussion
3.1. Color of the calyces and solids recovered from the extracts
According to color parameter values, the WCV of Hs (W1, W2, W3 and W4) showed a yellowness tone while RCV (NQ) exhibited a red tone (). Solids recovered from WCV was about two times of that from RCV. This result is probably due to that anthocyanins, which are one of the main phenolic compounds in red calyces of Hs, are poorly extracted with ethanol. However, the value of solids is similar (46 mg/g) to that reported by Portillo-Torres et al. (Citation2019) for a red calyx variety extracted with acetone as solvent. The use of water as solvent led to recovering higher amounts of solids from Hs calyces than using ethanol, but the ABAC of ethanol extract is superior to water extract (Gonelimali et al., Citation2018).
Table 1. Color of the calyces and solids recovered in the ethanol extracts of Hibiscus sabdariffa L. varieties.
Differences among WCV in solids recovery could be explained by genetic factors, due to extraction was done in similar conditions for all of them.
3.2. In vitro antibacterial tests
According to the turbidity values (considered as bacterial growth indicator), expressed in absorbance units, all WCV solution of the extracts at a concentration of 10 mg/ml exhibited better ABAC than RCV (NQ) (). The evaluation of each extract showed that RCV extract at 10 mg/ml reduced the growth of the bacteria (absorbance value around 0.2). However, in a lower concentration (1 mg/ml), the reduction of bacteria growth was only observed on S. choleraesuis ().
Figure 1. Quantitative results of ABAC of ethanol extracts from Hibiscus sabdariffa L. (Hs) calyces with different pigmentation. a): red calyces (NQ), b) white calyces 1 (W1), c) white calyces 2 (W2), d) white calyces 3 (W3), e) white calyces 4 (W4). Bars corresponding to the same pathogen, in each Hs extract, that does not share the same letter are significant different (p < .05).
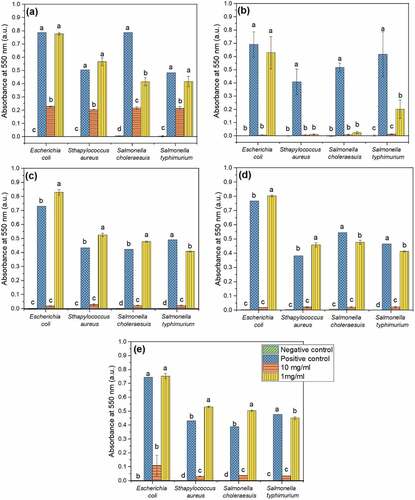
Regarding the WCV, the extract exhibiting the best performance in terms of inhibitions was the variety identified as W1, limiting the increase in turbidity, considered a bacterial growth indicator, better than the rest of the extracts evaluated. It is essential to mention that no significant differences were observed (P > .05) in the turbidity developed in the positive controls, which consisted of the inoculation of each pathogen in the tubes containing cultures medium free of antibiotics and of Hs extracts. Reaffirming that the observed inhibition on bacterial growth can be attributed to the presence of the extracts evaluated.
Concerning extracts diluted at a 1.0 mg/ml concentration, only the Hs extract obtained from the W1 variety exhibited good inhibitory capacity against S. aureus and S. choleraesuis, principally (). at 10 mg/ml concentration prevented the growth of all bacteria at levels equal to that achieved by the negative control. At a concentration of 1.0 mg/ml, the solution was effective in reducing the growth of all bacteria, except E. coli (). The extract corresponding to the W2 variety inhibited the growth of all challenged bacteria when used at a concentration of 10 mg/ml. However, when it was incorporated at a concentration of 1.0 mg/ml, it only slightly limited the growth of S. typhi, which showed an absorbance lower than the positive control (). Similar results were observed with the W3 extract, but in this case, the extract concentration at 1.0 mg/ml evinced absorbance values slightly lower than positive control (). The extract from W4 at a concentration of 10 mg/ml had equal absorbance than that of the negative control () for S. typhi, what means that control the growth of bacterium as did the ampicillin.
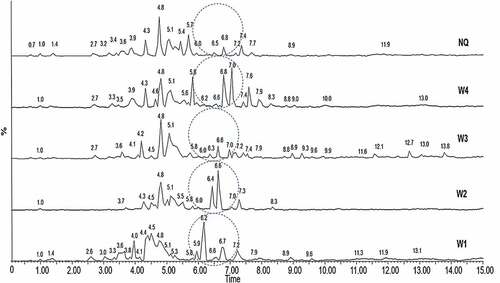
Figure 2. Total ion chromatogram (TIC) by negative ion mode electrospray ionizations mass spectrometry (ESI/MS) from the ethanol extracts of white calyces (W1, W2, W3 and W4) and red calyces (NQ) Hbiscus sabdariffa L. varieties.
A higher ABAC for WCV over RCV was documented by Morales-Cabrera et al. (Citation2013), when evaluating ethanol extracts from four Hs varieties with red calyces and one with white calyces. However, Borrás-Linares et al. (Citation2015) assessed the ABAC of aqueous ethanol (30:70 v/v) extracts from 25 Hs varieties (22 with red calyces and 3 with white calyces) and found that the extracts with the highest inhibitory effect on the growth of S. aureus and E. coli were that from two RCV and one with WCV. These last authors did not find any relation of the ABAC of Hs extracts and the content of each group of phenolic compounds analyzed. Abdel-Shafi et al. (Citation2019) evaluated the ABAC of a crude ethanol-rich pigment extract from H. sabdariffa, B. oleracea, and B. vulgaris against Gram (+) and Gram (-) bacteria. The best results were observed with H. sabdariffa in terms of the inhibition diameter of S. aureus and E. coli. In the same study, but with the use of the quantitative inhibition method, authors tested the minimum inhibitory concentration (50 µg/ml) and reported growth of S. aureus and E. coli with values of absorbance of 0.2–0.3, with no difference between the two bacteria.
No differences were appreciated in inhibition capability on Gram (+) or Gram (-) bacteria. In this context, due to the characterization of 25 Hs Mexican varieties, Borrás-Linares et al. (Citation2015) reported that the most sensitive bacteria were Gram (+), Staphylococcus aureus and Micrococcus luteus; meanwhile less sensitive were E. coli and Salmonella enteritidis when ethanol extracts were used. Similar to our results, the authors pointed out that both (red and colorless) types of calices exhibited antimicrobial attributes, although red-calyx varieties seemed to be more efficient. Similarly, Ruban and Gajalakshmi (Citation2012) reported that when ethanol extracts of Hibiscus rosa-sinensis were used against selected human pathogens, E. coli exhibited low sensibility, unlike what was observed in our results, which demonstrated that E. coli was inhibited by the extracts.
To elucidate the inhibitory effect induced on the selected pathogens, from each tube with no changes in absorbance, an aliquot of 100 µL were plated on nutrient agar to assess if the microorganism remained viable (bacteriostatic effect) or not (bactericidal effect). W1-extract (used at a concentration of 10 mg/ml) exhibited a bactericidal effect for all the selected pathogens except against S. typhi, which exhibited a bacteriostatic effect. The extract of this Hs variety showed a marked antimicrobial activity against S. aureus. The high ABAC of W1 extract observed with the quantitative results () was confirmed through the bacteriostatic and bactericidal effect assays. The W2 extract at a concentration of 10 mg/ml, worked as bactericidal upon E. coli and S. choleraesuis, and as a bacteriostatic agent against S. aureus and S. typhi ().
Table 2. Qualitative and quantitative results of the inhibition tests against the pathogens for each of the concentration of the solutions prepared with the solids recovered from the extracts of the calyces varieties of Hibiscus sabdariffa L.
White calyx variety W3 extracts only exhibited bactericidal potential against E. coli at a 10 mg/mL concentration. Meanwhile, white calyx variety W4 served as bactericidal compounds for S. choleraesuis and S. typhi and as a bacteriostatic agent against E. coli and S. aureus (). The bacteria most sensitive to the extracts of Hs calyces were S. aureus, a result that coincides with that reported by other authors (Abdel-Shafi et al., Citation2019; Borrás-Linares et al., Citation2015). The most resistant bacterium was S. typhi.
3.3. Phenolic composition of the extracts
The phenolic composition of ethanol extracts from Hs calyces was affected by the variety (p ≤ 0.05). The highest total soluble phenolic (TSP) were in W1 and W4 extracts, while the lowest corresponded to NQ and W3 extracts (). High variability in TSP was observed among the white-calyx varieties, but it was close to the range reported by Borrás-Linares et al. (Citation2015) in two varieties with the same color of calyces (2400 to 8100 µg/g of DW.
Table 3. Phenolic composition of ethanol extracts from Hibiscus sabdariffa L. calyces varieties used in the antimicrobial activity evaluation.
As expected, anthocyanins were only detected in RCV NQ, and the value was lower than that reported in an aqueous extract (573 mg CGE/100 g DW) by Sánchez-Feria et al. (Citation2017). Differences in anthocyanin content could be explained by the growing conditions of the plant (Sánchez-Feria et al., Citation2018), and the solvent used in the extraction (Jabeur et al., Citation2019).
In average, flavonoids content was 60% higher in WCV with respect to RCV. (). Borrás-Linares et al. (Citation2015) found that WCV had 30% higher flavonoid content than RCV. Among the most common non-anthocyanin flavonoids in Hs calyces are kaempferol, myricetin and quercetin, and different derivatives of these flavonols. The reported flavonols content varied between 5.01 and 5.23 mg/g in RCV, when the compounds are extracted with ethanol and quantified by HPLC/MS (Jabeur et al., Citation2019; Pimentel-Moral et al., Citation2018).
Regarding the phenolic acids, in all varieties the most abundant fraction was FPA, highest FPA were in W1, W2 and W4 This result agree with Reyes-Luengas et al. (Citation2015). The lowest GPA content was exhibited in NQ variety, meanwhile the highest corresponded to W1 variety. The EPA fraction showed similar variation (8.8 to 138.9 mg GAE/100 g DW) to GPA, with the lowest concentration scores for NQ and the highest in W1 variety.
Of the three groups of phenolic compounds quantified, for RCV the abundance was in the order phenolic acids > anthocyanins > flavonoids, this result agrees with previous reports (Camelo-Méndez et al., Citation2016; Jabeur et al., Citation2019). For WCV, this order was phenolic acids > flavonoids.
The W1 and W4 varieties, with the highest content of phenolic acids, also exhibited better ABAC, than the rest of the varieties, probably associated to phenolic acids composition (Cueva et al., Citation2010). In FPA and EPA fractions, WCV presented higher content of p-hydroxybenzoic and protocatechuic acid derivatives than RCV (Reyes-Luengas et al., Citation2015). The ABAC of protocatechuic acid has been reported by Chao and Yin (Citation2009), and the p-hydroxybenzoic acid esters are formally antibacterial agents (Aalto et al., Citation1953). Other phenolics reported to be 30% higher in WCV of Hs with respect to RCV, are the flavanols (Camelo-Méndez et al., Citation2016), to which belong the proanthocyanidins, that possess a high antibacterial activity (Buzzini et al., Citation2007).
3.4. Hibiscus extracts metabolites pre-identification
Our analyses using UPLC-QTOF HRMS allowed detection of a total of 332 features for the whole dataset that comprised four varieties with white calyces and one with red calyces. Our target compounds were all those compounds different to anthocyanins. Electrospray ionization in positive mode showed a total of 178 features in which only 67 features were pre-identified (Table S1 in the online supplement), while in negative mode 154 features were detected of which only 66 were pre-identified (onlineTable S2). The sample chromatograms in negative ionization mode showed differences among varieties mainly in the compounds with retention time around 6 and 7 min, which were less abundant in samples W3 and NQ, with respect to the other samples ().
The phenolic compounds pre-identified in negative mode in the ethanol extracts from Hs calyces are completely different to those reported by Alara and Abdurhman (Citation2019), who identified 77 features in a microwaved ethanol extract from Hs calyces. In is presented the phenolic compounds pre-identified (both positive and negative modes), that are most commonly cited by other authors (Borrás-Linares et al., Citation2015; Herranz-Lopez et al., Citation2012; Jabeur et al., Citation2019), and other additional compounds reported by the first time in Hs ethanol extracts. The most abundant compounds pre-identified for all five varieties were myricetin 3-sambubioside, hibiscus acid, glycyrin, myricetin 3-galactoside, 3-O-caffeoylquinic acid, hibiscetin, quercetin, kaempferol 3-O-rutinoside, quercetin 3-glucoside and rutin among them (Table S2). Pre-identified compounds with antimicrobial activities detected were macrocarpal 1, N-feruloyltyramine, 2-hexaprenyl-6-methoxy-1,4-benzoquinol, 2-galloyl-1,4-galactarolactone methyl ester, and quercetin. Of these compounds, N-feruloyltyramine and quercetin are frequently reported to be present in extracts of Hibiscus calyces with ABAC (Borrás-Linares et al., Citation2015; Do et al., Citation2016), and they were most abundant in Hs calices with high ABAC.
Table 4. Compounds pre-identified in ethanol extracts from calyces of Hs and analytical relevant data obtained from the analysis using UPLC-QTOF HRMS (Some information about pre-identified compounds was obtained from https://www.chemspider.com/Chemical-Structure).
4. Conclusions
The antibacterial activity of the ethanol extracts obtained from the calyces of five Hibiscus sabdariffa varieties evaluated was different among varieties. Besides, not all the evaluated microorganisms exhibited the same susceptibility to the extracts. In general, white calyx varieties showed higher antibacterial activity compared to its counterpart with red calyces. The content of flavonoids and free phenolic acids in the ethanol extracts of the white calyces varieties could be a key factor in defining their antibacterial activity. The compounds N-feruloyltyramine and quercetin were most abundant in those varieties with outstanding antibacterial activity. According to the results obtained, white calyces varieties of Hibiscus sabdariffa are promise source of antimicrobial compounds.
Supplemental Material
Download MS Word (40.4 KB)Supplemental Material
Download MS Word (37.3 KB)Acknowledgments
Authors are very grateful with María Guadalupe Segundo Palacios from Universidad Autónoma Chapingo, Mexico for her valious help in bacterial assays.
Disclosure statement
No potential conflict of interest was reported by the authors.
Supplementary material
Supplemental data for this article can be accessed online at https://doi.org/10.1080/19476337.2022.2152099.
Additional information
Funding
References
- Aalto, R. R., Firman, M. C., & Rigler, N. E. (1953). p-Hydroxybenzoic acid esters as preservatives: I. Uses, antibacterial and antifungal studies, properties and determination. Journal of the American Pharmaceutical Association (Scientific Ed), 42(8), 449–453. https://doi.org/10.1002/jps.3030420802
- Abdallah, E. M. (2016). Antibacterial efficiency of the Sudanese roselle (Hibiscus sabdariffa L.), a famous beverage from Sudanese folk medicine. Journal of Intercultural Ethnopharmacology, 5(2), 186–190. https://doi.org/10.5455/jice.20160320022623
- Abdel-Shafi, S., Al-Mohammadi, A. R., Sitohy, M., Mosa, B., Ismaiel, A., Enan, G., & Osman, A. (2019). Antimicrobial activity and chemical constitution of the crude, phenolic-rich extracts of Hibiscus sabdariffa, Brassica oleracea and Beta vulgaris. Molecules, 24(23), 4280. https://doi.org/10.3390/molecules24234280
- Alara, O. R., & Abdurhman, N. H. (2019). Microwave-assisted extraction of phenolics from Hibiscus sabdariffa calyces: Kinetic modelling and process intensification. Industrial Crops and Products, 137, 528–535. https://doi.org/10.1016/j.indcrop.2019.05.053
- Arjabi, A., Anarjan, N., & Jafarizadeh-Malmiri, H. (2021). Effects of extracting solvent composition on antioxidant and antibacterial activities of Alhagimaurorum extracts. Journal of Food Processing and Preservation, 45(3), e15300. https://doi.org/10.1111/jfpp.15300
- Bakan, B., Bily, A. C., Melcion, D., Cahagnier, B., Regnault-Roger, C., Philogene, B. J., & Richard-Molard, D. (2003). Possible role of plant phenolics in the production of trichothecenes by Fusarium graminearum strains on different fractions of maize kernels. Journal of Agricultural and Food Chemistry, 51(9), 2826–2831. https://doi.org/10.1021/jf020957g
- Balouiri, M., Sadiki, M., & Koraichi, S. (2016). Methods for in vitro evaluating antimicrobial activity: A review. Journal of Pharmaceutical Analysis, 6(2), 71–79. https://doi.org/10.1016/j.jpha.2015.11.005
- Borrás-Linares, I., Fernández-Arroyo, S., Arráez-Roman, D., Palmeros-Suárez, P. A., Del Val-Díaz, R., Andrade Gonzáles, I., Fernández-Gutiérrez, A., Gómez-Leyva, J. F., & Segura-Carretero, A. (2015). Characterization of phenolic compounds, anthocyanidin, antioxidant and antimicrobial activity of 25 varieties of Mexican Roselle (Hibiscus sabdariffa). Industrial Crops and Products, 69, 385–394. https://doi.org/10.1016/j.indcrop.2015.02.053
- Buzzini, P., Turchetti, B., Ieri, F., Goretti, M., Branda, E., Mulinacci, N., & Romani, A. (2007). Catechins and Proanthocyanidins: Naturally occurring O-heterocycles with antimicrobial activity. In M. T. H. Khan (Ed.), Bioactive Heterocycles IV (Vol. 10, pp. 239–263). Springer. https://doi.org/10.1007/7081_2007_065
- Camelo-Méndez, G. A., Jara-Palacios, M. J., Escudero-Gilete, M. L., Gordillo, B., Hernanz, D., Paredes-López, O., Vanegas-Espinoza, P. E., Del Villar-Martínez, A. D., & Heredia, F. J. (2016). Comparative study of phenolic profile, antioxidant capacity, and color-composition relation of Roselle cultivars with contrasting pigmentation. Plant Foods for Human Nutrition, 71(1), 109–114. https://doi.org/10.1007/s11130-015-0522-5
- Cervantes-Hernández, F., Alcalá-González, P., Martínez, O., & Ordaz-Ortiz, J. J. (2019). Placenta, pericarp, and seeds of tabasco chili pepper fruits dhow a contrasting diversity of bioactive metabolites. Metabolites, 9(10), 206. https://doi.org/10.3390/metabo9100206
- Chang, C. C., Yang, M. H., Wen, H. M., & Chern, J. C. (2002). Estimation of total flavonoid content in propolis by two complementary colorimetric methods. Journal of Food and Drug Analysis, 10(3), 178–182. https://doi.org/10.38212/2224-6614.2748
- Chao, C. Y., & Yin, M. C. (2009). Antibacterial effects of roselle calyx extracts and protocatechuic acid in ground beef and apple juice. Foodborne Pathogens and Disease, 6(2), 201–206. https://doi.org/10.1089/fpd.2008.0187
- Cueva, C., Moreno-Arribas, M. V., Martín-Álvarez, P. J., Bills, G., Vicente, M. F., Basilio, A., López-Rivas, C., Requena, T., Rodríguez, J. M., & Bartolomé, B. (2010). Antimicrobial activity of phenolic acids against commensal, probiotic and pathogenic bacteria. Research in Microbiology, 161(5), 372–382. https://doi.org/10.1016/j.resmic.2010.04.006
- Cushnie, T. P., & Lamb, A. J. (2005). Antimicrobial activity of the flavonoids. International Journal of Antimicrobial Agents, 26(5), 343–356. https://doi.org/10.1016/j.ijantimicag.2005.09.002
- Do, T. H. A., Le, H. H., Kitsamone, S., Nguyen, T. U., & Nguyen, Q. H. (2016). In vitro antibacterial activity of quercetin containing extract from Hibiscus sabdariffa L. calyces. VNU Journal of Science: Natural Sciences and Technology, 32(1S), 147–152. http://repository.vnu.edu.vn/handle/VNU_123/61533
- Gonelimali, F. D., Lin, J., Miao, W., Xuan, J., Charles, F., Chen, M., & Hatab, S. R. (2018). Antimicrobial properties and mechanism of action of some plant extracts against food pathogens and spoilage microorganisms. Frontiers in Microbiology, 9, 1639. https://doi.org/10.3389/fmicb.2018.01639
- Guo, C., Shan, Y., Yang, Z., Zhang, L., Ling, W., Liang, Y., Ouyang, Z., Zhong, B., & Zhang, J. (2020). Chemical composition, antioxidant, antibacterial, and tyrosinase inhibition activity of extracts from Newhall navel orange (Citrus sinensis Osbeck cv. Newhall) peel. Journal of the Science of Food and Agriculture, 100(6), 2664–2674. https://doi.org/10.1002/jsfa.10297
- Herranz-Lopez, M., Fernandez-Arroyo, S., Perez-Sanchez, A., Barrajon-Catalan, E., Beltran Debon, R., Menendez, J. A., Alonso-Villaverde, C., Segura-Carretero, A., Joven, J., & Micol, V. (2012). Synergism of plant-derived polyphenols in adipogenesis: Perspectives and implications. Phytomedicine, 19(3–4), 253–261. https://doi.org/10.1016/j.foodchem.2014.05.002
- Jabeur, I., Pereira, E., Caleja, C., Calhelha, R. C., Soković, M., Catarino, L., Barros, L., & Ferreira, I. C. F. R. (2019). Exploring the chemical and bioactive properties of Hibiscus sabdariffa L. calyces from Guinea-Bissau (West Africa). Food & Function, 10(4), 2234–2243. https://doi.org/10.1039/C9FO00287A
- Liu, K. S., Tsao, S. M., & Yin, M. C. (2005). In vitro antibacterial activity of roselle calyx and protocatechuic acid. Phytotherapy Research, 19(11), 942–945. https://doi.org/10.1002/ptr.1760
- Majiya, H., & Galstyan, A. (2020). Dye extract of calyces of Hibiscus sabdariffa has photodynamic antibacterial activity: A prospect for sunlight-driven fresh produce sanitation. Food Science & Nutrition, 8(7), 3200–3211. https://doi.org/10.1002/fsn3.1580
- Márquez-Rodríguez, A. S., Nevárez-Baca, S., Lerma-Hernández, J. C., Hernández-Ochoa, L. R., Nevárez-Moorillon, G. V., Gutiérrez-Méndez, N., Muñóz-Castellanos, L. N., & Salas, E. (2020). In vitro antibacterial activity of Hibiscus sabdariffa L. Phenolic extract and its in situ application on shelf-life of beef meat. Foods, 9(8), 1080. https://doi.org/10.3390/foods9081080
- Morales-Cabrera, M., Hernández-Morales, J., Leyva-Rúelas, G., Salinas-Moreno, Y., Soto-Rojas, L., Castro-Rosas, J., & Javier, C. R. (2013). Influence of variety and extraction solvent on antibacterial activity of roselle (Hibiscus sabdariffa L.) calyxes. Journal of Medicinal Plants Research, 7(31), 2319–2322. https://doi.org/10.5897/JMPR12.1242
- Moreno, S. Y., Salas, S. G., Rubio, H. D., & Ramos, L. N. (2005). Characterization of anthocyanin extracts from maize kernels. Journal of Chromatographic Science, 43(9), 483–487. https://doi.org/10.1093/chromsci/43.9.483
- Niazmand, R., & Razavizadh, M. B. (2021). Ferula asafoetida: Chemical composition, thermal behavior, antioxidant and antimicrobial activities of leaf and gum hydroalcoholic extracts. Journal of Food Science and Technology, 58(6), 2148–2159. https://doi.org/10.1007/s13197-020-04724-8
- Olaleye, M. T. (2007). Cytotoxicity and antibacterial activity of methanolic extract of Hibiscus sabdariffa. Journal of Medicinal Plants Research, 1(1), 9–13.
- Pimentel-Moral, S., Borrás-Linares, I., Lozano-Sánchez, J., Arráez-Román, D., Martínez-Férez, A., & Segura-Carretero, A. (2018). Microwave-assisted extraction for Hibiscus sabdariffa bioactive compounds. Journal of Pharmaceutical and Biomedical Analysis, 156, 313–322. https://doi.org/10.1016/j.jpba.2018.04.050
- Portillo-Torres, L. A., Bernardino-Nicanor, A., Gómez-Aldapa, C. A., González-Montiel, S., Rangel-Vargas, E., Villagómez-Ibarra, J. R., González-Cruz, L., Cortés-López, H., & Castro-Rosas, J. (2019). Hibiscus acid and chromatographic fractions from Hibiscus sabdariffa Calyces: Antimicrobial activity against multidrug-resistant Pathogenic Bacteria. Antibiotics, 8(4), 218. https://doi.org/10.3390/antibiotics8040218
- Reyes-Luengas, A., Salinas-Moreno, Y., Ovando-Cruz, M. E., Arteaga-Garibay, R. I., & Martínez-Peña, M. D. (2015). Analysis of phenolic acids and antioxidant activity of aqueous extracts of jamaica (Hibiscus sabdariffa L.) varieties with calyxes of different colors. Agrociencia, 49(3), 277–290. https://agrociencia-colpos.org/index.php/agrociencia/article/view/1146/1146
- Ruban, P., & Gajalakshmi, K. (2012). In vitro antibacterial activity of Hibiscus rosa–sinensis flower extract against human pathogens. Asian Pacific Journal of Tropical Biomedicine, 2(5), 399–403. https://doi.org/10.1016/s2221-1691(12)60064-1
- Sánchez-Feria, C., González-Hernández, V. A., Salinas-Moreno, Y., & Cruz-Huerta, N. (2017). Genotype and environmental effects on physical and chemical qualities of Mexican varieties of Hibiscus sabdariffa L. flowers. Agrociencia, 51(5), 525–541. https://agrociencia-colpos.org/index.php/agrociencia/article/view/1308/1308
- Sánchez-Feria, C., Salinas-Moreno, Y., González-Hernández, V. A., Ybarra-Moncada, M. C., Cruz-Huerta, N., & Soto-Hernández, R. M. (2018). Genotipo y ambiente de producción afectan la composición fenólica, ácidos carboxílicos y acidez titulable de cálices de Hibiscus sabdariffa L. Revista Fitotecnia Mexicana, 41(4), 373–383. https://doi.org/10.35196/rfm.2018.4.373-383
- Singleton, V. L., & Rossi, J. A. (1965). Colorometric of total phenolics with phosphomolybdic-phosphotungstic acid reagents. American Journal of Enology and Viticulture, 16(3), 144–158.