
 ?Mathematical formulae have been encoded as MathML and are displayed in this HTML version using MathJax in order to improve their display. Uncheck the box to turn MathJax off. This feature requires Javascript. Click on a formula to zoom.
ABSTRACT
Long-term consumption of rapidly digestible starches is a major factor associated with diabetes and other metabolic diseases. In this study, cassava starch (CS) was used to investigate interactions between starch and different forms of glutenin protein and the effect of these interactions on in vitro digestibility. First, CS and natural glutenin (Glu), glutenin hydrolysate (GPH), or citric acid modified glutenin (CA-Glu) were heat treated. The physicochemical properties and digestibility of CS were then measured using differential scanning calorimetry, Raman spectroscopy, X-ray diffraction, and in vitro digestion methods. The results showed that Glu, GPH and CA-Glu increased starch gelatinization enthalpy. Glu, GPH, and CA-Glu also enhanced the ordered structure of starch and starch – protein interactions. Further, in vitro digestion studies showed that the addition of glutenin reduced CS digestibility, wherein CA-Glu had the largest impact. These results have implications for reducing effects of the human diet on disease and warrant further study.
1. Introduction
Starch is major carbohydrate source in the daily human diet. Regardless of origin, starch types can be divided into rapidly digestible starch (RDS), slowly digestible starch (SDS), and resistant starch (RS) groups (Englyst et al., Citation1992). It has been shown previously that levels of RDS are a major factor associated with obesity, diabetes, coronary heart diseases, cardiovascular disease, and other metabolic diseases (Chung et al., Citation2008; Lehmann & Robin, Citation2007; Zhang & Hamaker, Citation2009). This suggested that the incidence of these diseases could be reduced by increasing the contents of SDS and RS in the diet, and reducing the effects of RDS. Thus, there is great interest in designing edible supplements that can increase SDS and RS and reduce glycemic index levels in the blood.
The hydrolysis rate of starches is related to many factors. For example, starch structure: crystalline structure, particle size, lamellar structure, and chain length distribution (Al-Rabadi et al., Citation2009; Chengdeng et al., Citation2017; Kun et al., Citation2018; Lee et al., Citation2017). Non-starchy ingredients such as proteins, dietary fiber, polyphenols, lipids and others (Chengdeng et al., Citation2017; Renbing et al., Citation2019; N. Wang et al., Citation2022; Yu et al., Citation2018).
Increasing evidence has shown that protein can affect starch digestibility. Proteins can interact with starches, enhancing the starch ordering, and reducing starch hydrolysis (Lopez-Baron et al., Citation2017). Protein – starch interactions in particular can form a protective layer on the surface of the starch, which reduces contact between the starch and digestive enzymes and subsequently slows starch digestion (Chi et al., Citation2018). Water-soluble protein components decrease the activity of digestive enzymes, while water-insoluble proteins are very firmly connected to the superficial surfaces of the starch particles and can form a physical barrier layer around the particles, thereby working in tandem to reduce starch digestibility (Yu et al., Citation2018). Moreover, the addition of protein can also make starch structures more compact and form a continuous network structure, thus affecting starch hydrolysis (Liu et al., Citation2021). In addition, the interaction be-tween protein hydrolysate and digestive enzymes can limit the activity of the enzymes, thus leading to its effects on starch digestibility (Lin et al., Citation2022; X. Lu, Chang, et al., Citation2021; H. Xu et al., Citation2021). And modified proteins have been shown to increase the RS content of potatoes and reduce the digestibility of the potato (B. Chen et al., Citation2019). However, reports on the effects of natural, enzyme-hydrolyzed, and modified glutenin on the physical characterization and digestive properties of cassava starch (CS) are lacking.
In this study, starch isolated from cassava varieties in Hainan, China was used as research material, and mixtures were prepared by adding different proportions of natural, enzyme-hydrolyzed, and modified glutenin protein. The physical and digestive characteristics of natural starches and starch – protein mixtures were systematically studied. The overall goal of this study was to evaluate the effects of different glutenin types and contents on starch structure in order to determine the best glutenin type and proportion which can reduce cassava starch digestibility and thus improve the digestibility of SDS and RS.
2. Materials and methods
2.1. Reagents and chemicals
Cassava starch (CS) was obtained from cassava in Haikou City, Hainan Province, China. Porcine pancreatic α-amylase, trypsin, and starch glucosidase were purchased from Sigma Aldrich (Santa Clara, U.S.A). Glutenin from wheat was obtained from Shanghai Yuanye Biotechnology (Shanghai, China). All other chemicals were purchased at analytical grade quality.
2.2. Preparation of samples and mixtures
2.2.1. Isolation of starch from cassava
Cassava samples were ground and passed through a 100-mesh sieve. Next, 500 mL of 0.1 M NaOH solution was added to the prepared sample powder (100 g) and stirred at 25°C for 6 h. The mixture was then centrifuged at 4000× g for 10 min. The resulting yellow tinted layer was removed after centrifugation, and the remaining sample was washed with deionized water, and centrifuged again (4000 × g for 10 min). This step was repeated until the starch had no remaining yellow layer. The sample was then transferred into a vacuum drying oven and dried at 40°C. The obtained samples were ground and passed through a 100-mesh sieve once again, and stored in a drying dish.
2.2.2. Preparation of modified glutenin and hydrolysates
An 8% glutenin suspension was prepared with 0.1 M citric acid in a 70°C water bath for 12 h with 200 rpm agitation. The pH was then neutralized to 7.0 with 2 M NaOH solution. The suspension was placed into double distilled water for dialysis at 4°C for 48 h to remove salt ions. Trypsin was dissolved in sodium boric acid buffer (100 mL), after which 3 g Glu was added, and hydrolyzed in a 40°C water bath for 4 h at 150 rpm. The pH was then adjusted to 7.0 with 1 M HCl. The two glutenin preparations in citric acid and trypsin were then rapidly frozen in liquid nitrogen and vacuum dried, and stored in a drying dish. The modified glutenin of citric acid was called CA-Glu, and the trypsin hydrolyzed glutenin was called GPH.
2.2.3. Preparation of digestive mixtures
Different amounts of Glu, GPH, and CA-Glu (5, 10, and 15%) and cassava starch (5 g dry starch base) were transferred into a beaker with deionized water. The starch slurry was placed in a 37°C water bath for 4 h at a stirring speed of 200 rpm, then left to gelatinize at 95°C for 15 min. All samples were rapidly frozen in liquid nitrogen after gelatinization, then lyophilized and ground into powder.
2.3. The nitrogen solubility index of trichloroacetic acid
The GPH and CA-Glu (3 g) was dissolved in 15 mL of 20% trichloroacetic acid followed by incubation for 2 h at 25°C in a water bath rotating at 160 rpm. Thereafter, the suspension was centrifuged at 4800 × g for 10 min. The nitrogen content of the supernatant was determined using Kjeldahl analysis. The nitrogen solubility index of trichloroacetic acid (TCA-NSI) was calculated using the following formula:
where SN is the nitrogen content of the supernatant and TN is the total nitrogen content of the GPH.
2.4. Differential scanning calorimetry (DSC)
The thermal properties of cassava starch with or without varying levels of Glu, GPH, and CA-Glu were determined using a Q200 analyzer (TA, New Castle, DE, U.S.A). The ratio of samples to water was 1:5. The starch and starch – protein mixtures were sealed in a DSC crucible and equilibrated at room temperature for 24 h. The starch and starch – protein mixture were then heated from 30°C to 140°C at a heating rate of 2°C/min, using an empty aluminum pan as a reference control.
2.5. X-ray diffractometry (XRD)
The crystal properties of the starch and starch – protein mixtures were measured using XRD (smart lab, RIGAKU, Japan) operated at 40 kV, 40 Ma, and a Cu Kα radiation of λ = 1.5406 Å. The scanning angular range of all samples was 5° to 40° with a rate of 2°/min when scanned. The relative crystallinity of each sample was calculated using Jade 6.5 software (MDI, California, U.S.A).
2.6. Fourier-transform infrared (FT-IR) spectroscopy
The spectra of the starch and protein – starch mixtures were recorded using a FT-IR spectrometer (Tensor 27, Bruker, Germany). The scanning range was between 4000 and 400 cm−1. The samples were mixed with KBr powder (1:80, w/w), then ground and pressed into transparent discs. The total number of scans was 64 with a resolution of 4 cm−1. Second-derivative and automatic peak detection and fitting were conducted to analyze the amide I region (1600–1700 cm−1) by using PeakFit v4.12 software (Framingham, U.S.A).
2.7. Raman spectroscopy
The starch and starch – protein mixtures were analyzed using a Raman microscope system (in Via, Renishaw plc, England) with a 785-nm diode laser source. Data were collected at least five different locations to obtain stable spectra in the wavenumber range of 200 to 1200 cm−1. The full width at half maximum (FWHM) at 480 cm−1 was determined using Origin software, and the short-range ordering of the sample was represented.
2.8. Scanning electron microscopy (SEM)
Approximately 2 mm of each sample was manually cut by a scalpel blade and fixed on a sample stub, then coated with gold using a MC 1000 Ion Sputter Coater (Hitachi High-Technologies Co. Japan). The freeze-dried samples before grinding were analyzed using a Phenom Prox scanning electron microscope (Phenom-World BV, The Netherlands) at 500 × magnification.
2.9. In vitro digestibility of starches
The in vitro digestibility of each starch and protein – starch mixture was determined according to the method established by Englyst et al. (Citation1992), with minor modifications (Englyst et al., Citation1992). For this, 200 mg of the prepared samples was transferred into 15 mL of sodium acetate buffer solution (pH 5.2) and incubated in a water bath at 37°C. Next, 5 mL of enzyme solution containing porcine pancreas α-amylase and amyloglucosidase was added to the suspensions. The samples were placed in a constant temperature shaking bath at 37°C and 160 rpm. Aliquots (0.5 mL) of the hydrolysate were withdrawn at 20 and 120 min and transferred into centrifuge tubes with 4.5 mL of anhydrous ethanol to deactivate the enzyme and stop the digestion reactions. The solutions were then centrifuged at 3500 × g for 10 min, and the sugar content in the supernatant was determined using the 3,5-dinitrosalicylic acid (DNS) method. The RDS, SDS, and RS content was calculated using the following formulas:
where G0 is the free glucose content in the starch suspension before enzymolysis; G20 and G120 indicate the amounts of glucose released in 20 min and 120 min of hydrolysis, respectively; TS is total content of starch.
2.10. Statistical analysis
All studies were conducted at least in triplicate. One-way ANOVAs and Duncan’s multiple-range tests were performed using IBM SPSS Statistics software version 21.0 (IBM, Armonk, NY, U.S.A). The statistical significance level was set at P < .05.
3. Result and discussion
3.1. The TCA-NSI and secondary structures of proteins analysis
3.1.1. The TCA-NSI analysis
TCA is a protein-precipitating agent that precipitates large proteins and longer peptides and retains small peptides or free amino acids in solution. The higher the TCA-NSI values, the higher is the content of short peptides, and consequently, this index can be used to accurately reflect the enzymatic digestion of proteins (García et al., Citation2012). As shown in , the TCA-NSI value of 37.55% obtained for GPH samples is indicative of the presence of small peptides. And the TCA-NSI value for CA-Glu samples was 2.60%, which was due to the acid-catalyzed breakage of the amide bond and the conversion of the amide group into a carboxyl group to releasing ammonia. In addition, little free amino acid was produced, but not peptide bond cleavage (proteolysis) (Qiu et al., Citation2013).
Table 1. The TCA-NSI and secondary structures of different types proteins.
3.1.2. The secondary structures of proteins analysis
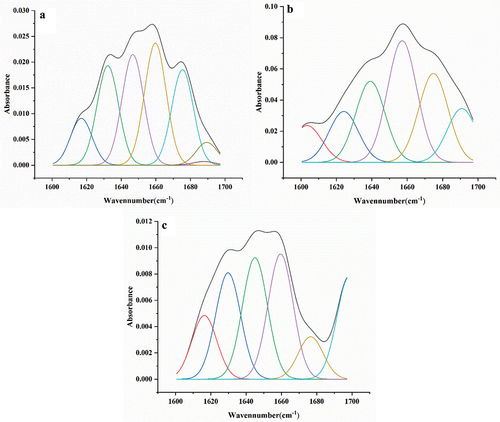
It has previously been shown that the absorption peaks of the secondary structure of the amide I band in the infrared spectrum were as follows: 1600–1640 cm−1 (β-sheet), 1641–1650 cm−1 (random coil), 1651–1660 cm−1 (α-helix), 1661–1685 cm−1 (β-turn) and 1686–1700 cm−1 (β-antiparallel) (Long et al., Citation2015). The IR spectrograms of the proteins were processed (the area of each peak in the second derivative curve) to evaluate the secondary structures of the proteins with the contents shown in and . Compared with Glu, β-sheet was decreased in the secondary structures of GPH and CA-Glu, while the α-helix and β-turn were increased, indicating that the secondary structure of glutenin was affected by enzymatic hydrolysis and citric acid modifications, thereby leading to different molecular conformations of the proteins.
Figure 1. The ATR FT-IR spectrograms and curve-fitting results of amide I band in the range of 1600–1700 cm−1 for Glu (a), GPH (b) or CA-Glu (c).
3.2. Thermal properties
The effects of different forms of glutenin on the thermal properties of cassava starch were examined using DSC. Natural, enzyme-hydrolyzed, and modified glutenin were selected for DSC examination and summarized in . The addition of 5% Glu had no remarkable effect on cassava starch gelatinization, but did increase the ΔH (enthalpy). However, hydrolyzed or modified glutenin significantly increased (P < .05) the thermal properties of starch, and the addition of GPH in the mixture also increased the ΔH, was the lowest at 10% GPH content. The reduction seen in ΔH by the CS-GPH mixture may have been caused by the reduction of amorphous regions, owing to weak interactions between CS granules and amphiphilic amino acids in GPH (X. Chen et al., Citation2015; Jia et al., Citation2020; C. A. Xu et al., Citation2020). Compared to the other two forms of glutenin, the addition of 15% CA-Glu had the greatest impact on the thermal properties of cassava starch, and significantly increased (P < .05) To, Tp, Tc and ΔH. This may be ascribed to the fact that interactions between higher contents of glutenin and starch molecules enhances the digestibility of starch, thus contributing to a higher resistance to the hydration and swelling of starch (Lopez-Baron et al., Citation2017). Therefore, different forms of protein were shown to have a significant impact on the thermal properties (P < .05) of starch, but CA-Glu had the greatest impact.
Table 2. Thermal characteristics of cassava starch with addition of different types proteins.
3.3. X-ray diffraction analysis
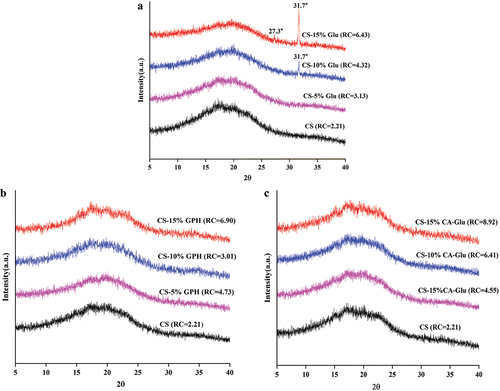
Changes in the crystal type and crystallinity of the glutenin and starch mixtures during gelatinization were studied using XRD analysis. shows that the gelatinized cassava starch and starch – protein mixtures were mostly amorphous in structure, with an obvious reflection peak near 17° which could be interpreted as a B-type crystal structure. This was primarily due to the recrystallization of amylopectin in the amorphous region (Osella et al., Citation2010). With the increasing Glu and CA-Glu content in the mixture, the relative crys-tallinity of starch gradually increased compared with CS on its own, indicating that there was an interaction between the glutenin and starch (L. Wang et al., Citation2014). When the GPH content was 5%, 10%, and 15%, the relative crystallinity of starch was 6.90%, 3.01% and 4.73%, respectively. These results showed that with the content of GPH at 10%, the relative crystallinity was the lowest. This was due to the system may be in a homogeneous state, characterized by an inhibition of the interactions between starch molecules (Lin et al., Citation2022). However, with the addition of Glu at 10%, a new diffraction peak appeared at 37.6°, indicating the existence of more ordered complex. When the content of Glu was 15%, diffraction peaks could be observed at 27.3° and 31.7°, and the diffraction peak at 31.7° was enhanced, showing that ordered complexes were proportional to protein content in this case (Niu et al., Citation2019).
Figure 2. X-ray diffractograms of cassava starch and the mixture of cassava starch and Glu (a), GPH (b) or CA-Glu (c).
3.4. FT-IR spectroscopy analysis
Based on previous studies, the “fingerprint” band of starch was noted to be at 800 to 1200 cm−1, of which 1158, 1080, 1020, 931, and 855 cm−1 were mainly due to C-OH, C-C, C-H fundamental vibration, and C-O-C ring vibrations with overlapping glycosidic bond vibrations (KačUráková et al., Citation2000; Wei et al., Citation2022). The absorbances at 1047 and 995 cm−1 were sensitive to the crystalline region of starch and the absorbance at 1022 cm−1 was sensitive to the amorphous region of starch, so the ratio of the bands at 1047/1022 and 995/1022 cm−1 indicated the change in ordered structure and the crystalline zone in the starch. FT-IR spectra is shown in .
Figure 3. FT-IR spectra of cassava starch and the mixture of cassava starch and Glu (a), GPH (b) or CA-Glu (c).
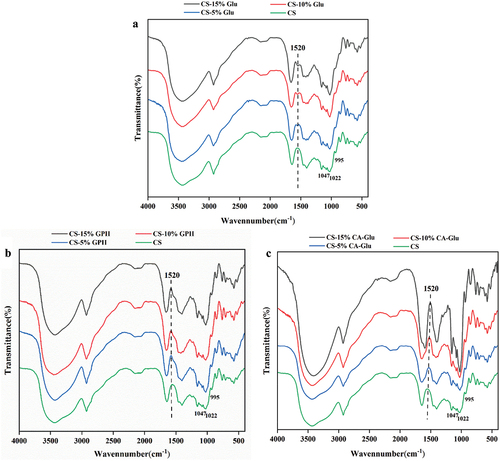
The absorption peak at 1520 cm−1 was related to the deformation of N-H (Lopez-Baron et al., Citation2018). The CS-Glu mixture had an absorption peak at 1520 cm−1 compared to CS, and the peak intensity gradually increased with increased Glu content. shows that the ratios of 1047/1022 and 995/1022 cm−1 increased with the addition of Glu, and that the sample ordering also gradually increased (Z. H. Lu et al., Citation2016), indicating that the short-range ordering of starch was affected by Glu. This may have been because glutenin can enhance starch reaggregation and limit starch gelatinization, resulting in a more stable double helix structure that enhances the starch ordering (Liu et al., Citation2021).
Table 3. The absorbance ratios of 1047/1022 cm−1, 995/1022 cm−1 and FWHM of the band at 480 cm−1 of native starch, starch and Glu, GPH or CA-Glu mixtures.
When the content of GPH was 5%, the 1047/1022 cm−1 and 995/1022 cm−1 ratios in-creased, which may have been due to the -OH of GPH acting as a crosslinker to combine starch chains (Chengdeng et al., Citation2017). Compared to 5% GPH, the ratio of 1047/1022 cm−1 and 995/1022 cm−1 decreased to a greater extent after adding 10% GPH, suggesting that the degree of starch order and the double helix properties of this mixture were also higher. At 10% GPH, both CS and GPH may have been in a stable state, because of which the interactions between starch molecules were affected to a greater extent (Lin et al., Citation2022). When adding 15% GPH, the ratio of 1047/1022 cm−1 and 995/1022 cm−1 significantly increased (P < .05), possibly because the increased content led to phase separation of the mixture and the interactions between GPH and digestive enzymes were disrupted, thereby promoting the formation of an ordered structure of CS molecular chains and inhibiting digestive enzyme activity (Xiao et al., Citation2019; H. Xu et al., Citation2021).
The ratio of 1047/1022 cm−1 and 995/1022 cm−1 for CS-CA-Glu mixtures was significantly increased (P < .05) and correlated with the amount of CA-Glu added, which may be attributable to the citric acid in enhancing the solubility of glutenin, thereby facilitating the interactions between CA-Glu and cassava starch (B. Chen et al., Citation2019). However, compared to the other two forms of glutenin, the combination of CA-Glu and starch promoted the formation of more ordered starch structures to a much greater extent.
3.5. Raman spectroscopy analysis
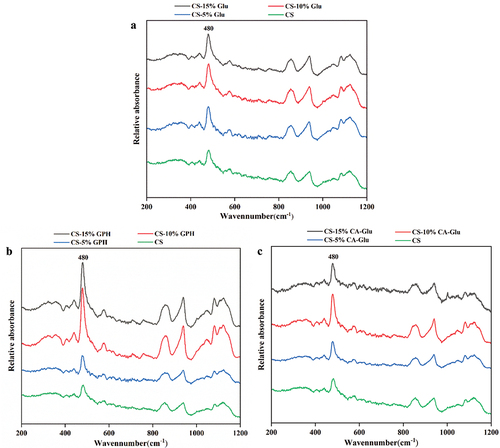
LCM-Raman spectroscopy was used to characterize the ordered structure of CS-Glu, CS-GPH and CS-CA-Glu. Previous studies have indicated that the FWHM of the band at 480 cm−1 was often used to characterize the short-range order or crystallinity of starch. In this study, the FWHM value was inversely proportional to the short-range ordering of starch (S. Wang et al., Citation2016). Raman spectra and FWHM values are shown in and , respectively. The FWHM values of CS-Glu and CS-CA-Glu mixtures decreased with increased glutenin content. However, the FWHM values were decreased significantly (P < .05) more when CA-Glu was added compared to the addition of Glu. The FWHM value of the samples prepared with GPH and CS first increased and then decreased with increased GPH content; in general, the FWHM value decreased with increasing GPH content, indicating that the addition of GPH formed less ordered short-range molecule complexes. Overall, the addition of different forms of glutenin promoted the formation of short-range ordered starch structures, but the addition of CA-Glu showed the most significant effect on the short-range molecular ordering (P < .05) of starches.
Figure 4. Raman spectra of cassava starch and the mixture of cassava starch and Glu (a), GPH (b) or CA-Glu (c).
3.6. SEM analysis
The ultrastructure of the treated starch and protein – starch mixtures were observed by SEM as shown in . The cassava starch was found to have been significantly affected (P < .05) by the addition of different amounts of Glu, GPH, and CA-Glu. After the cassava starch was sufficiently gelatinized by hydrothermal treatment, the starch particles swelled and broke, forming a three-dimensional gel network structure that led to irregular flakes following treatment. As shown in Figures B-D, the number of proteins attached to the starch surface gradually increased in association with the in-crease in Glu content (Liu et al., Citation2021). Figures E-F show that the starch structure with 15% GPH content was significantly denser (P < .05) compared to the addition of other GPH amounts. This may have been due to increased interactions between GPH and the starch, thus resulting in changes to the internal structure of the starch particles. Furthermore, small cylinders were detected on the film, which may be due to the result of the interaction between protein and starch (Liya & Xiao, Citation2017).
Figure 5. SEM images of cassava starch and the mixture of cassava starch and Glu (a), GPH (b) or CA-Glu (c).
As shown in Figures H-J, in the mixtures with different amounts of CA-Glu and CS, the lamellae were thicker and denser with the addition of CA-Glu than with CS, which may have been due to noncovalent interactions between CS and glutenin. Thus, these interactions could have hindered the expansion of starch particles and led to increased ordered structures of the starch. We further observed that the starch surface was rough, indicating that the glutenin had formed a film on the starch surface (Zheng et al., Citation2018).
3.7. In vitro digestion
The RDS, SDS, and RS contents were measured in cassava starch and the starch – protein mixtures after heat treatment in a water bath (see ). Compared to CS, the results showed that:
Table 4. Effects of Glu, GPH or CA-Glu on the RDS, SDS and RS content of cassava starch determined by an in vitro simulated digestion.
The RDS content of natural CS was 92.62%. When CS formed complexes with 5% Glu, 10% Glu and 15% Glu, the RDS contents of the CS-5% Glu、CS-10% Glu and CS-15% Glu reduced from 92.62% to 89.91%, from 92.62% to 86.98%, and from 92.62% to 82.71%, respectively. Compared added 5% Glu and 10% Glu, the addition of 15% Glu has the greatest effect on the CS digestibility. This may be because: First, the starch surface was attached to Glu and formed a physical barrier, thereby hindering contact between the digestive enzymes and starch, and second, the glutenin formed a more ordered complex with the starch, leading to the digestibility being reduced. (X. Lu, Ma, et al., Citation2021; Z. H. Lu et al., Citation2016; Tavares et al., Citation2017).
When GPH binds to CS, the digestibility of the CS-5% GPH, CS-10%, and CS-5% GPH complexes was 86.51%, 83.58% and 82.71%. When adding the same protein content, the digestibility of starch complex with GPH was significantly reduced (P < .05) than that with Glu. First, because the small molecule peptides and amino acids formed and decrease of β-sheet by glutenin underwent enzymatic hydrolysis, thus enhancing their ability to non-covalent binding with starch. Subsequently, their ability to resist starch hydration, avoid destruction at high temperatures, or migrate to the internally expanded starch particles and embed in the starch network was enhanced. This is important because these aspects usually allow them to interact with starch molecules and improve the thermostability of starch gelatinization, thereby increasing the ordered structure and crystallinity of starch (Ezeogu et al., Citation2005). In addition, GPH can bind to digestive enzymes in a noncatalytic manner to competitively inhibit their activity, thus decreasing starch hydrolysis (Chi et al., Citation2018; Z. H. Lu et al., Citation2016; Tavares et al., Citation2017; Zou et al., Citation2018).
The digestibility of the complex formed by CS with CA-Glu showed a significant change compared to that of the pure starch (p < .05). When 5% CA-Glu, 10% CA-Glu and 15% CA-Glu formed mixtures with CS, the RDS contents reduced from 91.62% to 81.75%, 77.70%, 69.89%, respectively. whereas the total SDS and RS content increased by 9.87%, 13.92%, and 21.73%, respectively. Compared to the addition of Glu and GPH, the addition of CA-Glu significantly reduced the starch digestibility. According to previous studies on thermal properties and ordering, CA-Glu can inhibit the expansion of starch particles and enhance the crystallinity and ordering of starch, thereby reducing the digestibility of starch, which may due to starch particles would break apart in an environment with high water content, resulting in amylose precipitation, and CA-Glu would then be expected to combine with amylose to form loose complexes that can reduce starch digestibility (B. Chen et al., Citation2019). In addition, citric acid modified glutenin can increase its solubility (Liao et al., Citation2010), so as increased CA-Glu solubility, the contact area with starch particles is thus increased, and a physical barrier is formed on the surface of starch, reducing the contact area between starch and digestive enzymes (Ezeogu et al., Citation2005).
In summary, the addition of Glu, GPH, or CA-Glu can decrease (p < .05) the digestibility of CS substantially and gradually decrease with the protein content increases. Among them, 15% CA-Glu showed the most pronounced effect on starch digestibility.
4. Conclusions
In this study, the effects of Glu, GPH and CA-Glu on the physicochemical and digestive properties of cassava starch were evaluated. First, with the addition of glutenin, the gelatinization characteristics of starch were affected, as shown using DSC analysis, thereby improving the thermal properties of starch. Subsequent studies found that the addition of glutenin increased the ordered structure and crystallinity of starch, which was revealed using XRD, FT-IR and Raman spectroscopy. Second, SEM results showed that the surface and internal structure of the starch was significantly affected (P < .05) by the addition of glutenin. Finally, In vitro digestion studies have shown that Glu, GPH, or CA-Glu can significantly reduce the digestibility of starch and its digestibility gradually decreases with increasing protein content. Among them, 15% CA-Glu has the greatest impact on CS. These findings provide a theoretical basis for using different types of glutenin to develop low glycemic index foods.
Acknowledgments
Part of analysis and testing work of this work was supported by the analysis and testing center of Hainan University, China.
Disclosure statement
No potential conflict of interest was reported by the author(s).
Additional information
Funding
References
- Al-Rabadi, G. J. S., Gilbert, R. G., & Gidley, M. J. (2009). Effect of particle size on kinetics of starch digestion in milled barley and sorghum grains by porcine alpha-amylase. Journal of Cereal Science, 50(2), 198–204. https://doi.org/10.1016/j.jcs.2009.05.001
- Chen, B., Wang, Y. R., Fan, J. L., Yang, Q., & Chen, H. Q. (2019). Effect of glutenin and gliadin modified by protein-glutaminase on retrogradation properties and digestibility of potato starch. Food Chemistry, 301, 125226. https://doi.org/10.1016/j.foodchem.2019.125226
- Chen, X., He, X., Fu, X., & Huang, Q. (2015). Invitro digestion and physicochemical properties of wheat starch/flour modified by heat-moisture treatment. Journal of Cereal Science, 63, 109–115. https://doi.org/10.1016/j.jcs.2015.03.003
- Chengdeng, C., Xiaoxi, L., Yiping, Z., Ling, C., & Lin, Z. (2017). Digestibility and supramolecular structural changes of maize starch by non-covalent interactions with gallic acid. Food & Function, 8(2), 720–730. https://doi.org/10.1039/c6fo01468b
- Chi, C., Li, X., Zhang, Y., Chen, L., & Li, L. (2018). Understanding the mechanism of starch digestion mitigation by rice protein and its enzymatic hydrolysates. Food Hydrocolloids, 84, 473–480. https://doi.org/10.1016/j.foodhyd.2018.06.040
- Chung, H. J., Shin, D. H., & Lim, S. T. (2008). In vitro starch digestibility and estimated glycemic index of chemically modified corn starches. Food Research International, 41(6), 579–585. https://doi.org/10.1016/j.foodres.2008.04.006
- Englyst, H. N., Kingman, S. M., & Cummings, J. H. (1992). Classification and measurement of nutritionally important starch fractions. European Journal of Clinical Nutrition, 46(Suppl 2), S33–50. PMID: 1330528
- Ezeogu, L. I., Duodu, K. G., & Taylor, J. (2005). Effects of endosperm texture and cooking conditions on the in vitro starch digestibility of sorghum and maize flours. Journal of Cereal Science, 42(1), 33–44. https://doi.org/10.1016/j.jcs.2005.02.002
- García, V., Rovira, S., Teruel, R., Boutoial, K., Rodríguez, J., Roa, I., & López, M. B. (2012). Effect of vegetable coagulant, microbial coagulant and calf rennet on physicochemical, proteolysis, sensory and texture profiles of fresh goats cheese. Dairy Science & Technology, 92(6), 691–707. https://doi.org/10.1007/s13594-012-0086-1
- Jia, M., Yu, Q., Chen, J., He, Z., Chen, Y., Xie, J., Nie, S., & Xie, M. (2020). Physical quality and in vitro starch digestibility of biscuits as affected by addition of soluble dietary fiber from defatted rice bran. Food Hydrocolloids, 99. 105349. https://doi.org/10.1016/j.foodhyd.2019.105349
- KačUráková, M., Capek, P., Sasinková, V., Wellner, N., & Ebringerová, A. (2000). FT-IR study of plant cell wall model compounds: Pectic polysaccharides and hemicelluloses. Carbohydrate Polymers, 43(2), 195–203. https://doi.org/10.1016/S0144-8617(00)00151-X
- Kun, L., Yanyan, C., Chi, L., & Chen, X. (2018). Modulation of cassava starch digestibility and multi-scale structure by controlling the growth period. International Journal of Biological Macromolecules, 120, 346–353. https://doi.org/10.1016/j.ijbiomac.2018.07.184
- Lee, S., Lee, J. H., & Chung, H. J. (2017). Impact of diverse cultivars on molecular and crystalline structures of rice starch for food processing. Carbohydrate Polymers, 169, 33–40. https://doi.org/10.1016/j.carbpol.2017.03.091
- Lehmann, U., & Robin, F. (2007). Slowly digestible starch - Its structure and health implications: A review. Trends in Food Science & Technology, 18(7), 346–355. https://doi.org/10.1016/j.tifs.2007.02.009
- Liao, L., Liu, T.-X., Zhao, M.-M., Cui, C., Yuan, B.-E., Tang, S., & Yang, F. (2010). Functional, nutritional and conformational changes from deamidation of wheat gluten with succinic acid and citric acid. Food Chemistry, 123(1), 123–130. https://doi.org/10.1016/j.foodchem.2010.04.017
- Lin, L., Yu, X., Gao, Y., Mei, L., Zhu, Z., & Du, X. (2022). Physicochemical properties and in vitro starch digestibility of wheat starch/rice protein hydrolysate complexes. Food Hydrocolloids, 125, 107348. https://doi.org/10.1016/j.foodhyd.2021.107348
- Liu, F. Y., Yang, Z., Guo, X. N., Xing, J. J., & Zhu, K. X. (2021). Influence of protein type, content and polymerization on in vitro starch digestibility of sorghum noodles. Food Research International, 142, 110199. https://doi.org/10.1016/j.foodres.2021.110199
- Liya, L., & Xiao, J. (2017). Inhibition of gelatinized rice starch retrogradation by rice bran protein hydrolysates. Carbohydrate Polymers, 175, 311–319. https://doi.org/10.1016/J.CARBPOL.2017.07.070
- Long, G., Ji, Y., Pan, H., Sun, Z., Li, Y., & Qin, G. (2015). Characterization of thermal denaturation structure and morphology of soy glycinin by FTIR and SEM. International Journal of Food Properties, 18(4), 763–774. https://doi.org/10.1080/10942912.2014.908206
- Lopez-Baron, N., Gu, Y., Vasanthan, T., & Hoover, R. (2017). Plant proteins mitigate in vitro wheat starch digestibility. Food Hydrocolloids, 69, 19–27. https://doi.org/10.1016/j.foodhyd.2017.01.015
- Lopez-Baron, N., Sagnelli, D., Blennow, A., Holse, M., Gao, J., Saaby, L., Mullertz, A., Jespersen, B., & Vasanthan, T. (2018). Hydrolysed pea proteins mitigate in vitro wheat starch digiestibility. Food Hydrocolloids, 79, 117–126. https://doi.org/10.1016/j.foodhyd.2017.12.009
- Lu, X., Chang, R., Lu, H., Ma, R., & Tian, Y. (2021). Effect of amino acids composing rice protein on rice starch digestibility. LWT-Food Science and Technology, 146, 111417. https://doi.org/10.1016/j.lwt.2021.111417
- Lu, X., Ma, R., Qiu, H., Sun, C., & Tian, Y. (2021). Mechanism of effect of endogenous/exogenous rice protein and its hydrolysates on rice starch digestibility. International Journal of Biological Macromolecules, 193, 311–318. https://doi.org/10.1016/j.ijbiomac.2021.10.140
- Lu, Z. H., Donner, E., Yada, R. Y., & Liu, Q. (2016). Physicochemical properties and in vitro starch digestibility of potato starch/protein blends. Carbohydrate Polymers, 154, 214–222. https://doi.org/10.1016/j.carbpol.2016.08.055
- Niu, F., Li, M., Fan, J., Kou, M., & Pan, W. (2019). Structural characteristics and digestibility of bovine skin protein and corn starch extruded blend complexes. Journal of Food Science and Technology -Mysore-, 57(9), 1–8. https://doi.org/10.1007/s13197-019-04137-2
- Osella, C. A., Sánchez, H., Carrara, C. R., Torre, M., & Buera, M. P. (2010). Water redistribution and structural changes of starch during storage of a gluten‐free bread. Starch - Stã¤rke, 57(5), 208–216. https://doi.org/10.1002/star.200400330
- Qiu, C., Sun, W., Cui, C., & Zhao, M. (2013). Effect of citric acid deamidation on in vitro digestibility and antioxidant properties of wheat gluten. Food Chemistry, 141(3), 2772–2778. https://doi.org/10.1016/j.foodchem.2013.05.072
- Renbing, Q., Jinglin, Y., Yufang, L., Les, C., & Shuo, W. (2019). Structural changes of starch-lipid complexes during postprocessing and their effect on in vitro enzymatic digestibility. Journal of Agricultural & Food Chemistry, 67(5), 1530–1536. https://doi.org/10.1021/acs.jafc.8b06371
- Tavares, G. M., Croguennec, T., Hamon, P., Carvalho, A. F., & Bouhallab, S. (2017). How the presence of a small molecule affects the complex coacervation between lactoferrin and β-lactoglobulin. International Journal of Biological Macromolecules, 102, 192–199. https://doi.org/10.1016/j.ijbiomac.2017.04.007
- Wang, L., Xiao, M., Dai, S., Song, J., Ni, X., Fang, Y., Corke, H., & Jiang, F. (2014). Interactions between carboxymethyl konjac glucomannan and soy protein isolate in blended films. Carbohydrate Polymers, 101, 136–145. https://doi.org/10.1016/j.carbpol.2013.09.028
- Wang, N., Wu, L., Zhang, F., Kan, J., & Zheng, J. (2022). Modifying the rheological properties, in vitro digestion, and structure of rice starch by extrusion assisted addition with bamboo shoot dietary fiber. Food Chemistry, 375, 131900. https://doi.org/10.1016/j.foodchem.2021.131900
- Wang, S., Zhang, X., Wang, S., & Copeland, L. (2016). Changes of multi-scale structure during mimicked DSC heating reveal the nature of starch gelatinization. Scientific Reports, 6(1), 28271. https://doi.org/10.1038/srep28271
- Wei, Z., Zheng, Y., Hao, J., Deng, Y., Zhang, Y., Tang, X., Liu, G., Li, P., Zhong, L., Zhao, Z., Wang, J., Liao, N., Wang, Z., & Zhang, M. (2022). Effects of soybean oil and whey protein complexation by temperature treatments on the structural, physicochemical and digestive characteristics of autoclaved rice. Food Structure, 31, 100252. https://doi.org/10.1016/j.foostr.2022.100252
- Xiao, J., Niu, L., Wu, L., Li, D., & He, H. (2019). Preparation of an in vitro low-digestible rice starch by addition of grass carp protein hydrolysates and its possible mechanisms. Starch - Stärke, 71(1–2), 1800159. https://doi.org/10.1002/star.201800159
- Xu, C. A., Jl, A., Zl, B., Jie, Z. A., Lin, L. A., & Qiang, W. C. (2020). Structural and physicochemical/digestion characteristics of potato starch-amino acid complexes prepared under hydrothermal conditions. International Journal of Biological Macromolecules, 145, 1091–1098. https://doi.org/10.1016/j.ijbiomac.2019.09.202
- Xu, H., Zhou, J., Yu, J., Wang, S., & Wang, S. (2021). Mechanisms underlying the effect of gluten and its hydrolysates on in vitro enzymatic digestibility of wheat starch. Food Hydrocolloids, 113, 106507. https://doi.org/10.1016/j.foodhyd.2020.106507
- Yu, W., Zou, W., Dhital, S., Peng, W., & Gilbert, R. G. (2018). The adsorption of α-amylase on barley proteins affects the in vitro digestion of starch in barley flour. Food Chemistry, 241, 493–501. https://doi.org/10.1016/j.foodchem.2017.09.021
- Zhang, G., & Hamaker, B. R. (2009). Slowly digestible starch: Concept, mechanism, and proposed extended glycemic index. Critical Reviews in Food Science and Nutrition, 49(10), 852–867. https://doi.org/10.1080/10408390903372466
- Zheng, M., Chen, C., Yu, J., Copeland, L., & Wang, S. (2018). Effects of chain length and degree of unsaturation of fatty acids on structure and in vitro digestibility of starch-protein-fatty acid complexes. Journal of Agricultural & Food Chemistry, 66(8), 1872–1880. https://doi.org/10.1021/acs.jafc.7b04779
- Zou, W., Schulz, B. L., Tan, X., Sissons, M., Warren, F. J., Gidley, M. J., & Gilbert, R. G. (2018). The role of thermostable proteinaceous α-amylase inhibitors in slowing starch digestion in pasta. Food Hydrocolloids, 90, 241–247. https://doi.org/10.1016/j.foodhyd.2018.12.023