
 ?Mathematical formulae have been encoded as MathML and are displayed in this HTML version using MathJax in order to improve their display. Uncheck the box to turn MathJax off. This feature requires Javascript. Click on a formula to zoom.
ABSTRACT
This research aimed to determine the minimum amounts of chicken blood plasma (X1) and sorbitol (X2) that affect the protein solubility (Y1), cohesiveness (Y2), and whiteness (Y3) of surimi. Response surface methodology (RSM) generated 13 experimental designs ranging from 0.5% to 2.5% for chicken plasma protein (CPP) and 2% to 6% for sorbitol. The results show that optimal conditions for protein solubility, cohesiveness, and a whiteness of surimi were achieved with a CPP concentration of 0.79% and a sorbitol concentration of 4.68%. This resulted in a predicted protein solubility of approximately 49.09 mg/ml, cohesiveness of 0.654 and whiteness value of 75.55. Meanwhile, the optimal experimental values for protein solubility, cohesiveness, and whiteness were found to be 46.56 mg/ml, 0.65, and 75.55, respectively. The measured values and predicted values have no statistically significant difference (p > .05), indicating the validity of the RSM model. These findings are valuable for improving surimi production.
1. Introduction
Animal blood is a by-product of slaughterhouses that can be used as a source of protein. It is the second most commonly used protein-based meat by-product in food (Mullen et al., Citation2017). Proteins like fibrinogen, albumin, and globulins are all part of the plasma, which makes up around 60% of the blood (Jin et al., Citation2021; Zou et al., Citation2019). At present and excluding soil fertiliser, animal feed, food products, and pharmaceuticals are the three primary added-value applications of blood proteins of major added value (Toldrà et al., Citation2019). Blood proteins are used not only as a protein source but also as a binding agent in meat products, a protein enhancer in pasta, a fat substitute, as well as a polyphosphate or caseinate replacement (Dick et al., Citation2019; Fernández et al., Citation2021; Hurtado et al., Citation2012; Kumar et al., Citation2021). Previous research studying the adaptability of plasma protein revealed that porcine plasma may enhance texture, inhibit lipid oxidation, and promote antibacterial growth during storage of frankfurters (Jin et al., Citation2021; Verma et al.,Citation2018, Citation2022). Chicken blood plasma has been extensively studied because of its numerous useful properties including gelling, water-holding capacity, emulsifying, fat-binding, and foaming abilities and the presence of protease inhibitors (Chen et al., Citation2015; Gao et al., Citation2020; Zou et al., Citation2019, Citation2021).
Surimi is a processed deboned fish meat product with high protein content, low fat content, and mild flavour used to formulate a variety of food products (Zhang et al., Citation2022). Myofibrillar proteins have the ability to form a gel, which is essential for the production of high-quality surimi-based products, however surimi’s gel-forming ability can be affected by storage time and temperatures (Cao et al., Citation2022). Myofibrillar proteins are degraded irreversibly by proteolytic digestion at elevated temperatures (40–70°C), which has a negative impact on the strength of surimi gels (Yingchutrakul et al., Citation2022). The preservation of surimi’s myofibrillar proteins during frozen storage is essential to produce high-quality surimi and gels with optimal physicochemical characteristics (Walayat et al., Citation2022). Serine and cysteine proteases are two protease types responsible for the gel-weakening process (Sutloet et al., Citation2018). Gel softening in modori, a type of surimi that passes through the temperature zone of 40–60°C to form a gel, has been reduced using a variety of food-grade protease inhibitors. Plasma protein (from poultry, pigs, and cows), egg white, whey, and other sources such as protein isolates and concentrates derived from plants, notably legume seeds, are used as additional protein to enhance the physicochemical properties of surimi (Bashir et al., Citation2017; Ofori & Hsieh, Citation2014).
The importance of cryoprotectant has been highlighted too. The myofibrillar proteins in surimi are likely to get denatured and aggregated if cryoprotectants are not applied before freezing (Walayat et al., Citation2022). Several different chemical substances (amino acids, sugars, sugar alcohols like sorbitol) are used as cryoprotectants. These cryoprotectants were selected for their efficiency, affordability, and minimal tendency to trigger a Maillard reaction (Jommark et al., Citation2018). The addition of cryoprotectants to surimi inhibits protein denaturation and stabilises the structural and functional characteristics of the protein by forming bonds with the protein’s functional groups. Sorbitol has been shown to enhance gel texture during superchilling storage, prevent protein and lipid oxidation, decrease protein structural changes as well as reduce protein loss of emulsifying characteristics (Liu et al., Citation2014; Sharma et al., Citation2019; Sousa et al., Citation2022; Zhou et al., Citation2019). This impact is due to the fact that they are able to raise the surface tension of water, which slows down the process of water being removed from proteins and protects the hydrogen bonds that exist between protein – protein complexes and water – protein structures (Liu et al., Citation2014; Walayat et al., Citation2022).
Response surface methodology (RSM) is a set of statistical and mathematical approaches based on the fit of a polynomial model to data that must portray the behaviour of a data set in order to make statistical predictions (Yolmeh & Jafari, Citation2017). The method is effective for optimising, designing, developing, and refining processes in which a response or responses are influenced by several variables. RSM is also used to analyse and optimise complex food operations (Gaikwad et al., Citation2021). It also interacts with variables and one or more responses. The technique is used for complicated variable processes, and its main advantage is that it requires fewer experimental runs to collect enough information to deliver a statistically acceptable solution (Shehata et al., Citation2021). RSM has been applied to optimise the number of surimi washing cycles and the starch amount added in order to get the desired moisture content and shear stress value (Fogaça et al., Citation2013). RSM was employed in the analysis of the effect of percentages of surimi, water, and fat on the physical, textural, and sensory characteristics of pork sausage (Murphy et al., Citation2004). The optimisations of Konjac glucomannan addition, heating temperature, and heating time to obtain the desired gel strength have also been reported (Liu et al., Citation2013). However, there is a lack of studies that optimise the concentration of CPP in the production of surimi. The results presented here indicate the minimum amount (percentage) of plasma protein that is suitable to be added during production of surimi. Although there has been successful production of surimi using egg white, tapioca starch, and potato starch, there are still cases of using blood plasma (chicken, bovine, or porcine plasma protein) as indicated in Vladimirovich et al. (Citation2010), Vasilevna et al. (Citation2018) and Antipova et al. (Citation1999). The use of CPP is favourable due to certain properties which possessing the proteolytic degradation, hence enhancing stronger gel-strength of surimi. The existing academic literature predominantly focuses on investigating diverse cooking techniques, with specific emphasis on factors such as the washing cycle, setting time, cooking duration, and temperature. Although individual studies have extensively explored the applications of sorbitol and chicken plasma protein as separate ingredients, their combined optimization remains relatively unexplored. The lack of information regarding the optimization of these two ingredients together can be attributed to the prevailing trend of conducting separate studies on each component. Despite this limited research, there exists significant potential for synergistically combining sorbitol and chicken plasma protein to enhance the overall quality and functional attributes of food products. Despite the numerous advantages blood plasma proteins offer in the production of surimi, consumer concerns persist. Concerns include potential allergic reactions to blood proteins and the belief that blood sourced from animals may contain harmful microorganisms, toxins, and prions, declaring surimi products unfavourable for consumption. Moreover, certain religious groups such as Muslims and Jews must abstain from consuming any materials derived from blood, while vegetarians and vegans refrain from such products for ethical reasons. Consequently, this research aims to ascertain the potential presence of plasma contaminants in surimi, shedding light on this aspect of its safety and suitability for consumption. We hypothesized that the plasma powder can be added lower than 1%, to produce good physical properties of surimi, while for sorbitol, it is hypothesized that more than 4% is needed.
2. Materials and methods
2.1. Materials
The fish paste was obtained from a local company in Selangor, Malaysia, and kept at −20°C until used. Chicken blood was collected at a local slaughterhouse (Selangor, Malaysia) and processed as in Section 2.1.1.
2.1.1. Extraction of chicken plasma protein and preparation of chicken plasma powder
Blood was collected directly from slaughtered chickens into a vacuum blood collection tube containing 3.2% sodium citrate (Vacutube) with a 9:1 ratio of blood to anticoagulant and vigorous shaking to prevent blood clotting. During collection and transport, the blood was kept at a temperature of 4°C in ice box. The blood was then centrifuged for 20 min at 2,300 g (Kubota, Japan) to remove cells and cellular debris. The blood plasma supernatant was collected in a sterile glass bottle and frozen at −35°C for 24 h. The frozen plasma is then freeze-dried until a constant weight is attained using a freeze dryer (ALPHA 11–4 LD plus, Christ, Germany) at −47°C and 0.133 bar. The powdered chicken blood plasma was kept at 4°C until further usage.
2.1.2. Surimi gel preparation
The surimi was prepared in accordance with the method by Benjakul et al. (Citation2003) and Zhu et al. (Citation2022), with a slight modification, and the fish paste was thawed for 12 h at a chilled temperature (4°C) before being ground and mixed with the CPP, sorbitol, NaCl (2%, w/w), sucrose (4%, w/w), and sodium tripolyphosphate (0.3%). Crushed ice was used to regulate the moisture level to between 80% and 85% in order to produce a uniform slurry (Fowler & Park, Citation2015). The surimi paste was put into a 2 cm × 2 cm × 2 cm ice cube mould and properly wrapped before being frozen at −18°C for at least 12 h. Prior to examination, the surimi cubes were thawed for 24 h until its core temperature reached 4°C before boiled at 90°C for 20 min and cooled to room temperature prior to the experiment (Moosavi-Nasab et al., Citation2019).
2.2. Experimental design for response surface methodology (RSM)
The percentage of CPP (X1, % w/w) and percentage of sorbitol (X2, % w/w) were investigated as parameters that influence the response in the experimental design. The experimental results of two factors, five levels, and single block and their upper and lower levels on the RSM design were applied.
Minitab Software version 19 was used to build the factorial design using central composite design (CCD). CCD designed thirteen experimental trials based on two independent variables, the percentage of CPP and the percentage of sorbitol, at five levels (-α −1, 0, 1, and +α), to determine the optimal formulation of surimi (). displays the values of the test variables that were used to generate the experimental design. Results of the dependent factors that were included in this analysis were protein solubility (Y1), cohesiveness (Y2), and whiteness (Y3).
Table 1. The coded and uncoded values used in optimisation of surimi production.
The quadratic response surface based on the central composite model was applied to determine the response variables (Y1, Y2, and Y3) of the surimi as the results of the independent variables (X1 and X2). The following is the generalized second-order polynomial model used in the analysis.
where Y expressed the predicted response variables, β0 is the constant value of response variables at the central point of the model, β1 and β2 known as the linear coefficient and β11 and β22 are the quadratic coefficient for the main factor; meanwhile, β12 is the second-order interaction coefficient (Ruiz-Hernández et al., Citation2021). The response variable was set at 0 and 1, respectively, which is low and high to observe overall desirability values.
2.3. Analysis of protein solubility
The method developed by Rawdkuen et al. (Citation2004a) was adapted to conduct the analysis of protein solubility, with a few necessary adjustments. Prior to analysis, the surimi was thawed for 24 h until its core temperature reached 4°C before being boiled at 90°C for 20 min. After draining the surimi, it was minced in a food processor for 5 min. One gram of minced surimi was dissolved in 20 mM Tris-HCl, pH 8.0, containing 1% SDS, 2% β-mercaptoethanol, and 6 M urea. The mixture was homogenised for 1 min with a homogenizer (IKA, Germany), then boiled for 2 min and stirred for 4 h at room temperature (28–30°C) with a magnetic stirrer. The mixture was centrifuged at 10,000 g for 30 min (Eppendorf AG, Germany). Two milliliters of 50% cold trichloroacetic acid (TCA) was added to 10 ml of supernatant, and the mixture was incubated at 4°C for 14 h before being centrifuged at 10,000 g for 20 min. The precipitate was dissolved in 0.5 M NaOH after being washed with 10% TCA and solubilized in 0.5 M NaOH. The concentration of the protein was determined using Biuret Method by following the Sigma manufacturer protocol and expressed as mg/ml.
2.4. Textural properties analysis (cohesiveness)
The surimi was defrosted at a chilled temperature for 12 h before being heated for 20 min at 90°C and cooled before analysis. The cohesiveness of 2 cm × 2 cm × 2 cm surimi samples was determined using a compression plate (P/75) on the TA.XT. T2i (Stable Micro System, United Kingdom) texture analyser. The speed of the probe and its return were both set to 10 mm/sec. The contact force was set at 10 g, and the compression was calibrated to 50% strain (Rawdkuen et al., Citation2007). Triplication was performed for each one.
2.5. Colour analysis (whiteness)
The colour characteristics of the cooked surimi samples were measured using a Chromameter, CR400 (Konica Minolta, Japan) in an inadequately lit area. The samples of various formulations were sealed in clear plastic and L*, a*, and b* readings were taken with a Chroma metre. Sample findings were acquired using a chromaticity diagram or colour chart to determine the sample’s brightness and hue based on L*, a*, and b* values. Triplication measurements were performed for each one. Whiteness index was computed using the following formula (Duangmal & Taluengphol, Citation2010):
2.6. Statistical analysis
Minitab Software (19th version) was used to construct the RSM with 13 combinations () as the results of CCD using multiple regression with respect to the Equation. In this research, the effect of two independent variables which are percentage of CPP (X1) and percentage of sorbitol (X2) was analysed on the response variables, protein solubility (Y1), cohesiveness (Y2), and whiteness (Y3), of the surimi.
Table 2. Factors and comparison between experiment and predicted responses.
An analysis of variance (ANOVA) was carried out to assess the lack of fit and the effect of optimization on the response variables of the surimi for the validity and fitness of the model. Besides, the determination of the regression coefficient (R2) and the probability value (p-value) as statistical indicators of the polynomial of the response variables. The quadratic regression model is displayed in 2D contour and 3D response surface plots to describe the effect of the independent variable on the response variables. The verification values of the experimental responses were compared to the predicted values as stated in . All the data were analysed using the t-test method using SPSS 26th version. A significant difference was set at the level p < .05 as the p-value was analysed statistically and computed at a 95.0% confidence level.
3. Results and discussion
3.1. Surimi production using response surface model
RSM was used to identify optimum conditions for the production of surimi with added CPP and sorbitol. Using five levels of CCD, MINITAB software version 19 was used to analyse the effects of the independent variables, X1% of CPP and X2% of sorbitol, on the protein solubility, cohesiveness, and whiteness of the surimi thus obtained.
lists the treatments for protein solubility, cohesiveness, and surimi whiteness along with the corresponding experimental variable level combinations and the results. The experimental and predicted response values for each run are displayed in . Under specific conditions of variable factors (percentage of CPP at 2.00% and percentage of sorbitol at 3.00%), the highest experimental and predicted protein solubility were 52.19 mg/ml and 49.30 mg/ml, respectively. However, the experimental protein solubility showed a slight difference from the predicted value. On the other hand, at the specified variable factor condition (percentage of CPP 2.00% and percentage of sorbitol 5.00%), the lowest experimental and predicted protein solubility of surimi likewise showed modest discrepancies, being 29.49 mg/ml and 28.34 mg/ml, respectively.
Considering various variable combinations, the experimental cohesiveness of the surimi ranged from 0.560 to 0.697. The predicted values varied from 0.563 to 0.694, but the range was broader. The variables’ greatest experimental and predicted cohesiveness was attained when the CPP percentage was 2.00% and sorbitol percentage was 3.00%. In contrast to the lowest expected cohesiveness at 2.00% CPP and 5.00% sorbitol, lowest experimental cohesiveness was obtained when the variables were set at 1.50% CPP and 4.00% sorbitol.
The highest experimental and anticipated whiteness of surimi was found when the variables were set to 1% CPP and 3% sorbitol (Run 1), yielding whiteness values of 75.640 and 75.508, respectively. In contrast, the lowest experimental (68.690) and predicted (68.686) whiteness values were recorded at the run 6 combination of 2.21% CPP and 4.00% sorbitol.
A regression analysis was conducted to fit mathematical models to experimental data in order to identify the optimal response area. The imperceptible p-value indicates that the regression is suited to the experimental value. By employing multiple regression analysis, the empirical relationship between the independent variables and the response variables can be described in terms of uncoded values by the following quadratic, second-order polynomial equations:
where Y1, protein solubility, Y2, cohesiveness, and Y3, whiteness, and X1, percentage of CPP and X2, percentage of sorbitol.
3.2. Fitting the model and analysis of experiment design
The effect of independent variables (X1 = percentage of CPP, X2 = percentage of sorbitol) has been studied by performing model CCD of RSM on the three response variables (Y1 = protein solubility; Y2 = cohesiveness; Y3 = whiteness). The significance of the coefficient was indicated by both the F and p-values. The chance that the factors have no influence or an effect that is very small or inconsequential on the response is denoted by the p-value > .05. In addition, the results of each model’s F-value and p-value exhibit the significance of the model, and it demonstrates that there is a strong agreement between the experimental values and the predicted values (Song et al., Citation2021). According to the findings, the strong significance of the regression model is shown by a high F-value in conjunction with a low p-value (Shehata et al., Citation2021; Wangtueai & Noomhorm, Citation2009). In order for the model to be considered statistically significant, the p-value should be lower than 0.05 (Patel et al., Citation2011).
According to Wangtueai and Noomhorm (Citation2009), the value of R2 suggested the variability of the model in the observed data; thus, the analysis of variance showed that the predicted second-order models were statistically suitable. In addition, Mohamad Said and Mohamed Amin (Citation2016) revealed that the efficacy of the regression model is defined by the closeness of R2 values to 1. Moreover, high R2 values (p < .05), a lack of fit that is not statistically significant (p < .05),and adjusted R2 values that are close to R2 suggest that the models can adequately explain the relationship between independent and dependent variables (Sharma & Sogi, Citation2022). shows the ANOVA for optimisation of protein solubility, cohesiveness, and whiteness of surimi.
Table 3. Analysis of variance (ANOVA) for the fitted quadratic polynomial model for the response variable.
The regression for protein solubility was determined to be significant, with a p-value of .001. The linear coefficient of X1, the percentage of CPP, was insignificant with a p-value of .812, however for X2, the percentage of sorbitol, contributed considerably to the model with a p-value of .020. In addition, the quadratic coefficient of X1, the percentage of CPP, was found to be significant with a p-value of .001, unlike X2, the percentage of sorbitol, did not contribute to the model with a p-value of 0.863. While the interaction of X1, percentage of CPP, and X2, percentage of sorbitol adds considerably to the model with a p-value of .000. The adjusted R2, 86.51, was somewhat less than R2, 92.13, yet was very close, indicating that the model’s overall predictive performance was adequate. Hence, the model is relevant.
With a p-value of .000, the model for cohesiveness was determined to be very significant. The linear coefficient of X1, the percentage of CPP, was found to be non-significant with a p-value of .282, while for X2, the percentage of sorbitol, it contributed to the model with a p-value of .020. With p-values of .000 and .002, respectively, the quadratic coefficients X1, percentage of CPP, and X2, percentage of sorbitol significantly contribute to the model. The p-value for the interaction between X1, the percentage of CPP, and X2, the percentage of sorbitol, is 0.000, indicating that this interaction is significantly produced by the model. The adjusted R2, 94.46, was a bit lower than R2, 96.77, but was relatively close, indicating that the model’s overall predictive accuracy was good.
The model of whiteness has a 0.000 p-value and was found to be very significant. The linear coefficient of X1, the percentage of CPP, was highly significant (p-value = .000); however, X2, the percentage of sorbitol, was not significant (p-value = .062). The quadratic coefficient of X1, the percentage of CPP, was determined to be highly significant with a p-value of .000, whilst X2, the percentage of sorbitol, did not contribute to the model with a p-value of .537. The model is significantly impacted by the interaction of X1, the percentage of CPP, and X2, the percentage of sorbitol, with a p-value of .000. The overall predictive performance of the model was satisfactory as revealed by the adjusted R2, 98.74, which was barely different from R2, 99.27. As a result, the overall model is very significant.
Significantly, all response variables yielded a resultant p-value of .000 for the interaction between X1 and X2, indicating a highly significant relationship with the model. This implies that the combined effect of the independent variables (CPP and sorbitol) produces improved outcomes compared to their individual contributions. This observation may be attributed to the inclusion of CPP in the surimi, which contains a protease inhibitor that effectively maintains the protein from autolysis, a process that naturally occurs in surimi and can negatively affect its texture (Benjakul & Visessanguan, Citation2000). Additionally, sorbitol plays a vital role in stabilizing the surimi structure during cold temperature storage (Arpi et al. Citation2018). Notably, the optimization of the surimi formulation exhibits remarkable improvements when these two ingredients work together synergistically. In other words, CPP works together with sorbitol, which they cannot be alone in the formulation. This finding is further corroborated by the interaction of the independent variables, which also yielded a p-value of 0.000 for each response variable.
The lack-of-fit test analyzes the variance of the data in relation to the model. Valid data should be used to ensure that the proposed model is a good fit. The lack-of-fit test will be statistically significant if the model is a poor fit for the data. Insignificant lack-of-fit is recommended, according to Sharma and Sogi (Citation2022), because significant lack-of-fit would imply that the model failed to adequately reflect data in the experimental domain at points that were excluded from the regression. The results of this investigation suggested that the model accurately predicted the protein solubility, cohesiveness, and whiteness, as evidenced by an error analysis that revealed a non-significant lack-of-fit (p > .05) with a p-value of .165, .984 and .803, respectively. Therefore, the overall model is significant.
3.3. Optimum condition of response surface analysis
In this finding, the predicted optimal conditions of surimi for the target with X1 = 0.79% and X2 = 4.68% were feasible to be carried out (). Meanwhile, the optimum conditions for the maximum and minimum goals were not feasible to be carried out. The data displayed using contour and surface response of the model allow for a better understanding of the interpretation (Noor Eliza et al., Citation2021). The substantial link between the addition of the CPP and sorbitol to the concentration of protein solubility, cohesiveness, and whiteness of the surimi under ideal conditions was revealed in .
Figure 1. Contour plot and surface plot for the effect of percentage of CPP and percentage of sorbitol on the concentration of protein solubility of surimi.
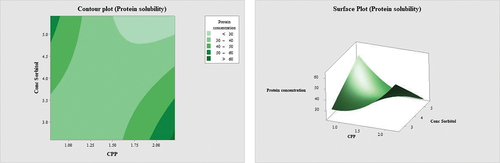
Figure 2. Contour plot and surface plot for the effect of percentage of CPP and percentage of sorbitol on the cohesiveness of surimi.
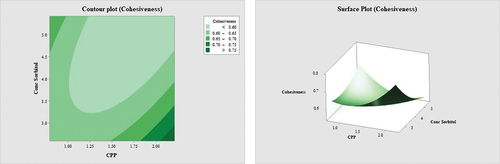
Figure 3. Contour plot and surface plot for the effect of percentage of CPP and percentage of sorbitol on the whiteness of surimi.
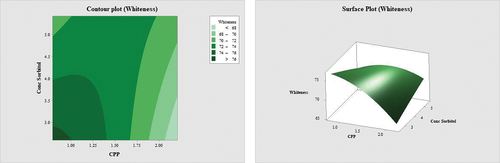
Table 4. Comparison values of target and predicted responses for different optimum conditions and experiment feasibilities.
Protein solubility is the measurement of the quantity of protein that can be dissolved in a solution under specific circumstances, which changes based on numerous criteria. The SDS, urea, and β- mercaptoethanol solution was employed to solubilize proteins by cleaving all bonds save the non-disulfide covalent bond, namely the Ɛ-(ỵ-glutamyl) lysine bond. Induced by endogenous TGase and plasma TGase, the increase in solubility implies the creation of a non-disulphide covalent link (Rawdkuen et al., Citation2004b). Generally, shows an increase in both factors will reduce the concentrations of protein solubility. According to , quadratic regression for sorbitol does not contribute much to the model; however, the interaction between CPP and sorbitol does contribute significantly to the model. Rawdkuen et al. (Citation2004b) concurred that the addition of CPP to bigeye surimi decreased the protein’s solubility, hence altering the gel’s textural qualities. According to Benjakul et al. (Citation2005), the addition of 0.5–2.5% porcine plasma protein decreased the protein solubility of the surimi, hence enhancing its breaking strength. The low solubility of protein shows that proteinase is inhibited in the surimi gels; hence, it acquires gel-enhancing abilities (Ding et al., Citation2022). The improvement of gel strength of surimi was obtained with the reduction of sulfhydryl concentration, protein solubility, and the decline of Ca2±ATPase activity affected by the addition of gill protein hydrolysate (Lin et al., Citation2019; Tian et al., Citation2022). In addition, the effect of polyol cryoprotectant is not only observed in sorbitol, but the decrease in protein solubility effect was observed in surimi added with maltodextrin (Kulkarni et al., Citation2019).
The cohesiveness was empirically assessed as the ratio of the area under the curve of the second bite to that of the first bite in texture profile analysis (TPA) (Nishinari et al., Citation2019). illustrates that the addition of modest amounts of both variables has a bigger effect on the cohesiveness of surimi; nevertheless, the combination of a higher quantity of CPP and a low amount of sorbitol offers surimi an outstanding cohesion. A similar observation was made by Fowler and Park (Citation2015), who noted that the formation of disulphide linkages in fish myosin (myosin-actomyosin) increased the gel’s strength; meanwhile, intramolecular disulphide bonds (amino acids within the protein) were converted to intermolecular bonds (protein–protein interaction) to produce stronger formation. The cohesiveness of the gels normally reduces at low quantities of bovine plasma protein, but progressively increases as the plasma concentration added (Jarmoluk & Pietrasik, Citation2003). Sorbitol can raise the surface tension of water Walayat et al. (Citation2022), subsequently delaying the removal of water from proteins and preserving the hydrogen bonds between protein – protein and water – protein. Tian et al. (Citation2022) concurred that surimi enhanced the textural and microstructural qualities of common carp by reducing protein denaturation and aggregation. In addition, the addition of an 8% combination of sucrose and sorbitol reduces oxidative alterations such as protein solubility, Ca2±ATPase, and sulfhydryl concentrations. The addition of sucrose and sorbitol increased the functional properties of carp surimi gel, such as water-holding capacity and textural profile analysis, with minimal structural modifications (secondary and tertiary) (Walayat et al., Citation2022).
Surimi’s whiteness is a key quality indicator of surimi (Petcharat et al., Citation2021; Ramadhan et al., Citation2012). The colour parameter, particularly the whiteness of surimi gel, is one of the most essential qualities when evaluating the quality of surimi. indicates that the combination of CPP and sorbitol significantly reduces the whiteness of the surimi with increments of both variables. A study conducted by Fowler and Park (Citation2015) found that the addition of salmon plasma protein significantly dulled the whiteness of the surimi. Pinkish-hued blood proteins that were degraded during processing led to a reduction in lightness (L* value). White colouring is preferred for surimi-based goods, and the inclusion of plasma protein influences the colour characteristics, especially the lightness and whiteness index of the final product (Escalante-Rodríguez et al., Citation2018; Fowler & Park, Citation2015; Rawdkuen et al., Citation2004a). Even after defibrination and diafiltration process, significant residual haemoglobin remained in the serum to be converted into nitrosyl-haemochrome (Parés et al., Citation2011; Ramadhan et al., Citation2012). Plasma, the liquid portion of blood, can be any shade from yellow to orange to pink. Hemoglobin is released from red blood cells, giving the plasma a darker hue. Osmotic shock following blood dilution with water, bacterial activity, and/or mechanical stress can all induce red blood cell membrane disruption (hemolysis), which releases haemoglobin and results in inferior quality plasma during blood collection (Lynch et al., Citation2017; Toldrà et al., Citation2019). According to Ramadhan et al. (Citation2012), the whiteness of surimi was determined to be between 63.13 and 65.96. On the other hand, the possibility of Maillard browning to occur in samples treated with cryoprotectants is due to the presence of sugar, which interacted with proteins, causing browning and a reduction in whiteness. However, Roze et al. (Citation2021) stated Maillard and caramelization reactions did not occur, resulting in a lighter colour of baked goods as sorbitol was used as a sugar substitute. Meanwhile, in the commercialization context, surimi is often preferred in a white colour because surimi paste is a secondary product after fish paste, and the whiteness is important for next step which is shaping or colouring to create aesthetic and eye-catching products. Thus, it is important to control the amount of CPP and sorbitol in formulations to achieve the desired physicochemical properties of surimi.
In this research, the surface plots demonstrated significant variations in protein solubility, cohesiveness, and whiteness of surimi as the initial levels of X1 and X2 variables were changed. The plots indicated that generally, an increase in the levels of both variables led to a decrease in protein solubility, cohesiveness, and whiteness. This observation highlights the statistical significance of the quadratic term. Moreover, the linear, quadratic, and interaction terms all exhibited significant effects on the protein solubility, cohesiveness, and whiteness of the surimi.
3.4. Optimisation of surimi production and validation of models
The validity of the response variables (Y1, Y2, and Y3) was established by employing the predicted optimal conditions (X1: 0.79% and X2: 4.68%). The experimental findings of Y1, Y2, and Y3 are presented in with the following values: 46.56, 0.651, and 75.55. Comparatively, the model predicted results were 49.09, 0.654, and 75.58, respectively. The fact that there was not a significant difference (p > .05) between the experimental and predicted values for any of the response variables is shown in , it confirms that the regression model that was created is accurate. Hence, it shows that the models were competent to predict the response variables, which validated the validity and appropriateness of the final reduced model that was fitted by RSM. Furthermore, it was discovered that the models were adequate for forecasting the response variables.
Table 5. The difference values of experimental and predicted values of response variables under the optimal conditions.
Overall, 0.79% of CPP and 4.68% of sorbitol were found to produce surimi with acceptable protein solubility, cohesiveness, and whiteness.
4. Conclusions
Optimisation of protein solubility, cohesiveness, and whiteness were obtained as surimi was incorporated with 0.79% of CPP and 4.68% of sorbitol. It was observed that the minimum amount of protein derived from chicken plasma protein and sorbitol showed a good synergy due to their good physicochemical properties. Therefore, this suggests that the model is statistically significant and can reliably predict the optimization of surimi formulation within a 95% confidence interval. On the other hand, the quality of the surimi can be improved further by purifying the plasma protein. Ultimately, this research leads to more refined and superior surimi product, catering to the discerning tastes of consumers and contributing significantly to the ever-evolving landscape of food science and technology.
Disclosure statement
No potential conflict of interest was reported by the author(s).
Additional information
Funding
References
- Antipova, L. V., Ina, N. M. I., & Astanin, N. I. (1999). Soft drink. (RU 2125390 C1). https://www.lens.org/lens/patent/141-713-590-717-557/frontpage?l=en
- Arpi, N., Rohaya, S., & Febriani, R. (2018). Surimi from freshwater fish with cryoprotectant sucrose, sorbitol, and sodium tripolyphosphate. IOP Conference Series: Earth and Environmental Science, 207(1), 012046. https://doi.org/10.1088/1755-1315/207/1/012046
- Bashir, K. M. I., Kim, J. S., An, J. H., Sohn, J. H., & Choi, J. S. (2017). Natural Food additives and preservatives for fish-paste products: A review of the past, present, and future states of research. Journal of Food Quality, 2017, 1–31. https://doi.org/10.1155/2017/9675469
- Benjakul, S., Chantarasuwan, C., & Visessanguan, W. (2003). Effect of medium temperature setting on gelling characteristics of surimi from some tropical fish. Food Chemistry, 82(4), 567–574. https://doi.org/10.1016/S0308-8146(03)00012-8
- Benjakul, S., & Visessanguan, W. (2000). Pig plasma protein: Potential use as proteinase inhibitor for surimi manufacture; inhibitory activity and the active components. Journal of the Science of Food and Agriculture, 80(9), 1351–1356. https://doi.org/10.1002/1097-0010(200007)80:9<1351:AID-JSFA647>3.0.CO;2-I
- Benjakul, S., Visessanguan, W., Thongkaew, C., & Tanaka, M. (2005). Effect of frozen storage on chemical and gel-forming properties of fish commonly used for surimi production in Thailand. Food Hydrocolloids, 19(2), 197–207. https://doi.org/10.1016/j.foodhyd.2004.05.004
- Cao, M., Zhang, X., Zhu, Y., Liu, Y., Ma, L., Chen, X., Zou, L., & Liu, W. (2022). Enhancing the physicochemical performance of myofibrillar gels using Pickering emulsion fillers: Rheology, microstructure and stability. Food Hydrocolloids, 128, 128. https://doi.org/10.1016/j.foodhyd.2022.107606
- Chen, L., Wang, P., Kang, Z. L., Li, K., Xie, C., Sun, J. X., & Xu, X. L. (2015). Effect of soybean oil emulsified and unemulsified with chicken plasma protein on the physicochemical properties of frankfurters. CyTA - Journal of Food, 13(3), 445–455. https://doi.org/10.1080/19476337.2014.998291
- Dick, A., Bhandari, B., & Prakash, S. (2019). 3D printing of meat. Meat Science, 153, 35–44. https://doi.org/10.1016/j.meatsci.2019.03.005
- Ding, J., Zhao, X., Li, X., & Huang, Q. (2022). Effects of different recovered sarcoplasmic proteins on the gel performance, water distribution and network structure of silver carp surimi. Food Hydrocolloids, 131, 131. https://doi.org/10.1016/j.foodhyd.2022.107835
- Duangmal, K., & Taluengphol, A. (2010). Effect of protein additives, sodium ascorbate, and microbial transglutaminase on the texture and colour of red tilapia surimi gel. International Journal of Food Science and Technology, 45(1), 48–55. https://doi.org/10.1111/j.1365-2621.2009.02102.x
- Escalante-Rodríguez, M. F., Murrieta-Martínez, C. L., Ocaño-Higuera, V. M., Ramírez-Wong, B., Ruiz-Cruz, S., Rodríguez-Olibarria, G., & Marquez-Rios, E. (2018). Effect of setting on the gelling properties of a protein concentrate from giant squid (Dosidicus gigas) mantle. Food Science & Technology, 38(3), 467–472. https://doi.org/10.1590/fst.01717
- Fernández, C. L., Romero, M. C., Rolhaiser, F., Fogar, R. A., & Doval, M. M. (2021). Fat substitutes based on bovine blood plasma and flaxseed oil as functional ingredients. International Journal of Gastronomy and Food Science, 25, 100365. https://doi.org/10.1016/j.ijgfs.2021.100365
- Fogaça, F. H. S., Trinca, L. A., Bombo, Á. J., & Silvia Sant’ana, L. (2013). Optimization of the surimi production from mechanically recovered fish meat (MRFM) using response surface methodology. Journal of Food Quality, 36(3), 209–216. https://doi.org/10.1111/jfq.12019
- Fowler, M. R., & Park, J. W. (2015). Effect of salmon plasma protein on Pacific whiting surimi gelation under various ohmic heating conditions. LWT - Food Science and Technology, 61(2), 309–315. https://doi.org/10.1016/j.lwt.2014.12.049
- Gaikwad, N. N., Kalal, A. Y., Suryavanshi, S. K., Patil, P. G., Sharma, D., & Sharma, J. (2021). Process optimization by response surface methodology for microencapsulation of pomegranate seed oil. Journal of Food Processing and Preservation, 45(6), 1–13. https://doi.org/10.1111/jfpp.15561
- Gao, D., Guo, P., Cao, X., Ge, L., Ma, H., Cheng, H., Ke, Y., Chen, S., Ding, G., Feng, R., Qiao, Z., Bai, J., Nordin, N. I., & Ma, Z. (2020). Improvement of chicken plasma protein hydrolysate angiotensin I-converting enzyme inhibitory activity by optimizing plastein reaction. Food Science and Nutrition, 8(6), 2798–2808. https://doi.org/10.1002/fsn3.1572
- Hurtado, S., Saguer, E., Toldrà, M., Parés, D., & Carretero, C. (2012). Porcine plasma as polyphosphate and caseinate replacer in frankfurters. Meat Science, 90(3), 624–628. https://doi.org/10.1016/j.meatsci.2011.10.004
- Jarmoluk, A., & Pietrasik, Z. (2003). Response surface methodology study on the effects of blood plasma, microbial transglutaminase and κ-carrageenan on pork batter gel properties. Journal of Food Engineering, 60(3), 327–334. https://doi.org/10.1016/S0260-8774(03)00055-4
- Jin, S. K., Choi, J. S., & Kim, G. D. (2021). Effect of porcine plasma hydrolysate on physicochemical, antioxidant, and antimicrobial properties of emulsion-type pork sausage during cold storage. Meat Science, 171, 108293. https://doi.org/10.1016/j.meatsci.2020.108293
- Jommark, N., Runglerdkriangkrai, J., Konno, K., & Ratana-Arporn, P. (2018). Effect of cryoprotectants on suppression of protein structure deterioration induced by freeze-thaw cycle in Pacific white Shrimp. Journal of Aquatic Food Product Technology, 27(1), 91–106. https://doi.org/10.1080/10498850.2017.1404532
- Kulkarni, A. K., Relekar, S. S., Joshi, S. A., Gore, S. B., & Pathan, J. G. K. (2019). Cryoprotective effect of maltodextrins on frozen storage of bleached horse mackerel (Megalapsis cordyla) minced meat. International Journal of Current Microbiology and Applied Sciences, 8(9), 1666–1677. https://doi.org/10.20546/ijcmas.2019.809.189
- Kumar, G. S., SH, A., Krishnan, R., & Mohammed, T. (2021). Pasta: Raw materials, processing and quality improvement. The Pharma Innovation, 10(5), 185–197. https://doi.org/10.22271/tpi.2021.v10.i5Sc.6205
- Lin, J., Hong, H., Zhang, L., Zhang, C., & Luo, Y. (2019). Antioxidant and cryoprotective effects of hydrolysate from gill protein of bighead carp (Hypophthalmichthys nobilis) in preventing denaturation of frozen surimi. Food Chemistry, 298, 124868. https://doi.org/10.1016/j.foodchem.2019.05.142
- Liu, Q., Chen, Q., Kong, B., Han, J., & He, X. (2014). The influence of superchilling and cryoprotectants on protein oxidation and structural changes in the myofibrillar proteins of common carp (Cyprinus carpio) surimi. LWT - Food Science and Technology, 57(2), 603–611. https://doi.org/10.1016/j.lwt.2014.02.023
- Liu, J., Wang, X., & Ding, Y. (2013). Optimization of adding konjac glucomannan to improve gel properties of low-quality surimi. Carbohydrate Polymers, 92(1), 484–489. https://doi.org/10.1016/j.carbpol.2012.08.096
- Lynch, S. A., Mullen, A. M., O’Neill, E. E., & García, C. Á. (2017). Harnessing the potential of blood proteins as functional ingredients: A review of the state of the art in blood Processing. Comprehensive Reviews in Food Science and Food Safety, 16(2), 330–344. https://doi.org/10.1111/1541-4337.12254
- Mohamad Said, K. A., & Mohamed Amin, M. A. (2016). Overview on the response surface methodology (RSM) in extraction processes. Journal of Applied Science & Process Engineering, 2(1), 8–17. https://doi.org/10.33736/jaspe.161.2015
- Moosavi-Nasab, M., Asgari, F., & Oliyaei, N. (2019). Quality evaluation of surimi and fish nuggets from Queen fish (scomberoides commersonnianus). Food Science and Nutrition, 7(10), 3206–3215. https://doi.org/10.1002/fsn3.1172
- Mullen, A. M., Álvarez, C., Zeugolis, D. I., Henchion, M., O’Neill, E., & Drummond, L. (2017). Alternative uses for co-products: Harnessing the potential of valuable compounds from meat processing chains. Meat Science, 132, 90–98. https://doi.org/10.1016/j.meatsci.2017.04.243
- Murphy, S. C., Gilroy, D., Kerry, J. F., Buckley, D. J., & Kerry, J. P. (2004). Evaluation of surimi, fat and water content in a low/no added pork sausage formulation using response surface methodology. Meat Science, 66(3), 689–701. https://doi.org/10.1016/j.meatsci.2003.07.001
- Nishinari, K., Turcanu, M., Nakauma, M., & Fang, Y. (2019). Role of fluid cohesiveness in safe swallowing. Npj Science of Food, 3(1), 5. https://doi.org/10.1038/s41538-019-0038-8
- Noor Eliza, M. R., Siti Roha, A. M., Norrizah, A. R., & Adi, M. S. (2021). Optimization of supercritical carbon dioxide extraction of fat and cholesterol from beef floss by response surface methodology. Food Research, 5(1), 232–245. https://doi.org/10.26656/fr.2017.5(1).239
- Ofori, J. A., & Hsieh, Y. H. P. (2014). Issues related to the use of blood in food and animal feed. Critical Reviews in Food Science and Nutrition, 54(5), 687–697. https://doi.org/10.1080/10408398.2011.605229
- Parés, D., Saguer, E., & Carretero, C. (2011). Blood by-products as ingredients in processed meat. Processed Meats: Improving Safety, Nutrition and Quality, 218–242. https://doi.org/10.1533/9780857092946.2.218
- Patel, S., Kothari, D., & Goyal, A. (2011). Enhancement of dextransucrase activity of pediococcus pentosaceus mutant SPAm1 by response surface methodology. Indian Journal of Biotechnology, 10(3), 346–351. https://doi.org/10.1007/s13205-011-0018-4
- Petcharat, T., Chaijan, M., & Karnjanapratum, S. (2021). Effect of furcellaran incorporation on gel properties of sardine surimi. International Journal of Food Science and Technology, 56(11), 5957–5967. https://doi.org/10.1111/ijfs.15246
- Ramadhan, K., Huda, N., & Ahmad, R. (2012). Freeze-thaw stability of duck surimi-like materials with different cryoprotectants added. Poultry Science, 91(7), 1703–1708. https://doi.org/10.3382/ps.2011-01926
- Rawdkuen, S., Benjakul, S., Visessanguan, W., & Lanier, T. C. (2004a). Chicken plasma protein affects gelation of surimi from bigeye snapper (priacanthus tayenus). Food Hydrocolloids, 18(2), 259–270. https://doi.org/10.1016/S0268-005X(03)00082-1
- Rawdkuen, S., Benjakul, S., Visessanguan, W., & Lanier, T. C. (2004b). Chicken plasma protein: Proteinase inhibitory activity and its effect on surimi gel properties. Food Research International, 37(2), 156–165. https://doi.org/10.1016/j.foodres.2003.09.014
- Rawdkuen, S., Benjakul, S., Visessanguan, W., & Lanier, T. C. (2007). Effect of chicken plasma protein and some protein additives on proteolysis and gel-forming ability of sardine (Sardinella Gibbosa) surimi. Journal of Food Processing and Preservation, 31(4), 492–516. https://doi.org/10.1111/j.1745-4549.2007.00132.x
- Roze, M., Crucean, D., Diler, G., Rannou, C., Catanéo, C., Jonchère, C., Le-Bail, A., & Le-Bail, P. (2021). Impact of maltitol and sorbitol on technological and sensory attributes of biscuits. Foods, 10(11), 1–15. https://doi.org/10.3390/foods10112545
- Ruiz-Hernández, A. A., Cárdenas-López, J. L., Cortez-Rocha, M. O., González-Aguilar, G. A., & Robles-Sánchez, R. M. (2021). Optimization of germination of white sorghum by response surface methodology for preparing porridges with biological potential. CyTA - Journal of Food, 19(1), 49–55. https://doi.org/10.1080/19476337.2020.1853814
- Sharma, S., Majumdar, R. K., Siddhnath, K., Mehta, N. K., Saha, A., & Gupta, S. (2019). Effects of partial and complete replacement of synthetic cryoprotectant with carrot (Daucus carota) concentrated protein on stability of frozen surimi. Journal of Aquatic Food Product Technology, 28(8), 808–820. https://doi.org/10.1080/10498850.2019.1651807
- Sharma, A., & Sogi, D. S. (2022). Optimization of enzyme aided pigment extraction from pumpkin (Cucurbita maxima Duch) using response surface methodology. Journal of Food Measurement and Characterization, 16(2), 1184–1194. https://doi.org/10.1007/s11694-021-01246-5
- Shehata, M. G., Abd El Aziz, N. M., Youssef, M. M., & El-Sohaimy, S. A. (2021). Optimization conditions of ultrasound-assisted extraction of phenolic compounds from orange peels using response surface methodology. Journal of Food Processing and Preservation, 45(10), 1–10. https://doi.org/10.1111/jfpp.15870
- Song, Y., Fu, Y., Huang, S., Liao, L., Wu, Q., Wang, Y., Ge, F., & Fang, B. (2021). Identification and antioxidant activity of bovine bone collagen-derived novel peptides prepared by recombinant collagenase from Bacillus cereus. Food Chemistry, 349, 129143. https://doi.org/10.1016/j.foodchem.2021.129143
- Sousa, T. C. D. A., Silva, E. L. L., Ferreira, V. C. D. S., Madruga, M. S., & da Silva, F. A. P. (2022). Oxidative stability of green weakfish (Cynoscion virescens) by-product surimi and surimi gel enhanced with a spondias mombin L. waste phenolic-rich extract during cold storage. Food Bioscience, 50, 102021. https://doi.org/10.1016/j.fbio.2022.102021
- Sutloet, P., Sompongse, W., & Morioka, K. (2018). Effect of protease inhibitors on proteolytic degradation of rohu (labeo rohita) gel. International Journal of Food Science and Technology, 53(11), 2509–2514. https://doi.org/10.1111/ijfs.13844
- Tian, J., Walayat, N., Ding, Y., & Liu, J. (2022). The role of trifunctional cryoprotectants in the frozen storage of aquatic foods: Recent developments and future recommendations. Comprehensive Reviews in Food Science and Food Safety, 21(1), 321–339. https://doi.org/10.1111/1541-4337.12865
- Toldrà, M., Lynch, S. A., Couture, R., & Álvarez, C. (2019). Blood proteins as functional ingredients. Sustainable Meat Production and Processing, 85–101. https://doi.org/10.1016/B978-0-12-814874-7.00005-5
- Vasilevna, A. L., Evgenevna, U. M., & Aleksandrovna, M. I. (2018). Dry combined base for functional drinks. (Patent No. RU 2641710 C1). https://org/121-885-534-275-315
- Verma, A. K., Chatli, M. K., Kumar, P., & Mehta, N. (2022). Assessment of quality attributes of porcine blood and liver hydrolysates incorporated pork loaves stored under aerobic and modified atmospheric packaging. Journal of Food Science and Technology, 59(3), 1114–1130. https://doi.org/10.1007/s13197-021-05115-3
- Verma, A. K., Chatli, M. K., Mehta, N., & Kumar, P. (2018). Assessment of physico-chemical, antioxidant and antimicrobial activity of porcine blood protein hydrolysate in pork emulsion stored under aerobic packaging condition at 4 ± 1 °C. LWT, 88, 71–79. https://doi.org/10.1016/j.lwt.2017.10.002
- Vladimirovich, B. V., Evich, V. V. G., Juldashevna, I. D., Ljudvigovich, L. S., Nikolaevna, L. I., & Alekseevich, P. V. (2010). Protein-peptide module for production of functional and specialised food products for persons experiencing intensive physical strain. https://lens.org/107-939-061-764-058
- Walayat, N., Liu, J., Nawaz, A., Aadil, R. M., López-Pedrouso, M., Lorenzo, J. M., Xiong, H., Xiong, Z., Moreno, H. M., Nawaz, A., Niaz, N., & Randhawa, M. A. (2022). Role of cryoprotectants in surimi and factors affecting surimi gel properties: A review. Food Reviews International, 38(6), 1103–1122. https://doi.org/10.1080/87559129.2020.1768403
- Wangtueai, S., & Noomhorm, A. (2009). Processing optimization and characterization of gelatin from lizardfish (Saurida spp.) scales. LWT - Food Science and Technology, 42(4), 825–834. https://doi.org/10.1016/j.lwt.2008.11.014
- Yingchutrakul, M., Wasinnitiwong, N., Benjakul, S., Singh, A., Zheng, Y., Mubango, E., Luo, Y., Tan, Y., & Hong, H. (2022). Asian carp, an alternative material for surimi production: Progress and future. Foods, 11(9), 1–26. https://doi.org/10.3390/foods11091318
- Yolmeh, M., & Jafari, S. M. (2017). Applications of response surface methodology in the food industry processes. Food and Bioprocess Technology, 10(3), 413–433. https://doi.org/10.1007/s11947-016-1855-2
- Zhang, X., Zhang, Y., Ding, H., Zhang, W., & Dai, Z. (2022). Effect of washing times on the quality characteristics and protein oxidation of silver carp surimi. Foods, 11(16), 1–14. https://doi.org/10.3390/foods11162397
- Zhou, W. J., Wang, F. X., Yu, J., Li, X. H., & Liu, Y. L. (2019). Cryoprotective effects of protein hydrolysates prepared from by-products of silver carp (Hypophthalmichthys Molitrix) on freeze-thawed surimi. Applied Sciences, 9(3), 563. https://doi.org/10.3390/app9030563
- Zhu, Y., Lu, Y., Ye, T., Jiang, S., Lin, L., & Lu, J. (2022). The effect of salt on the gelling properties and protein phosphorylation of surimi-crabmeat mixed gels. Gels, 8(1), 10. https://doi.org/10.3390/gels8010010
- Zou, Y., Lu, F., Yang, B., Ma, J., Yang, J., Li, C., Wang, X., Wang, D., & Xu, W. (2021). Effect of ultrasound assisted konjac glucomannan treatment on properties of chicken plasma protein gelation. Ultrasonics Sonochemistry, 80, 105821. https://doi.org/10.1016/j.ultsonch.2021.105821
- Zou, Y., Yang, H., Li, P. P., Zhang, M. H., Zhang, X. X., Xu, W. M., & Wang, D. Y. (2019). Effect of different time of ultrasound treatment on physicochemical, thermal, and antioxidant properties of chicken plasma protein. Poultry Science, 98(4), 1925–1933. https://doi.org/10.3382/ps/pey502