
ABSTRACT
Zhejiang, China, has a tradition of wine-fermented foods, including Jinhua Dajiao steamed bread (JDSB). The traditional leavening agent, jiaotou, confers its properties and taste to JDSB. We examined microorganisms in jiaotou, their effects on processing, and the metabolome using metagenomic and metabolomic analyses. Metagenomics of microorganisms in jiaotou revealed a high average diversity, with Rhizopus sp. being the dominant bacteria. The enriched genes were most abundant in genes related to carbohydrate and amino acid metabolism, with a greater number of non-redundant genes for glycoside hydrolases and glycosyl transferases. The enriched genes may have a direct impact on the organoleptic quality of JDSB. Functional enrichment analysis of different metabolites revealed that pathways associated with linoleic acid, ABC transporter, alanine, aspartate, glutamate, and galactose metabolism were enriched during JDSB processing. We identified a strong correlation between metagenomic functional level and metabolomics pathway enrichment analyses.The results contribute to the improvement of JDSB processing.
Introduction
Traditional steamed bread is a staple in Chinese households. For thousands of years, prior to the development of commercial yeasts, traditional leavening agents have been used for the production of this bread (Suo et al., Citation2020). Jinhua Dajiao steamed bread (JDSB) is a traditional food from Zhejiang Province and its traditional leavening agent is known as jiaotou. The fermentation process of jiaotou is unique and the process has continued for over 1300 years, with JDBS included in ritual offerings, celebrations, festivals, and gifts mentioned in Jin’s historical books. The plump shape, delicate holes, and white color of JDSB are attributed to the full fermentation of the dough, and JDSB is renowned as the “Pearl of Jinhua”.
Traditional JDSB processing techniques are an intangible cultural heritage in Zhejiang Province, China, mainly passed down orally, and JDSB fermentation is typically conducted at home or in small workshops. This can result in unstable fermentation conditions, such as temperature, humidity, and ventilation, which may cause changes in microbial growth and metabolism during fermentation. These changes can affect the consistency and quality of the final product. The development of modern industrialized production may have an impact on the traditional production of handmade ferments, leading to difficulties in protecting and inheriting traditional techniques, and putting traditional production techniques at risk of being lost. Therefore, studying the microbial composition and function of traditional JDSB leavening agents, together with the relationship between metabolic changes and microorganisms during the processing of steamed bread, is of great scientific significance and research importance.
Understanding the diversity of microorganisms in fermentation can aid in clarifying the process of flavor creation (Guan et al., Citation2023; Suo et al., Citation2020). The leavening agents of traditional Chinese steamed breads contribute to the extended shelf life, improved texture and flavor, and nutritional benefits of the bread, and profoundly impact its overall quality. This is owing to the diverse microbial populations and their metabolic interactions within leavening agents. Therefore, researchers have investigated the microorganisms present in such leavening agents to identify functional microorganisms that can improve the quality of steamed bread (Suo et al., Citation2020). Recently, a growing number of fermented foods, including baijiu (Xue et al., Citation2023), sausages (P. Yang et al., Citation2022), bamboo shoots (Guan et al., Citation2023), and kombucha (L. Yao et al., Citation2023), have been studied using metagenomics because microorganisms produce volatile aroma compounds largely on their own (Ripari et al., Citation2016). Utilizing high-throughput sequencing technology allows for the examination of microbial diversity, population structures, evolutionary connections, functional capacities, cooperative behaviors, and environmental interactions within microbial communities (He et al., Citation2023). We investigated the microbial composition and function of jiaotou metagenome to ascertain the impact of microbial metabolism on JDSB quality.
Metabolomics is used to establish the relationship between metabolites and fermentation processes in food science. Therefore, metabolomics was employed to confirm the expression of microbiologically significant functional genes in jiaotou and the generation of relevant metabolites when the strain entered JDSB. Furthermore, a combination of gas chromatography – mass spectrometry (GC – MS) and liquid chromatography – mass spectrometry (LC – MS) was employed to develop a deeper understanding of the regulatory mechanisms of food quality owing to the limitations of a single detection technique in capturing all metabolite information (Graham et al., Citation2012; Jacyna et al., Citation2019). Integrated metagenomic and metabolomic analyses offer new insights into JDSB processing.
Materials and methods
Reagents and materials
The ingredients to produce the leavening agent (jiaotou) were purchased in January 2023 from a local long-established steamed bread shop in Pan’an District, Jinhua City, Zhejiang Province, China. JDSB was prepared using the traditional Chinese steamed bread processing method in Jinhua City, Zhejiang Province, China. The finished products were stored at 4°C until use. All solvents used were of analytical grade and obtained from Sigma – Aldrich (Shanghai, China).
Production of jiaotou and Jinhua Dajiao steamed bread
The following ingredients were combined to prepare jiaotou: cinnamon leaves (200 g), orange leaves (200 g), lentil leaves (200 g), bamboo leaves (200 g), tianbiancao (Alternanthera sessilis (L.) R.Br.ex & Schult) (200 g), chopped and dried water pepper (Polygonum hydropiper) (4 kg), and rice (50 kg). All ingredients were crushed, mixed, and kneaded into balls at 37°C. The balls were then placed in a basket, spun, and sprinkled with distiller’s yeast powder. The balls coated with distiller’s yeast powder were placed in a basket, and each layer was separated by straw, wrapped in film, and fermented for 24–36 h. Water droplets on the film were removed by ventilating the samples (by lifting the lid). Upon spontaneous cooling, the finished jiaotou was removed and spread in the sun to dry. The production steps are shown in .
Figure 1. Production of (a) jiaotou and (b) JDSB.
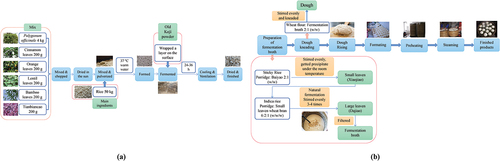
To prepare JDSB, glutinous rice porridge and jiaotou should be evenly mixed at a ratio of 2:1 (w/w) and kept indoors for 4–5 days in the winter and 2–3 days in the summer. The small leaven (xiao jiao) was formed when the solid precipitated and the liquid began to clear. Subsequently, indica rice porridge, xiao jiao, and wheat bran were mixed, stirred, and allowed to ferment naturally. To obtain a fermentation broth, the mixture was stirred again, and the process was repeated 3–4 times until bubbles were observed. Wheat flour (500 g) and the fermentation liquid (250 g) were mixed, kneaded well, and left to ferment. To prepare for secondary fermentation, the fermented dough was divided into small balls (approximately 75 g each) and placed in a preheated steamer basket. Upon fermentation, the JDSB was steamed for 15 min ().
Examination of the physical and chemical properties of jiaotou
Ten grams of jiaotou was weighed and added to 90 mL of distilled water. The samples were stirred for 30–60 min using a magnetic stirrer (HJ-2A, Changzhou Guohua Electrical Appliances Co., Ltd., Changzhou, China) and mixed thoroughly to obtain a suspension. A pH meter (FiveEasy Plus, Mettler Toledo, U.S.A.) was used to measure the pH of the suspensions. Measurements were performed in triplicate for each sample.
Metagenomic sequencing
Genomic DNA was extracted from 5 g of the samples (Group A: JDSB, Group C: jiaotou, measurements were performed in triplicate per sample) using the MagPure Soil DNA KF Kit (Magen Biotech, Guangzhou, China). The DNA was collected by centrifugation (Centrifuge 5418 R, Eppendorf, Hamburg, Germany) at 9642 × g to obtain the supernatant. The DNA was fragmented using Covaris S220 (Gene, Hong Kong, China) and purified with AMPure XP Beads (A63881, Beckman Coulter, Inc., California, U.S.A.). The ends were repaired and the library size was selected. Subsequently, the 3′ ends were adenylated, and adapters were ligated. The DNA fragment was enriched. The extracted genomic DNA was sent to OE Biotech Co., Ltd. (Shanghai, China) for Illumina MiSeq high-throughput sequencing and bioinformatic analyses.
The data was formatted in FASTQ. A Trimmomatic (v0.36) excision algorithm was used to excision joints (Bolger et al., Citation2014). Low-quality bases were removed by filtering to remove N-bases (fuzzy bases). The sequences were spliced into the macrogenome using MEGAHIT (v1.1.2) (D. Li et al., Citation2015). The scaffold was broken into new contigs (ScafContig) at the internal gap and only contigs ≥ 200 or 500 bp were retained. Open reading frame prediction was performed on the spliced scaffolds using prodigal (v2.6.3) (Hyatt et al., Citation2010) and the resulting sequences was translated into amino acids. CDHIT (v4.5.7) (W. Li et al., Citation2001) was used to construct non-redundant gene sets for all predicted genes. After obtaining representative sequences of the gene set, we aligned the clean reads from each sample with a non-redundant gene set (at 95% identity) prior to counting genes using bowtie2 (v2.2.9). Subsequently, the identity of the non-redundant gene set determined the gene abundance in the respective samples.
The amino acid sequences of the representative sequences of the gene set were annotated using DIAMOND (v0.9.7) (Buchfink et al., Citation2015) software with the NonRedundant Protein Sequence Database (NR database), Kyoto Encyclopedia of Genes and Genomes database (KEGG), Carbohydrate-Active enZYmes Database (CAZymes), SWISSPROT, Gene Ontology (GO) and the expected value of the BLAST comparison parameter was set to 1e−5. Based on the gene abundance, the species abundance was calculated using the NR library’s taxonomic database. Species annotations were obtained from the corresponding taxonomic information database of the NR library. Species abundances were determined based on gene abundances. The gene set was compared with the Annotation information for carbohydrate-active enzymes is obtained using the CAZy database correspondence tool hmmscan (v3.1).
Gas chromatography – mass spectrometry analysis
The samples (60 mg) (Group A: JDSB, Group C: jiaotou, measurement of six parallel samples) were weighed and transferred to a centrifuge tube with a capacity of 1.5 mL. Following this, methanol – water (600 µL; v/v = 1:1, with l-2-chlorophenylalanine, 4 μg mL-1) was introduced into the tube. Subsequently, the samples underwent grinding at 60 Hz for 2 min and ultrasonic extraction in an ice-water bath for 30 min. Then, 50 µL of N,O-bis(trimethylsilyl)trifluoroacetamide (BSTFA) derivatization reagent (B0830–25 mL, TCI, China) and 20 µL of n-hexane were added. Additionally, 10 internal standards (HPLC, 99.0%, NU-chek, U.S.A.) were included at a volume of 10 µL, and the reaction proceeded at 70°C for 60 min. Finally, after a 30 min storage at −20°C, the samples underwent GC-MS metabolomic analysis using an Agilent 8890–5977B instrument (Agilent Technologies, Santa Clara, CA, U.S.A.). The analysis utilized a DB-5 MS capillary column (30 m × 0.25 mm × 0.25 μm, Agilent J&W Scientific, Folsom, CA, U.S.A.) with helium as the carrier gas (purity not less than 99.999%) at a flow rate of 1.0 mL min−1. The injection port temperature was maintained at 260°C, with a sample volume of 1 µL and a solvent delay of 4.8 min (G. Li et al., Citation2019). Temperature programming involved initially setting the column temperature box to 60°C and maintaining it for 0.5 min. The temperature was then raised to 125°C at 8°C min−1, followed by increments to 210°C at the same rate, and finally to 270°C at 15°C min−1 and 305°C at 20°C min−1, holding for 5 min (M. Yang et al., Citation2023). The ion source temperature was set at 230°C, quadrupole temperature at 150°C, electron energy at 70 eV, and mass scanning range at m/z = 50–500.
Through quality control measures on internal standards and quality controls (QCs), we analyzed and evaluated the pre-treatment, sample loading, and stability of the mass spectrometry system. 3,4-Dichlorophenylalanine and 11 fatty acid methyl esters were added as internal standards and the samples were characterized by ion fragmentation of the internal standards and their retention times. Internal standards with RSD > 0.1 were removed from all samples and those with RSD < .1 were retained for subsequent segmental normalization for data pre-processing. Repeatability was assessed using QC injections at regular intervals (every three samples) during the analytical process. Total ion chromatogram (TIC) plot overlay, principal component analysis (PCA), mass spectrometry system stability was assessed by box plots and hierarchical clustering of QCs. Substance characterization was performed using the NIST database.
Liquid chromatography with tandem mass spectrometry analysis
The sample extraction method mirrored that of GC – MS, albeit without the drying and derivatization steps. Following centrifugation at low temperature for 10 minutes (13,000 rpm, 4 °C), 150 µL of the supernatant was drawn with a syringe and passed through a 0.22-µm organic phase pinhole filter. Samples underwent analysis via a liquid mass spectrometry system (ACQUITY UPLC I-Class plus, Waters Corporation, Milford, U.S.A.) coupled with an ultra-high-performance liquid chromatography tandem system featuring a QE Plus high-resolution mass spectrometer (Thermo Fisher Scientific, U.S.A.). The chromatographic column utilized was an Acquity UPLC HSS T3 (100 mm × 2.1 mm, 1.8 μm, Waters, U.S.A.), maintained at a temperature of 45°C. Mobile phases consisted of water (containing 0.1% formic acid) for phase A and acetonitrile for phase B, with a flow rate of 0.35 mL min-1 and an injection volume of 5 µL (Yu et al., Citation2022). The linear gradient progressed as follows: 0 min, 95% A; 2 min, 95% A; 4 min, 70% A; 8 min, 50% A; 10 min, 20% A; 14 min, 0% A; 15 min, 0% A; 15.1 min, 95% A; 16 min, 95% A (Q. Wang et al., Citation2023). The ion source was electrospray ionization (ESI), and mass signals were acquired in both positive and negative ion scanning modes (X. Yang et al., Citation2021).
Quality control was used to analyze and evaluate the pre-treatment, sample loading, and stability of the mass spectrometry system. Ion peaks with RSD > 0.3 in the QC group were deleted. Principal component analysis (PCA), metabolite intensity box plots, and QCs were clustered hierarchically to assess mass spectrometry stability. Data from LC – MS experiments were processed with Progenesis QI V2.3 (Nonlinear, Dynamics, Newcastle, UK). The key parameters were 5 ppm precursor tolerance, 10 ppm product tolerance, and 5% production limit. Compounds were qualitatively analyzed on the basis of accurate mass to charge ratios (m/z), secondary fragmentation, and isotopic distributions using the Human Metabolome Database, Lipidmaps, Metlin, EMDB, and self-built databases.
Metabolomic statistical analyses
The raw GC – MS data matrix was cleansed to remove internal standard peaks and known false positive peaks as well as ion peaks with 50% or more missing values. The remaining missing values were replaced by half of the minimum value. In each sample, the signal intensity of all peaks was segmented and normalized to the internal standard with RSD (ALL) < 0.1 after screening. After data normalization, redundancy and peak merging were performed and the compounds were scored according to the compound characterization results, the compounds obtained from the characterization were screened, and compounds with a score of under 70 (out of a possible 100) were considered to have inaccurate qualitative results and were deleted, with the data matrices obtained for analysis.
For the data extracted to LC – MS, ion peaks with > 50% of all missing values (0 values) within the group were deleted and the 0 values were replaced by half the minimum value, and the compounds were scored according to their characterization results, with a screening criterion of 36 points out of a possible 60, with scores below 36 considered inaccurate for the characterization results and deleted. Finally, the positive and negative ion data were merged to create a data matrix table for further analysis.
To assess sample distribution and stability, we imported the data matrix into R (version 4.4.2) for principal component analysis (PCA) (F. Wang et al., Citation2019).To thoroughly analyze distribution and evaluate the stability of the analysis process, we utilized orthogonal partial least squares discriminant analysis (OPLS-DA) and partial least squares discriminant analysis (PLS-DA) to detect differing metabolites among groups. In order to avoid overfitting, we performed seven-fold cross-validation and 200 response permutation tests to verify the quality of the model. Variable projected importance (VIP) values from the OPLS-DA model were analyzed to determine the relative impact of each variable on group distinction. Additionally, we assessed metabolite differences between groups using a two-tailed Student’s t-test.
Metagenome-metabolome combination analysis
The thresholds for statistically significant differences were VIP > 1.0 and p < .05 for the different metabolites as well as metagenomic data with p < .05. Correlations between groups of differing features were calculated using a Spearman correlation algorithm. The mixOmics (6.24.0) tool was employed to integrate the expression matrix of each omic feature, and the results of feature screening and correlation analysis were plotted.
Results
Microbial community
Jiaotou had a pH of 5.25 (±0.12) and moisture content of 9.40% (±0.27%) because of the use of an acidic leavening agent. Three JDSB samples and three jiaotou samples yielded effective data volumes ranging from 23.68 to 24.19 G, with contig N50 statistics varying from 787 to 7638 bp. After removing redundancy, there were 206,381 open reading frames in the gene catalog.The annotation rates for non-redundant genes were 81.56%, 35.26%, and 1.55% based on the NR, KEGG, and CAZy databases, respectively.
To calculate species abundance, genes associated with each species were used (K. Wang et al., Citation2022). The abundance histogram of the top 15 species is shown in and comprises Rhizopus arrhizus, Lactobacillus phage ATCCB, Rhizopus microsporus, Rhizopus delemar, Pediococcus acidilactici, Saccharomyces cerevisiae, Proteus mirabilis, Staphylococcus gallinarum, Hopescreekvirus LfeInf, Levilactobacillus brevis, Limosilactobacillus fermentum, Aspergillus niger, Rhizopus azygosporus, Lactiplantibacillus plantarum, and Pichia kudriavzevii. There was little difference between the groups. The predominant flora in JDSB were Lactobacillus phage ATCCB (34%), Proteus mirabilis (9%), and Hopescreekvirus LfeInf (8%). The predominant flora in jiaotou were Rhizopus arrhizus (41%), R. microsporus (10%), and R. delemar (10%). Subsequently, we identified the top 30 species in each sample and their corresponding abundance information using a table of relative species abundances. A heat map was created by clustering the species at the sample level for clarity and species identification (Rui & Qiu, Citation2022) (). Subsequently, the Wilcoxon rank-sum test was applied to the species abundance data of the JDSB and jiaotou groups. A p-value <.05 was considered to be significantly different. The species with the most notable differences were identified based on this p-value, and a boxplot was constructed using the top 10 abundant species (). displays the alpha diversity of the community, with species diversity measured using chao1 and ACE.
Figure 2. Microbial community (Group A:JDSB, Group C: jiaotou). (a) Histogram of top 15 and (b) top 30 most abundant species. (c) Boxplot of the abundance of the top 10 divergent species.
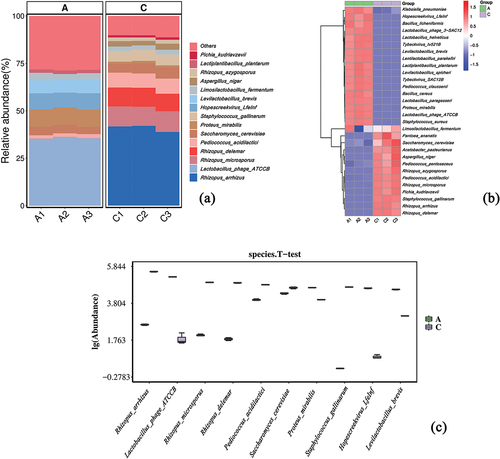
Table 1. Alpha diversity of microorganisms in JDSB and jiaotou (Group A:JDSB, Group C: jiaotou).
Functional annotation
The majority of genes within the six KEGG categories were primarily enriched in metabolism, particularly those associated with carbohydrate and amino acid metabolism (). Genes linked to transport and catabolism exhibited the highest enrichment within the cellular processes category, while those involved in signal transduction were most enriched in the environmental information processing category. Within the genetic information processing category, genes related to translation, folding, sorting, and degradation showed significant enrichment. Additionally, genes categorized under bacterial diseases predominated within the human diseases category. Of the organismal systems, genes related to the endocrine system showed the greatest enrichment.
Figure 3. Functional annotation (Group A: JDSB, Group C: jiaotou). (a) Kyoto Encyclopedia of Genes and Genomes analysis. (b) Boxplot of the abundance of the top 10 differences in KEGG functions. (c) CAZy analysis. (d) Boxplot of the abundance of the top 10 differences in CAZy functions. (e) Gene Ontology. (f) Circos relationship between species and functions. Here, the first circle displays the percentage of species and functions and the second circle is the main block marked with different colors and labels. The block is surrounded by a scale that represents the absolute abundance of information of species and functions. The third circle corresponds to the sub-block (the second circle) and illustrates the abundance of each species in each function, as well as the abundance information of each species contained in each function. The fourth circle matches the sub-block in the third circle and displays the information of species and functions by connecting lines.
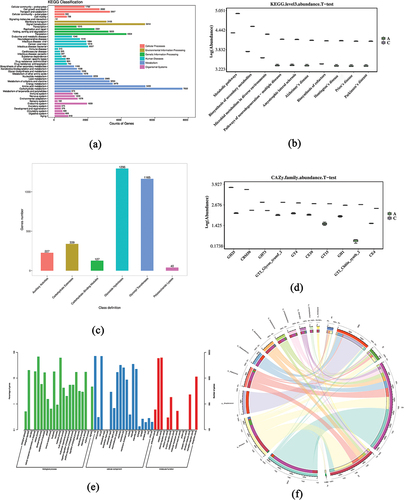
CAZy analysis revealed that most of these enriched genes were related to carbohydrates at the class level; there were more non-redundant genes for glycoside hydrolases (GHs) and glycosyl transferases (GTs) and less for polysaccharide lyases (PLs) (). Wilcoxon rank-sum tests were conducted on the KEGG and CAZy functional abundance data for the JDSB and jiaotou groups to identify the functions with the most significant differences based on p-value (p < .05). Boxplots were constructed for the top 10 abundances ().
Gene Ontology functional annotation involves three ontologies: cellular components, molecular functions, and biological processes. In terms of cellular components 20,967 genes related to the cytoplasm were enriched (GO:0005737), and 18,513 genes related to ATP binding were enriched in terms of molecular functions (GO:0005524) (). DNA-templated genes were enriched in biological processes (GO:0006351). The relationships were revealed by annotating the Circos relationship between species and functions identified by the metagenome using the “circlize” package in R (). These connections highlight the relative abundance of species within each sample and proportional distribution of functional attributes across the samples.
Quality control of metabolomic
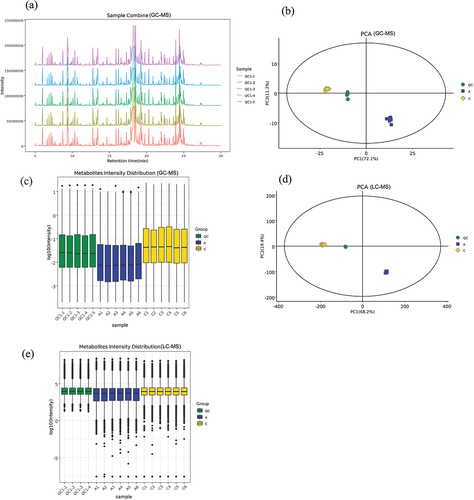
The TIC plots of QCs from GC – MS were analyzed using spectral overlap, as shown in . The peaks in the plots exhibited similar response intensities and retention times, indicating minimal variation due to instrumental error during the experiment. The PCA model plots generated from GC – MS and LC – MS data through 7-fold cross-validation () demonstrated that both the QCs and samples were tightly clustered, highlighting the strong experimental stability and reproducibility. The metabolite intensity box plot of QCs and samples for GC – MS and LC – MS () where the horizontal coordinate is the sample number and the vertical coordinate is the log10 value of the abundance of each metabolite in the samples reflected that the QCs and samples were consistent and showed intra-group reproducibility.
Figure 4. Quality control results of GC – MS and LC – MS (Group A:JDSB, Group C: jiaotou). (a) Total ion chromatogram overlay of GC – MS. (b) QCs GC – MS PCA score plots for all samples. (c) GC – MS metabolite intensity box plot. (d) LC – MS PCA score plots for all samples. (e) LC – MS metabolite intensity box plot.
Multivariate analysis
The GC – MS volatiles were subjected to PCA analysis. The first and second principal components contributed 86.1% and 3.0%, respectively (; groups A and C are JDSB and jiaotou, respectively),indicating a significant change in the volatile metabolites during jiaotou processing.
Figure 5. Multivariate statistical analysis results (Group A:JDSB, Group C: jiaotou). (a) PCA of GC – MS. (b) OPLS-DA of GC – MS. (c) PCA of LC – MS. (d) OPLS-DA of LC – MS.
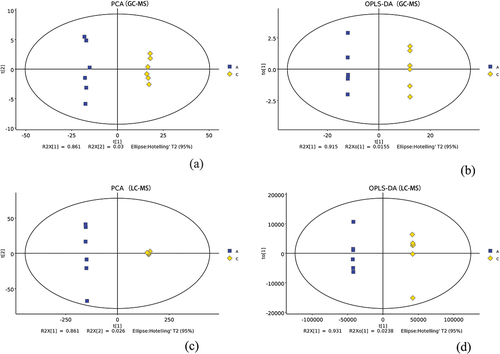
The OPLS-DA model yielded two principal components, and the first and second accounted for 91.6% and 1.55%, respectively, of the total variation (). The OPLS-DA model was valid because the two sample groups were well-separated.
The PCA of the LC – MS results revealed that the first and second principal components accounted for 86.1% and 2.6%, respectively, of the total variation (). A clear separation between the sample groups was observed. Similarly, the PLS-DA model yielded two principal components: the first and second components accounted for 93.1% and 2.3%, respectively, of the total variation. Therefore, the two groups could be differentiated, confirming that the OPLS-DA model was well-constructed and that the predictions were credible and significant ().
Screening of differential metabolites
In total, 153 distinct metabolites were identified through GC – MS, of which 144 were downregulated and nine were upregulated. Similarly, 1263 distinct metabolites were detected using LC – MS, with 739 and 524 metabolites downregulated and upregulated, respectively ().
Figure 6. Differential metabolite analysis (Group A:JDSB, Group C: jiaotou). Volcano diagrams of (a) GC – MS (c) and LC – MS differential metabolites. Heatmap of the top 50 differential metabolites from (b) GC – MS and (d) LC – MS.
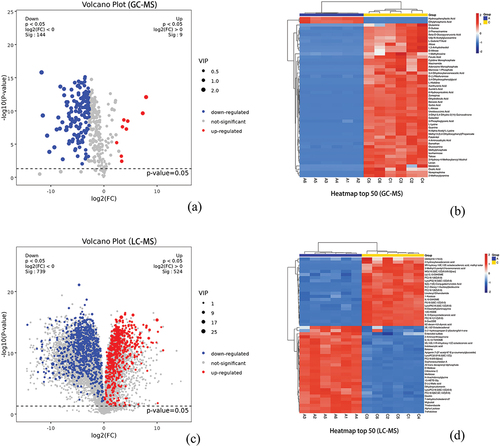
Among the top 50 volatile differential metabolites, the expression of ethylphosphonic acid and hydroxyphenyllactic acid was upregulated in JDSB, whereas the expression of 48 metabolites, including glutamine, D-glutamine, and 2-phenazine was upregulated in jiaotou. (). The expression of 28 metabolites (including 2E, 13Z-octadecadienal, 5-(1-hydroxy-propan-2-yl)-isolongifol-4-ene, and enterodiol sulfate) was upregulated in JDSB among the top 50 non-volatile differential metabolites. In contrast, the expression of 22 metabolites (including GM4 (d18:1/16:0) and 2-hydroxyhexadecano) was upregulated in jiaotou. Further analysis of the substances revealed that the top 50 compounds detected by GC – MS comprised 23 acids, 10 amines, 6 alcohols, 6 aldoses, 1 ketone, 1 ester, and 3 other compounds. The LC – MS results indicated the presence of 16 acids, 10 cholines, 7 sugars, 4 esters, 3 amines, and 10 other compounds (). The jiaotou group displayed higher acid concentrations, whereas the JDSB group had higher sugar concentrations.
Correlation analysis of differential metabolites
A significance matrix and protein – protein interaction (PPI) network were constructed to visualize the relationships between the top 20 metabolites () and protein – protein interactions (). In the PPI network, there were 18 nodes and 74 edges, and the significance matrix illustrated the up-down relationship and significant differences between metabolites. For example, betaine positively correlated with miglustat levels and negatively correlated with phosphatidylcholine levels. There was a positive correlation between citbismine c, D-maltose, and trehalulose but a negative correlation with phosphatidylcholine (18:1(9Z)/0:0).
Figure 7. Correlation analysis of differential metabolites: (a) Significance matrix and (b) Protein – protein interaction network. (c) Kyoto Encyclopedia of Genes and Genomes pathway enrichment analysis.
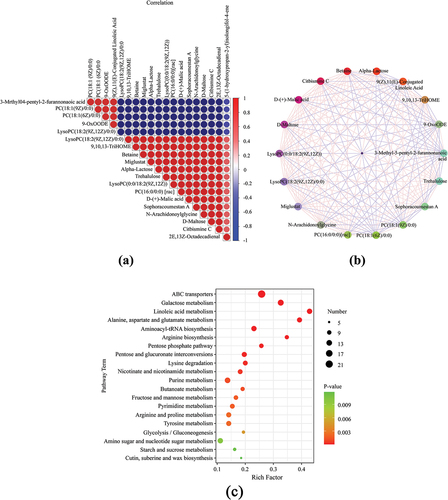
Pathway enrichment analysis
A KEGG enrichment analysis was conducted to analyze the differential metabolite pathways. Significant enrichment was observed for linoleic acid (LA), ABC transporter, alanine, aspartate, glutamate, and galactose metabolism ().
Combined analysis of metagenomic and metabolomic
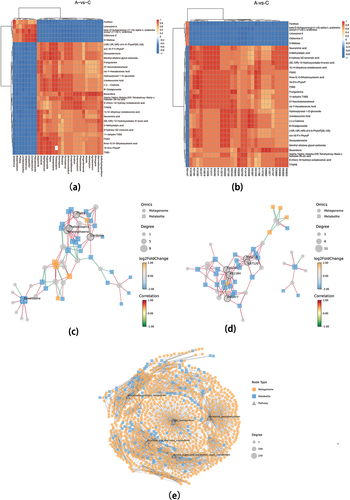
The top 30 entries exhibiting notable discrepancies between metagenomes and metabolomes were selected for the calculation of the correlation between them, which was then plotted in a heat map. illustrates the gene-level correlations, while depicts the KEGG function-level correlations. The network diagrams of the associations are presented in (gene-level) and 8d (KEGG function-level). illustrates the KEGG Markup Language (KGML) network analysis. The nodes with the highest connectivity were ABC transporters, Fructose and mannose metabolism, Amino sugar and nucleotide sugar metabolism, Glycerolipid metabolism, and Oxidative phosphorylation.
Figure 8. Combined metagenomic and metabolomic analysis (Group A: JDSB, Group C: jiaotou).
Discussion
Chinese steamed bread from different regions has different tastes and preparation methods. The humid climate of the Jinhua region is conducive to dough leavening and fermentation. However, large-scale production is not possible owing to the complex production process; therefore, achieving more efficient, standardized production without sacrificing quality is a key challenge.
Metagenomic analysis of the microorganisms in jiaotou and JDSB had a coverage of 1.00, indicating almost complete coverage of the present microorganisms. The Shannon’s index reflects uniformity and a higher value indicates better sample uniformity. In contrast, the Simpson index reveals species dominance, and a higher value indicates a more uneven species distribution (Xiang et al., Citation2023) and more prominent ecological function of the dominant organisms. The jiaotou gene set was utilized to create a database for researching JDSB fermenter genes. The microorganisms in jiaotou were enriched and expanded in culture, resulting in a high density and high activity colony. Microbial growth, proliferation, and genetic stability are dependent on DNA replication, recombination, repair, and transcription, resulting in an abundance of related functional genes. The processing of the product involves a high proportion of genes related to carbohydrate metabolism, amino acid metabolism, and energy metabolism that contribute to the normal fermentation process to a certain extent. The diverse fungal composition of jiaotou indicates the range of enzyme systems that affect the product. Overall, the dominant bacteria in jiaotou were Rhizopus sp., of which Rhizopus arrhizus, R. microsporus, and R. delemar. accounted for approximately 41%,10%, and 10%, respectively, of the abundance. Additional ingredients such as water pepper (Polygonum hydropiper) are added during production to promote Rhizobium development. Consequently, proteases are produced, yielding a pH range of 4.2–5.5, and this is typical of sourdough (Yan, Sadiq, Cai, Fan, Chen, et al., Citation2019). Thus, steamed bread can accumulate a substantial amount of free amino acids without acquiring the characteristic sourness of steamed bread produced in the north of China (pH 3.5–3.8) (T. Liu et al., Citation2018). Meanwhile, JDSB acquires a distinct aroma of Huangjiu (yellow wine). Rhizopus can ferment many substrates, especially beans (except soya), and experiments in cereal fermentation were conducted at the laboratory and pilot scales (Lücke et al., Citation2019). Fermented food prepared with Rhizopus delemar contain a range of different acids (X. Li et al., Citation2014; Odoni et al., Citation2017). The addition of xylanase and cellulase significantly improves the specific volume and texture of Chinese steamed bread (W. Liu et al., Citation2023). Therefore, our analysis revealed that Rhizopus is the key bacterial species in jiaotou and the primary microorganisms responsible for fermentation and saccharification. The diverse microorganism composition in the dough matrix results in saccharification and esterification and can enhance yeast-based fermentation. Rhizopus sp. abundance was notably low in the processed JDSB and a significant difference was detected between the metagenomic dominant flora of JDSB and jiaotou. This may be attributed to the DNA damage caused by high temperature processes such as steaming and cooking during JDSB processing. Meanwhile, the incorporation of indica rice, wheat bran and other materials were added to the processing of JDSB to promote further fermentation, which would introduce some new microorganisms. Consequently, further studies are required to assess the changes in microorganisms during JDSB processing.
Although the microbial properties of steamed bread leavening agents are affected by regional microbial strains, which results in a complex sourdough composition, lactic acid bacteria and yeasts are the main components of sourdough flora in most areas of China (Xi et al., Citation2020). In the case of JDSB, the use of jiaotou increased the number of microorganisms in the dough, facilitating cooperative fermentation and providing its distinctive taste. Studies show that simultaneous fermentation by yeast and lactic acid bacteria improves the rheological properties of the dough and retains the air bubbles (Bintsis, Citation2018). The identified Lactobacillus sp. not only produces lactic acid by carbohydrate fermentation but also participates in the production of many beneficial compounds, such as organic acids, polyols, extracellular polysaccharides, and antibacterial components. This finding is similar to that of previous studies; that is, exopolysaccharides, enzymes, and organic acids are produced during the co-fermentation of yeast and lactic acid bacteria (CFYL) (Sang et al., Citation2018). Furthermore, the differences in the metabolism and kinetics of lactic acid bacteria (LAB) and yeast result in the production of specific volatiles during fermentation (Sun et al., Citation2023). Consequently, the use of jiaotou can introduce a greater variety of fermented microorganisms to steamed bread, increasing its nutritional content and producing a distinct taste that differentiates it from bread fermented with standard yeasts.
The analysis of the non-targeted metabolome of the jiaotou used in JDSB and the resultant steamed bread revealed significant changes in composition. Most of the upregulated metabolites were esters and aldehydes, which are likely the major volatile organic compounds in steamed bread. Esters are primarily formed by the reaction of acids and alcohols during cooking, whereas aldehydes are formed by the oxidation of palmitic and linoleic acids during fermentation and cooking (Yan, Sadiq, Cai, Fan, Zhang, et al., Citation2019). There were also more aldoses and amino acids in the jiaotou group, which may provide some microorganisms with a rich source of nitrogen and carbon. In addition, there was enrichment of several metabolites involved in linoleic acid metabolism, ABC transporter protein metabolism, and alanine, aspartic acid, glutamic acid, and galactose metabolism. Several amino acids and amines in the jiaotou group act as important flavor precursors that undergo oxidative degradation and decarboxylation to form small molecular weight compounds with distinct odors, including aldehydes, alcohols, organic acids, and aromatic compounds. In earlier studies, 110 metabolites were reported to be involved in amino acid metabolism, of which alanine, aspartic acid, and glutamic acid played a significant role. There is a strong correlation between these components and the creation and alteration of aroma (Cheng et al., Citation2023). In addition, ABC transporters affect yeast fermentation efficiency (Kumari et al., Citation2021). These observations suggest that jiaotou increases the content of linoleic acid and amino acids in steamed bread, whereas ABC transporters can transport lipids, sugars, and amino acids, thus enhancing the flavor and nutritional value of the bread. Humans must consume linoleic acid to ensure health, and there is evidence that linoleic acid contributes to glucose homeostasis (Hamilton & Klett, Citation2021; C. B. Yao et al., Citation2023). However, it is a dietary fatty acid. Notably, changes to fatty acid metabolism may indirectly affect glucose metabolism, leading to changes in the taste of steamed bread, saccharide production, and a sweeter taste.
Interestingly, the metabolomics pathway enrichment analysis was strongly correlated with the metagenomics functional level analysis of jiaotou. Gene-level correlation analyses of metagenomic and metabolomic data revealed changes in differential metabolites corresponding to the processing of dominant bacteria. Several KEGG pathways were related to changes in metabolites during processing, including cellular processes, environmental information processing, genetic information processing, metabolism, and organismal systems, and several pathways could affect the processing and quality of JDSB. ABC transporters play an important role in transporting and regulating the accumulation of secondary metabolites and phytohormones (Zhu et al., Citation2020). Nevertheless, little is known about the effects of ABC transporter proteins on the accumulation of flavor-related metabolites and flavor formation during steamed bread processing. In Lactobacillus, NADPH oxidase is activated by calcium signaling and the MAPK pathway. Consequently, yeast cells produce more reactive oxygen species. The activated antioxidant system confers greater oxidative tolerance to yeast cells (Kang et al., Citation2021).
Notably, the linoleic acid metabolic pathway has not been found in the analysis of conventional steamed bread from other regions of China or in other pasta dishes. Microbiological processes can convert linoleic acid (LA) into conjugated linoleic acid (CLA) (Silva et al., Citation2011), as well as produce glycolipids (W. Liu et al., Citation2023). Adding CLA to steamed bread reduces the rate of dough water absorption and forming time, increases elongation energy, maximum elongation resistance, and stretch ratio, and decreases extensibility. Thus, it is possible that LA metabolism contributes to the development of JDSB’s distinctive nutritional and textural characteristics. Crucially, the steamed bread showed improved texture and nutritional value because of physicochemical changes, such as protein denaturation, polysaccharide solubilization, and starch gelatinization during processing.
Analysis of the non-targeted metabolome of JDSB revealed the absence of aromatic markers that occur naturally in steamed bread from other Chinese regions, such as coumaryl alcohol, 2-phenoxyethanol, methyl cinnamic acid, guaiacol, and o-cresol. These compounds are frequently used as markers of yeast-fermented steamed bread (An et al., Citation2023; Huang et al., Citation2022; Y.-H. Wang et al., Citation2021). However, further assessments should be conducted to evaluate the taste and other properties of JDSB, which would aid in identifying the distinctive flavor compounds of JDSB compared with those in food products from other parts of China. These findings establish a theoretical framework for quality standardization.
Metagenomic analyses revealed the composition and function of jiaotou microbial communities. However, they only provided overall information and could not provide insight into the specific metabolic pathways and roles of individual microbes. Additionally, metabolomic sample processing and analysis had some uncertainties, complicating the data interpretation and analysis when complex microbial communities are involved. In future studies, the structural and functional information of microbial communities can be extensively analyzed in combination with other analytical techniques to obtain more comprehensive results. The fermentation time of JDSB produced in different seasons may slightly vary. Traditional processing methods rely on sensory testing experience to determine the degree of fermentation. Changes in conditions such as ambient temperature and humidity may affect fermentation and the microbial composition, which can also be influenced by seasonal changes. Therefore, future studies should select sample sets from different seasons for analysis to provide more theoretical support for the standardized production of JDSB. Furthermore, time series and dynamic sampling will be conducted during JDBS processing to observe the changes and evolution of jiaotou during processing and reveal its dynamic regulation mechanism during fermentation.This would improve the reliability and practicality of the conclusions and provide a scientific basis for further improvement and optimization of JDBS processing.
In conclusion, metagenomic and metabonomic analyses were conducted to investigate the effects of the leavening agent used in JDSB on the production process and the resulting product. We found differences in metabolites between JDSB and jiaotou and identified differences in the functionally enriched metabolites. Genome sequencing revealed that Rhizopus sp. was the most abundant species, consisting of Rhizopus arrhizus (41%), R. microsporus (10%), and R. delemar (10%). The enriched metabolites were LA, ABC transporters, and alanine, aspartate, glutamate, and galactose metabolism. Metagenomics showed a correlation with the metabolomics pathway enrichment analysis at the functional level. Furthermore, we explored the potential link between jiaotou and steamed bread processing quality by analyzing metagenomics and metabolomics data. These findings will contribute to improving the quality of JDSB and have remarkable scientific significance and application prospects for the preservation, advancement, and development of traditional food processing.
Geolocation information
China
Author contributions
Xinjie Wang – Conceptualization, methodology, writing – original draft preparation, data curation, funding acquisition; Huadong Xie – Validation, writing – review and editing; Xue Chen – Formal analysis; Jiawei Chen – Investigation; Hongliang Lou – Resources, project administration; Lijun Bu – Visualization.
Availability of materials and data
The data that support the findings of this study are available from the corresponding author, HX, upon reasonable request.
Acknowledgements
Special thanks to all other members of Professional Laboratory of Green Food Production Technology, Jinhua Polytechnic for their assistance in this study. We thank Editage (www.editage.cn) for English language editing.
Disclosure statement
No potential conflict of interest was reported by the author(s).
Additional information
Funding
References
- An, H., Zhai, C., Zhang, F., Ma, Q., Sun, J., Tang, Y., & Wang, W. (2023). Quantitative analysis of Chinese steamed bread staling using NIR, MIR, and Raman spectral data fusion. Food Chemistry, 405(A), 134821. https://doi.org/10.1016/j.foodchem.2022.134821
- Bintsis, T. (2018). Lactic acid bacteria as starter cultures: An update in their metabolism and genetics. AIMS Microbiology, 4(4), 665–14. https://doi.org/10.3934/microbiol.2018.4.665
- Bolger, A., Lohse, M., & Usadel, B. (2014). Trimmomatic: A flexible trimmer for illumina sequence data. Bioinformatics, 30(15), 2114–2120. https://doi.org/10.1093/bioinformatics/btu170
- Buchfink, B., Xie, C., & Huson, D. H. (2015). Fast and sensitive protein alignment using DIAMOND. Nature Methods, 12(1), 59–60. https://doi.org/10.1038/nmeth.3176
- Cheng, H., Mei, J., & Xie, J. (2023). The odor deterioration of tilapia (Oreochromis mossambicus) fillets during cold storage revealed by LC-MS based metabolomics and HS-SPME-GC–MS analysis. Food Chemistry, 427, 136699. https://doi.org/10.1016/j.foodchem.2023.136699
- Graham, S. F., Farrel, D., Kennedy, T., Gordon, A., Farmer, L., Elliott, C., & Moss, B. (2012). Comparing GC-MS, HPLC and 1H NMR analysis of beef longissimus dorsi tissue extracts to determine the effect of suspension technique and ageing. Food Chemistry, 134(3), 1633–1639. https://doi.org/10.1016/j.foodchem.2012.03.047
- Guan, Q., Kang, X., Qin, X., Liu, Z., Ren, H., Xie, M., & Xiong, T. (2023). Metagenomic analysis of microbial-community structure and function during the fermentation of suansun, a Chinese traditional bamboo shoot. Food Bioscience, 54, 102908. https://doi.org/10.1016/j.fbio.2023.102908
- Hamilton, J. S., & Klett, E. L. (2021). Linoleic acid and the Regulation of glucose homeostasis: A review of the evidence. Prostaglandins, Leukotrienes, and Essential Fatty Acids, 175, 102366. https://doi.org/10.1016/j.plefa.2021.102366
- He, J., Zhang, Q., Li, M., Ming, T., Feng, J., Peng, H., Su, J., & Zhang, Y. (2023). Evaluating the influence of gradient applied voltages on electro-enhanced sequence batch reactor treating aniline wastewater: System performance, microbial community and functional genes. Journal of Cleaner Production, 389, 136077. https://doi.org/10.1016/j.jclepro.2023.136077
- Huang, Y., Wan, J., Wang, Z., Sun, M., Feng, T., Ho, C. T., & Song, S. (2022). Variation of volatile compounds and corresponding aroma profiles in Chinese steamed bread by various yeast species fermented at different times. Journal of Agricultural and Food Chemistry, 70(12), 3795–3806. https://doi.org/10.1021/acs.jafc.2c00550
- Hyatt, D., Chen, G., Locascio, P., Land, M., Larimer, F., & Hauser, L. (2010). Prodigal: Prokaryotic gene recognition and translation initiation site identification. Bmc Bioinformatics, 11(1), 119–119. https://doi.org/10.1186/1471-2105-11-119
- Jacyna, J., Kordalewska, M., & Markuszewski, M. J. (2019). Design of experiments in metabolomics-related studies: An overview. Journal of Pharmaceutical and Biomedical Analysis, 164, 598–606. https://doi.org/10.1016/j.jpba.2018.11.027
- Kang, X., Gao, Z., Zheng, L., Zhang, X., & Li, H. (2021). Regulation of Lactobacillus plantarum on the reactive oxygen species related metabolisms of Saccharomyces cerevisiae. LWT, 147, 111492. https://doi.org/10.1016/j.lwt.2021.111492
- Kumari, S., Kumar, M., Gaur, N. A., & Prasad, R. (2021). Multiple roles of ABC transporters in yeast. Fungal Genetics and Biology: FG and B, 150, 103550. https://doi.org/10.1016/j.fgb.2021.103550
- Li, D., Liu, C., Luo, R., Sadakane, K., & Lam, T. (2015). MEGAHIT: An ultra-fast single-node solution for large and complex metagenomics assembly via succinct de Bruijn graph. Bioinformatics, 31(10), 1674–1676. https://doi.org/10.1093/bioinformatics/btv033
- Li, G., Zhang, X., Qian, H., Liu, M., Zhao, G., & Xu, A. (2019). Gas chromatography-mass spectrometry based midgut metabolomics reveals the metabolic perturbations under NaF stress in Bombyx mori. Insects, 11(1), 17. https://doi.org/10.3390/insects11010017
- Li, W., Jaroszewski, L., & Godzik, A. (2001). Clustering of highly homologous sequences to reduce the size of large protein databases. Bioinformatics, 17(3), 282–283. https://doi.org/10.1093/bioinformatics/17.3.282
- Li, X., Liu, Y., Yang, Y., Zhang, H., Wang, H., Wu, Y., Zhang, M., Sun, T., Cheng, J., Wu, X., Pan, L., Jiang, S., & Wu, H. (2014). High levels of malic acid production by the bioconversion of corn straw hydrolyte using an isolated Rhizopus delemar strain. Biotechnology and Bioprocess Engineering, 19(3), 478–492. https://doi.org/10.1007/s12257-014-0047-z
- Liu, T., Li, Y., Sadiq, F. A., Yang, H., Gu, J., Yuan, L., Lee, Y. K., & He, G. (2018). Predominant yeasts in Chinese traditional sourdough and their influence on aroma formation in Chinese steamed bread. Food Chemistry, 242, 404–411. https://doi.org/10.1016/j.foodchem.2017.09.081
- Liu, W., Brennan, M., Brennan, C., You, L., & Tu, D. (2023). Effect of enyzmes on the quality and predicting glycaemic response of Chinese steamed bread. Foods, 12(2), 273. https://doi.org/10.3390/foods12020273
- Lücke, F. K., Fritz, V., Tannhäuser, K., & Arya, A. (2019). Controlled fermentation of rapeseed presscake by Rhizopus, and its effect on some components with relevance to human nutrition. Food Research International, 120, 726–732. https://doi.org/10.1016/j.foodres.2018.11.031
- Odoni, D. I., Tamayo-Ramos, J. A., Sloothaak, J., Van Heck, R. G. A., Martins Dos Santos, V. A. P., De Graaff, L. H., Suarez-Diez, M., & Schaap, P. J. (2017). Comparative proteomics of rhizopus delemar ATCC 20344 unravels the role of amino acid catabolism in fumarate accumulation. PeerJ, 5, e3133. https://doi.org/10.7717/peerj.3133
- Ripari, V., Cecchi, T., & Berardi, E. (2016). Microbiological characterisation and volatiles profile of model, ex-novo, and traditional Italian white wheat sourdoughs. Food Chemistry, 205, 297–307. https://doi.org/10.1016/j.foodchem.2016.02.150
- Rui, Y., & Qiu, G. (2022). Analysis of gut microbial communities and resistance genes in pigs and chickens in Central China. Animals, 12(23), 3404. https://doi.org/10.3390/ani12233404
- Sang, S., Zhang, H., Xu, L., Chen, Y., Xu, X., Jin, Z., Yang, N., Wu, F., & Li, D. (2018). Functionality of ovalbumin during Chinese steamed bread-making processing. Food Chemistry, 253, 203–210. https://doi.org/10.1016/j.foodchem.2018.01.150
- Silva, L. I. B., Rodrigues, D. M., Freitas, A. C., Gomes, A. M., Rocha-Santos, T. A. P., Pereira, M. E., & Duarte, A. C. (2011). Optical fibre-based methodology for screening the effect of probiotic bacteria on conjugated linoleic acid (CLA) in curdled milk. Food Chemistry, 127(1), 222–227. https://doi.org/10.1016/j.foodchem.2010.12.082
- Sun, X., Wu, S., Li, W., Koksel, F., Du, Y., Sun, L., Fang, Y., Hu, Q., & Pei, F. (2023). The effects of cooperative fermentation by yeast and lactic acid bacteria on the dough rheology, retention and stabilization of gas cells in a whole wheat flour dough system – A review. Food Hydrocolloids, 135, 108212. https://doi.org/10.1016/j.foodhyd.2022.108212
- Suo, B., Nie, W., Wang, Y., Ma, J., Xing, X., Huang, Z., Xu, C., Li, Z., & Ai, Z. (2020). Microbial diversity of fermented dough and volatile compounds in steamed bread prepared with traditional Chinese starters. LWT, 126, 109350. https://doi.org/10.1016/j.lwt.2020.109350
- Wang, F., Li, W., Wang, G., Yu, M., Zhong, J., Xu, C., Li, D., & Zhou, Y. (2019). Gas chromatography-mass spectrometry based serum metabolic analysis for premature infants and the relationship with necrotizing enterocolitis: A cross-sectional study. Italian Journal of Pediatrics, 45(1), 54. https://doi.org/10.1186/s13052-019-0646-6
- Wang, K., Qaisar, M., Chen, B., Xiao, J., & Cai, J. (2022). Metagenomic analysis of microbial community and metabolic pathway of simultaneous sulfide and nitrite removal process exposed to divergent hydraulic retention times. Bioresource Technology, 354, 127186. https://doi.org/10.1016/j.biortech.2022.127186
- Wang, Q., Deng, K., Ai, J., Wang, Y., Wang, Y., Ren, Y., & Zhang, N. (2023). Integrated transcriptomic and metabolomic analyses reveal the effects of grafting on special metabolites of acanthopanax senticosus leaves. Oxycedrus Needles and Berries Molecules, 28(12), 4877. https://doi.org/10.3390/molecules28124877
- Wang, Y.-H., Yang, Y.-Y., Zhang, J.-Y., Zhang, Q.-D., Xu, F., & Li, Z.-J. (2021). Characterization of volatiles and aroma in Chinese steamed bread during elaboration. Journal of Cereal Science, 101, 103310. https://doi.org/10.1016/j.jcs.2021.103310
- Xi, J., Xu, D., Wu, F., Jin, Z., Yin, Y., & Xu, X. (2020). The aroma compounds of Chinese steamed bread fermented with sourdough and instant dry yeast. Food Bioscience, 38, 100775. https://doi.org/10.1016/j.fbio.2020.100775
- Xiang, Y., Meng, Q., Zhang, X., Li, M., Yang, D., & Wu, Y. (2023). Soundscape diversity: Evaluation indices of the sound environment in urban green spaces – Effectiveness, role, and interpretation. Ecological Indicators, 154, 110725. https://doi.org/10.1016/j.ecolind.2023.110725
- Xue, T., Zhang, J., Wang, T., Bai, B., Hou, Z., Cheng, J., Bo, T., & Fan, S. (2023). Reveal the microbial communities and functional prediction during the fermentation of Fen-flavor Baijiu via metagenome combining amplicon sequencing. Annals of Microbiology, 73(1), 16. https://doi.org/10.1186/s13213-023-01719-6
- Yan, B., Sadiq, F. A., Cai, Y., Fan, D., Chen, W., Zhang, H., & Zhao, J. (2019). Microbial diversity in traditional type I sourdough and jiaozi and its influence on volatiles in Chinese steamed bread. LWT, 101, 764–773. https://doi.org/10.1016/j.lwt.2018.12.004
- Yan, B., Sadiq, F. A., Cai, Y., Fan, D., Zhang, H., Zhao, J., & Chen, W. (2019). Identification of key aroma compounds in type I sourdough-based Chinese steamed bread: Application of untargeted metabolomics analysisp. International Journal of Molecular Sciences, 20(4), 818. https://doi.org/10.3390/ijms20040818
- Yang, M., Lin, Q., Luo, Z., Ban, Z., Li, X., Reiter, R. J., Zhang, S., Wang, L., Liang, Z., Qi, M., & Li, L. (2023). Ongoings in the apple watercore: First evidence from proteomic and metabolomic analysis. Food Chemistry, 402, 134226. https://doi.org/10.1016/j.foodchem.2022.134226
- Yang, P., Zhong, G., Yang, J., Zhao, L., Sun, D., Tian, Y., Li, R., & Rong, L. (2022). Metagenomic and metabolomic profiling reveals the correlation between the microbiota and flavor compounds and nutrients in fermented sausages. Food Chemistry, 375, 131645. https://doi.org/10.1016/j.foodchem.2021.131645
- Yang, X., Lai, J. L., Li, J., Zhang, Y., Luo, X. G., Han, M. W., Zhu, Y. B., & Zhao, S. P. (2021). Biodegradation and physiological response mechanism of bacillus aryabhattai to cyclotetramethylenete-tranitramine (HMX) contamination. Journal of Environmental Management, 288, 112247. https://doi.org/10.1016/j.jenvman.2021.112247
- Yao, C. B., Feng, L., Wu, P., Liu, Y., Jiang, J., Zhang, L., Mi, H. F., Zhou, X. Q., & Jiang, W. D. (2023). Promotion of fatty acid metabolism and glucose metabolism in the muscle of sub-adult grass carp (Ctenopharyngodon idella): The role of alpha-linoleic acid/linoleic acid (ALA/LNA) ratios. Food Chemistry: X, 19, 100752. https://doi.org/10.1016/j.fochx.2023.100752
- Yao, L., Zhang, J., Lu, J., Chen, D., Song, S., Wang, H., Sun, M., & Feng, T. (2023). Revealing the influence of microbiota on the flavor of kombucha during natural fermentation process by metagenomic and GC-MS analysis. Food Research International, 169, 112909. https://doi.org/10.1016/j.foodres.2023.112909
- Yu, Q., Pan, H., Shao, H., Qian, C., Han, J., Li, Y., & Lou, Y. (2022). UPLC/MS-based untargeted metabolomics reveals the changes in muscle metabolism of electron beam irradiated solenocera melantho during refrigerated storage. Food Chemistry, 367, 130713. https://doi.org/10.1016/j.foodchem.2021.130713
- Zhu, C., Zhang, S., Zhou, C., Chen, L., Zaripov, T., Zhan, D., Weng, J., Lin, Y., Lai, Z., & Guo, Y. (2020). Integrated transcriptome, microRNA, and phytochemical analyses reveal roles of phytohormone signal transduction and ABC transporters in flavor formation of oolong tea (Camellia sinensis) during solar withering. Journal of Agricultural and Food Chemistry, 68(45), 12749–12767. https://doi.org/10.1021/acs.jafc.0c05750