
ABSTRACT
Microbial signatures show remarkable potentials in predicting colorectal cancer (CRC). This study aimed to evaluate the diagnostic powers of multimodal microbial signatures, multi-kingdom species, genes, and single-nucleotide variants (SNVs) for detecting precancerous adenomas. We performed cross-cohort analyses on whole metagenome sequencing data of 750 samples via xMarkerFinder to identify adenoma-associated microbial multimodal signatures. Our data revealed that fungal species outperformed species from other kingdoms with an area under the ROC curve (AUC) of 0.71 in distinguishing adenomas from controls. The microbial SNVs, including dark SNVs with synonymous mutations, displayed the strongest diagnostic capability with an AUC value of 0.89, sensitivity of 0.79, specificity of 0.85, and Matthews correlation coefficient (MCC) of 0.74. SNV biomarkers also exhibited outstanding performances in three independent validation cohorts (AUCs = 0.83, 0.82, 0.76; sensitivity = 1.0, 0.72, 0.93; specificity = 0.67, 0.81, 0.67, MCCs = 0.69, 0.83, 0.72) with high disease specificity for adenoma. In further support of the above results, functional analyses revealed more frequent inter-kingdom associations between bacteria and fungi, and abnormalities in quorum sensing, purine and butanoate metabolism in adenoma, which were validated in a newly recruited cohort via qRT-PCR. Therefore, these data extend our understanding of adenoma-associated multimodal alterations in the gut microbiome and provide a rationale of microbial SNVs for the early detection of CRC.
Introduction
Colorectal cancer (CRC), currently the second most frequently diagnosed cancer, accounts for approximately 10% of all new cancer cases globally.Citation1 Recent data reveal a rising incidence of CRC in individuals aged under 50 y,Citation2 indicating a heavier burden in the coming years for the health-care system worldwide. Of note, precancerous adenoma is a major precursor form of CRC about 10–15 y preceding cancer initiation, the early detection and removal of which could significantly alleviate the incidence and mortality of CRC.Citation1,Citation3
A wide variety of strategies are available for CRC diagnosis, including the combination of colonoscopy and histopathology as the gold standard, noninvasive test kits such as fecal occult blood test and fecal immunochemical test,Citation4 and risk-prediction score with simple metadata factors.Citation5 Progresses have also been made in blood or stool-based biomarkers, such as circulating tumor cells (CTC), circulating tumor DNA (ctDNA) and exosomes, broadly applied as noninvasive tools for tumor diagnosis, and for predictions of tumor recurrence and metastasis.Citation6,Citation7 However, these approaches are dissatisfactory with high false-positive rates (up to 76.4%) and poor sensitivity (down to 38%) for adenoma.Citation8,Citation9 Thus, there is an urgent need to explore and identify novel biomarkers specifically targeting the precancerous adenoma stage for the purpose of early detection of CRC.
As a frequently used proxy of intestinal microbiome, fecal sample has demonstrated some potentials for detecting CRC in diagnostic models based on bacterial abundances.Citation10–12 For early screening of CRC, bacterial species achieved an area under the ROC curve (AUC) of 0.80 for diagnosing adenomas with multiple cohorts.Citation13 Besides bacteria, the previously neglected non-bacteria microorganisms, such as fungi, archaea and viruses, are gaining attentions as novel candidate disease biomarkers. Alterations in non-bacterial enteric microbiome and of intra- and inter-kingdom microbial interactions have also been revealed in nonalcoholic fatty liver disease (NAFLD),Citation14 inflammatory bowel disease (IBD)Citation15,Citation16 and CRC.Citation17–20 Along this direction, we recently achieved improved specificity and accuracy for early-stage CRC screening with microbial multi-kingdom species compared to single-kingdom species.Citation21 On the other hand, it has been reported that CRC associates with microbial genes more robustly than with microbial species,Citation22 reflecting the importance of the functional omics in health and disease.Citation23 Yet another type of microbial features, single-nucleotide variants (SNVs), representing intra-species level variations, has emerged as effective diagnostic biomarkers for CRC and other diseases.Citation24,Citation25 As such, one immediate question is, what are the predictive capabilities of the microbial multi-kingdom species, genes, and SNVs for precancerous adenomas, and whether the combination of different types of microbial features could outperform the individual type of microbial features?
To address these questions, we performed comprehensive analyses on whole metagenome sequencing (WMS) data from seven cohorts (750 samples) to systematically explore the capability of multimodal biomarkers for detecting adenoma, aiming to facilitate the early detection of CRC. We observed that the SNV-based diagnostic model achieved superior accuracy (AUC = 0.89), drastically outperforming species- and gene-based models for adenoma diagnosis. Furthermore, functional dysbiosis related to microbial quorum sensing, purine and butanoate metabolism was observed in the microbiome of adenoma patients.
Results
Characteristics of multiple cohorts and consistent processing of metagenome data
In this study, we included fecal WMS data of 750 samples from six published studies and one in-house cohort with samples collected in China. To conduct a comprehensive analysis, 622 samples including 183 colorectal adenomas and 439 controls from four cohorts were set as the discovery dataset for adenoma-associated signature identification, model construction, and association analysis. To ensure the reliability of our results, the remaining 128 samples (63 adenomas and 64) from three cohorts were used to evaluate the robustness of our findings (, Fig. S1, Data S1). In addition, 59 samples (29 adenoma patients and 30 healthy controls) were newly collected in China to conduct qRT-PCR validations.
Figure 1. Experimental design and the integrated analysis of adenoma-associated microbiome. (a) Experimental design. A total of 622 samples comprising 183 colorectal adenoma patients and 439 healthy controls were included in the discovery dataset. WMS data were then processed consistently to establish cross-cohort multimodal biomarkers and diagnostic models via xMarkerFinder. Further, the external validation dataset (128 samples) and datasets of other microbiome-linked diseases were used to independently assess the robustness and disease specificity of established biomarkers and diagnostic models. (b) The PERMANOVA test identified “cohort” as the major confounder and demographic indices (gender, age, and BMI) as minor confounders. Asterisks: statistical significance (*P < .05; **P < .01; ***P < .001). (c) Principal coordinate analysis (PCoA) of microbial taxonomic classifications showing that gut microbiota differed between adenoma patients and healthy controls (P = .001). P values of beta diversity based on Bray–Curtis distance were calculated with PERMANOVA test. Each point in the PCoA plots represents a sample and the colors of points represent different groups. (d, e) Phylogenetic trees showing the differential bacterial ((d) 110 in total) and fungal ((e) 216 in total) species. The outer circles are marked for significant differential species (P < .05) in each cohort identified via Maaslin2 and in the meta-analysis identified via MMUPHin (META ring). Orange and blue indicate increased and decreased abundance of the species, respectively.
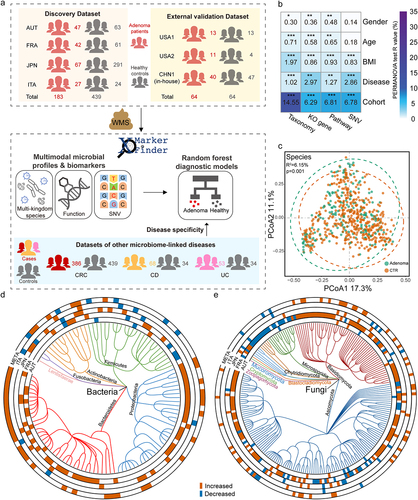
The primary objective of this study is to investigate cross-cohort adenoma-associated microbial signatures, including the taxonomic, functional, and SNV levels. To avoid technical bias across cohorts, all raw sequencing data were reprocessed consistently for microbial multimodal profiling. Considering the heterogeneity caused by various factors across different cohorts, the effects of major metadata variables on profiles of each modality were estimated by Permutational multivariate analysis of variance (PERMANOVA) test, which revealed the predominant impact of “cohort” explaining the largest proportions of variances in all data layers (). Following “cohort”, disease status, body mass index (BMI), age, and gender exhibited lower but significant impact on the microbial profiles. Therefore, “cohort” was treated as the major confounder, while gender, age, and BMI were used as covariates in the identification of multimodal differential signatures by Meta-analysis Methods with a Uniform Pipeline for Heterogeneity in Microbiome Studies (MMUPHin) wrapped in xMarkerFinder.
Adenoma-associated microbial multi-kingdom species
With all samples from the discovery cohorts, beta diversity based on Bray–Curtis dissimilarity among the taxonomic profiles showed that gut microbiota highly differed between adenoma patients and healthy controls (R2 = 6.15%, P = .001, ). On the other hand, a trend of increased alpha diversity was observed in adenoma patients than that of controls, albeit not statistically significant (Fig. S2a, b).
We then explored adenoma-associated microbial taxonomic signatures. As expected, different sets of bacterial species were identified as differential species in distinct cohorts (, e, Fig. S2c, d), necessitating the integrated analysis on demographically distinct populations to identify cross-cohort adenoma-associated species that can transcend potential confounders. With the combined discovery dataset, we identified 46 differential bacterial species between adenoma and control (Data S2, ). Consistent with our previous work,Citation13 six bacterial species with decreased abundances in adenoma were observed, including Bifidobacterium longum, Ruminococcus bicirculans, Longibaculum sp. KGMB06250, Eggerthella lenta, Blautia sp. YL58, and Enterococcus faecium. Meanwhile, the abundances of 40 bacterial species were increased in adenoma compared with control, including Alistipes shahii, Paraprevotella xylaniphila, Bacteroides helcogenes, and particularly, two pathogenic bacteria, Bacteroides caccae and Prevotella intermedia.
Next, we examined the alterations in non-bacterial microorganisms including fungi, archaea and viruses. The abundances of 42 out of 50 differential fungal species were increased in adenoma compared to control, including Sistotremastrum suecicum, Postia placenta, Kwoniella bestiolae, and Fusarium pseudograminearum, while the abundances of Rhizophagus irregularis, Aspergillus niger, Aspergillus ochraceoroseus, Leucoagaricus sp. SymC.cos, Aspergillus japonicus, Hyphopichia burtonii, Nematocida parisii, and Enterospora canceri were decreased (Data S2, ). For archaea, among 11 significantly differential archaeal species, the abundances of Thermococcus eurythermalis and Methanothrix soehngenii were increased, while other nine archaeal species were decreased in adenoma patients (Data S2, Fig. S2c). For viruses, six differential signatures were identified. Enterobacteria phage P4, Salmonella phage epsilon34, and giant viruses including Pandoravirus inopinatum and Orpheovirus IHUMI-LCC2 were observed with greater abundances in adenoma compared to control, while Mycobacterium virus Giles and Escherichia virus RB49 were with lower abundances (Data S2, Fig. S2d). Our data highlighted not only bacterial signatures but also the previously overlooked non-bacterial signatures in adenoma.
Adenoma-associated microbial functional alterations
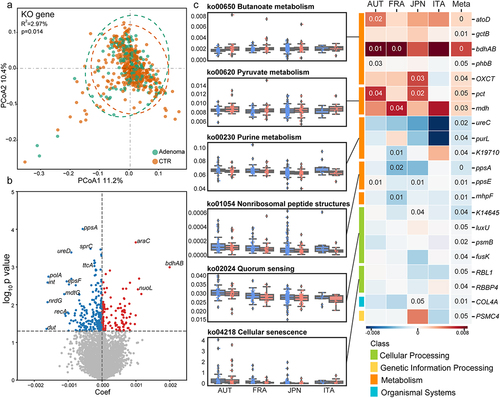
Microbial functional alterations were examined at KEGG orthology (KO) gene and pathway levels, respectively. Significant differences in the beta diversity analysis of the entire set of microbial KO genes between adenoma and control (R2 = 2.97%, P = .014, ) indicated altered microbial functions in adenoma. On the other hand, increased alpha diversity of the microbial genes was observed in adenoma patients compared to controls (Fig. S3 a, b).
Similarly, the integrated analysis identified 386 differential KO genes, including 150 KO genes with increased abundances and 236 KO genes with decreased abundances in adenoma patients compared with healthy controls (, Data S3). At pathway level, 15 differential pathways were identified (, Data S4). Among these, five pathways enriched in adenoma were related to metabolism, such as butanoate metabolism, pyruvate metabolism, and styrene degradation, and organismal systems, including proximal tubule bicarbonate reclamation and transduction olfactory. Consistently, KO genes related to above pathways were more abundant in adenoma, such as propionate CoA-transferase (pct), and malate dehydrogenase (mdh) in pyruvate metabolism, as well as acetate CoA/acetoacetate CoA-transferase alpha subunit (atoD), glutaconate CoA-transferase subunit B (gctB), butanol dehydrogenase (bdhAB), acetoacetyl-CoA reductase (phbB) and 3-oxoacid CoA-transferase (OXCT) in butanoate metabolism (). On the other hand, ten pathways and relevant KO genes were negatively associated with adenoma. These pathways and KO genes were mainly involved in metabolism and cellular processes (). Specifically, the pathway of quorum sensing, a microbial cell-to-cell communication mechanism, was less represented in adenoma. Consistently, relevant KO genes, mainly genes of two-component systems, such as phosphorelay protein (luxU), and sensor histidine kinase (fusK) exhibited lower abundances in adenoma group. Similarly, purine metabolism pathway and corresponding genes, phosphoribosylformylglycinamidine synthase (purL), and urease subunit alpha (ureC) were less abundant in adenoma patients (). Collectively, these analyses revealed global alterations in microbial genes and pathways in adenoma across multiple cohorts.
Figure 2. Adenoma-associated microbial functional alterations. (a) PCoA of microbial functional KO genes showing that gut microbiota differed between adenoma patients and healthy controls (P = .014). P values of beta diversity based on Bray–Curtis distance were calculated with PERMANOVA. Each point in the PCoA plots represents a sample and the colors of points represent different groups. (b) Volcano plot showing the differential KO genes in all samples identified via MMUPHin. Each point represents a KO gene. Coefficient > 0, P < .05 (in red): genes significantly more abundant in adenoma compared with control; Coefficient < 0, P < .05 (in blue): genes significantly less abundant in adenoma compared with control; P > .05 (in gray): non-differential genes. (c) The box plots (left) show the relative abundances of pathways in adenoma (red) and control (blue). Heatmap (right) shows the abundances of relevant differential KO genes in each of the four cohorts. Coefficient values were calculated via MaAsLin2 in each cohort and MMUPHin in meta-analysis with red for down-expression and blue for over-expression in adenoma patients compared with healthy controls. Only P values <.05 are shown in the cells.
Adenoma-associated microbial SNV signatures
The microbial genetic variation, SNV, represents potential alterations in the intra-species strain level of microbial functionality. We next examined the SNV signatures of adenoma against 28 commonly detected microbial strains (average coverage > 3X and prevalence > 10%) in the discovery dataset (Data. S5). Among these, four strains belonged to the above identified differential species, including A. shahii (~11X) and B. caccae (~18X) with greater relative abundances in adenomas compared with controls and R. bicirculans (~27X) and B. longum (~27X) with lower relative abundances (Data. S2).
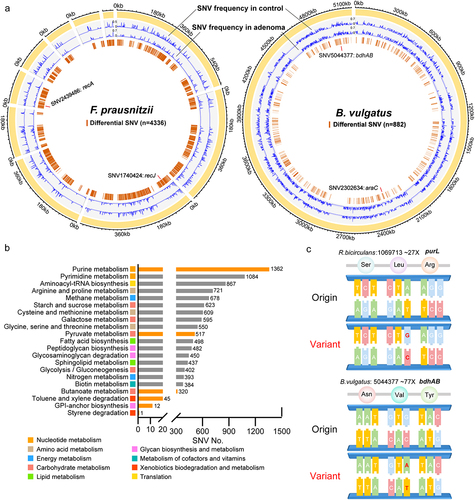
Meta-analytic differential testing identified SNVs with differential frequencies between adenoma and control samples across four cohorts (Data. S5). Most of the differential SNVs were located in coding sequence (CDS) with only 10% in intergenic region (Data. S6). Meanwhile, differential SNVs were mainly located in metabolism-related genes (), especially genes of purine metabolism (1362 SNVs) and pyrimidine metabolism (1084 SNVs) of nucleotide metabolism pathways, as well as amino acid metabolism pathways, including arginine and proline metabolism (721 SNVs), cysteine and methionine metabolism (609 SNVs) and glycine, serine and threonine metabolism (550 SNVs). Notably, considerable differential SNVs were related to the aforementioned differential functional pathways, such as purine metabolism, pyruvate metabolism (517 SNVs), butanoate metabolism (320 SNVs) and styrene degradation (one SNV). Additionally, several differential SNVs were located in previously identified differential genes, such as SNV (1069713) of R. bicirculansin in purL and SNV (5044377) of Bacteroides vulgatus in bdhAB (). These findings further underlined the importance of microbial genetic variations in the pathology of adenoma and the potential diagnostic capabilities of SNVs.
Figure 3. Microbial SNV signatures in adenoma. (a) Genomic locations of SNVs in the strains of F. prausnitzii (61481) and B. vulgatus (57955). Yellow outer rings represent the contigs of the reference genomes of the annotated strains. SNV frequencies in adenoma and control were indicated by blue lines in the second and third rings, respectively. The fourth ring indicates locations of identified differential SNVs (brown lines). (b) Bar plots showing the number of differential SNVs that belongs to each functional pathway with orange indicating previously established differential pathways. (c) Mapping of two differential SNVs located in differential genes. Mutated nucleotides (red) and corresponding amino acids were shown. The average SNV coverage of the two strains was provided.
The diagnostic models for adenoma based on microbial multimodal biomarkers
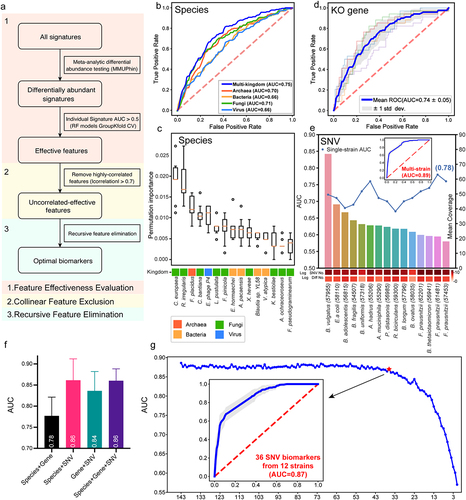
The performance of diagnostic models highly depends on features. Thus, to determine optimal features for model construction, we employed Triple-E, a comprehensive three-step feature selection procedure in xMarkerFinder, which mainly comprises feature effectiveness evaluation, collinear feature exclusion and recursive feature elimination (, detail in Methods). Furthermore, random forest (RF) models were optimized via adjustment of hyperparameters.
Models based on multi-kingdom species outperform models with single-kingdom species
Diagnostic models based on bacterial abundances are widely used approaches for disease screening.Citation10,Citation13,Citation26 Considering the alterations in all four microbial kingdoms, we assessed the prediction capabilities of microbial features in four kingdoms, respectively. Unexpectedly, the diagnostic model constructed with eight fungal species displayed the strongest ability to distinguish adenoma from control (AUC = 0.71), superior to models based on archaeal species (AUC = 0.70, four biomarkers), bacterial species (AUC = 0.66, five biomarkers), and viral species (AUC = 0.66, four biomarkers, , Data S7). The AUC values of models based on two-kingdom and three-kingdom species features were slightly improved compared to those with single-kingdom features, ranging from 0.66 to 0.74 (Fig. S4), suggesting additive predictive value of the combination of species biomarkers from different kingdoms. Notably, the diagnostic model constructed with a core set of optimal species biomarkers from all four kingdoms achieved the highest AUC of 0.75 for distinguishing adenoma patients from controls (). The observation that the best-performing multi-kingdom diagnostic model encompassed nine fungal species biomarkers out of a total of 15 species, including Cyphellophora europaea and R. irregularis acting as the most contributing biomarkers, further corroborated the prominent potential of the fungal kingdom in early detection of CRC ().
Microbial functional biomarkers for adenoma prediction
Functional classifiers were constructed with the differential genes and pathways. The optimal gene-based model comprising 31 KO genes achieved an AUC of 0.74, higher than those of the models constructed with single-kingdom species biomarkers while slightly lower than that of the best-performing multi-kingdom species model (). Genes involved in metabolic pathways, such as prepilin peptidase (pilD), ethanolamine utilization protein (eutN), and bdhAB, and genes involved in genetic information process, such as putative DNA relaxase (nicK) and urease accessory protein (ureE), contributed most to the diagnostic capability of the model (Fig. S5). In addition, the diagnostic model based on seven optimal pathways achieved a relatively low AUC of 0.68 (Fig. S6), which may be rationalized by the fact that functional pathways provide aggregated gene information, thus neutralizing individual signatures’ variations.
Figure 4. Diagnostic models based on microbial multimodal biomarkers. (a) The workflow of “Triple-E” feature selection procedure in xMarkerFinder. (1) Feature Effectiveness Evaluation. The differentially abundant signatures were identified using MMUPHin out of all multimodal signatures. Each single differential signature was then used to build an RF model with GroupKfold cross-validation and signatures with AUC values above 0.5 were defined as “effective features”. (2) Collinear Feature Exclusion. For all effective features, only those with absolute values of Spearman’s rank correlation coefficients less than 0.7 were reserved as “uncorrelated-effective features”. (3) Recursive Feature Elimination. The recursive feature elimination method was utilized to determine the “optimal biomarkers” as the best panel of features used for model construction. (b) Receiver operating characteristic (ROC) curve of the optimized models constructed with species-level biomarkers. Mean AUC and standard deviation of stratified fivefold cross-validation were shown. (c) Permutation feature importances of the optimized model constructed with multi-kingdom species-level features. Color represents different kingdoms. (d) ROC curve of the optimized models constructed with KO gene-level biomarkers. Mean AUC and standard deviation of stratified fivefold cross-validation were shown. (e) The upper plot showing the performances of single-strain SNV models and the multi-strain SNV model. Bar plot shows the mean coverage of each strain across all samples in the discovery dataset. The log-transformed numbers of annotated SNVs and differential SNVs in each strain are color-coded and indicated below the bar plot. (f) Box plot showing the cross-validation AUC values of models constructed with the combination of multimodal biomarkers. Mean AUCs and standard deviations are shown. (g) The process of selecting the minimal panel of SNV biomarkers with the inner plot showing the ROC curve of the minimal panel of SNV biomarkers.
Microbial SNVs are better diagnostic biomarkers for adenoma
Given that microbial genetic variations have profound impact on microbial intra-species diversities and that the integrated analysis identified considerable cross-cohort differential SNVs, we next evaluated the diagnostic potential of microbial SNVs. First, we identified optimal SNV biomarkers from each strain to construct single-strian models that achieved AUC values ranging from 0.67 to 0.78 (, Data S5). Of note, 3 out of 15 single-strain SNV models outperformed both multi-kingdom species and gene models, including F. prausnitzii (61481) (AUC = 0.78, ~21X), F. prausnitzii (57453) (AUC = 0.76, ~18X), and A. hadrus (55206) (AUC = 0.76, ~29X, ). The observation that the taxonomic abundances of F. prausnitzii and A. hadrus did not differ between adenoma and control further testified for the prevailing diagnostic capabilities and sensitivity of microbial SNVs in detecting adenoma. Furthermore, to evaluate the predictive ability of the combination of multi-strain SNVs, optimal SNV biomarkers from each single-strain models were pooled together and a multi-strain SNV model (143 SNV biomarkers) was established achieving a highest AUC value of 0.89 with a sensitivity value of 0.79, a specificity value of 0.85, and a Matthews correlation coefficient (MCC) value of 0.74 ().
To better understand the multi-strain SNV diagnostic model, we examined the biomarkers’ distribution and found that 61 of the 143 SNV biomarkers were located in the genome of F. prausnitzii (8 in strain 62201, 10 in strain 57453, and 43 in strain 61481), one of the most abundant species in human intestines (Data S8).Citation27 Of the 143 SNVs, 131 were located in CDS with nearly half (62 SNVs) being synonymous mutations that commonly do not alter the structure or function of the encoded proteins. Here, we referred to these SNVs as “dark SNVs” due to their absence of alteration in encoded amino acids. These dark SNVs exhibited diagnostic potential for adenoma.
To test the hypothesis that the combination of multimodal biomarkers might provide additive predictive capabilities, we then evaluated the predictability of models based on the combination of optimal biomarkers from species, genes and SNVs. Improved performance (AUC = 0.78) was observed with the combination of species- and gene-level biomarkers (). However, we were surprised by the decreased diagnostic performances when adding species or gene biomarkers to the SNV model (). Thus, the SNV model was the best-performing diagnostic model for detecting adenoma.
Considering the efficiency and cost-effectiveness in clinical practice, we further identified a minimal set of SNV biomarkers via recursive feature elimination and the classifier constructed with a core set of 36 SNV (with 21 being synonymous mutations) biomarkers reached an AUC of 0.87 (, Data S9), outperforming the combination of multimodal biomarkers (AUC = 0.86). The core set of 36 SNV biomarkers were therefore considered the best panel of adenoma biomarkers for potential clinical application.
Given the rising prevalence of early-onset CRC (patients diagnosed before age of 50) in recent years, the identification of biomarkers that specifically target early-onset CRC has drawn much attention.Citation28,Citation29 Here, we further explored the capabilities of microbial multimodal biomarkers for the detection of adenoma within a subset of the discovery datasets, including 11 adenoma patients and 73 controls aged under 50. The diagnostic model constructed with established species-, functional-, and SNV-level biomarkers reached remarkable AUC values of 0.81, 0.56, and 0.82 in distinguishing younger patients from controls (Fig. S7). Although these results indicated the significant potential of microbial biomarkers for detecting early-onset adenoma, further large-sample analyses are required to gain a more comprehensive understanding of early-onset colorectal cancers.
Figure 5. Characterization and validation of the best panel of SNV biomarkers. (a) SNV biomarkers’ distribution in each cohort and in meta-analysis. Heatmap of the coefficient values calculated via MaAsLin2 in each cohort or via MMUPHin in meta-analysis, with red for higher frequencies and blue for lower frequencies in adenoma patients compared with healthy controls. Asterisks indicate statistical significances (P < .05). Biomarkers are ordered according to their permutation importances in the diagnostic model (Rank column). The second column indicates the mutation type of each SNV biomarker, with red for non-synonymous mutations, blue for synonymous mutations, and gray for SNVs located in the intergenic region. (b) Internal validation AUC matrix. Values on the diagonal refer to the average AUC values of fivefold cross-validation within each cohort. Off-diagonal values refer to the AUC values obtained by training the classifier on the cohort of the corresponding row and applying it to the cohort of the corresponding column. The LOCO row refers to the performances obtained by training the model using all but the cohort of the corresponding column and applying it to the cohort of the corresponding column. (c) The performances of the optimal SNV biomarker panel in three external validation datasets. (d) The barplot showing the comparison of the performances of SNV biomarkers in RF models for different microbiome-linked diseases: adenoma, CRC, CD, and UC. P values were from two-sided Wilcoxon rank-sum tests. (e) Patterns of the correlations of SNV biomarkers with disease status: distinct patterns observed for adenoma and other microbiome-linked diseases. Coefficient values calculated by MaAsLin2 and MMUPHin of each SNV biomarker are plotted by color gradients with orange for disease-enriched SNVs and blue for control-enriched SNVs.
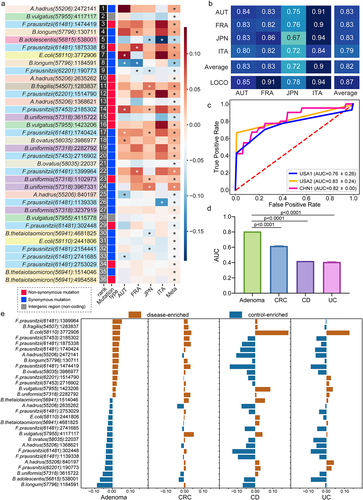
Microbial SNV biomarkers are robust and universal across cohorts
To ascertain the reproducibility of the best panel of SNV biomarkers, cohort-to-cohort and leave-one-cohort-out (LOCO) validations were performed. The AUC values of the models constructed with the best panel of SNV biomarkers ranged from 0.67 to 0.94 with an average of 0.82 for cohort-to-cohort validation and ranged from 0.78 to 0.94 with an average of 0.87 in LOCO validation (). To further test the robustness of the established best SNV panel, we evaluated their diagnostic capabilities with three external cohorts from different geographic regions and achieved AUC values of 0.83, 0.82 and 0.76, respectively (, sensitivity = 1.0, 0.72, 0.93; specificity = 0.67, 0.81,0.67, MCCs = 0.69, 0.83, 0.72). These substantial validations confirmed the robustness and generalizability of the identified best panel of microbial SNV biomarkers for adenoma diagnosis.
Specificity of microbial SNV biomarkers for adenoma prediction
To evaluate the disease specificity of the best panel of SNV biomarkers, the diagnostic capabilities of this SNV model were evaluated for prediction of other microbiome-linked diseases, including CRC, Crohn’s disease (CD) and ulcerative colitis (UC). The predictive AUC values of the SNV model for these three diseases were apparently lower than that of adenoma (), indicating a high disease specificity of SNV biomarkers for adenoma.
Additionally, we evaluated the correlations between each SNV biomarker and the disease status in adenoma and three non-adenoma diseases, and observed distinct patterns for adenoma and non-adenoma diseases (). Importantly, in CRC compared to adenoma, these SNVs were less significantly correlated with disease status, reflecting the capabilities of these SNVs in distinguishing adenoma from CRC or the CRC early detection at precancerous stage (). CD and UC, the two main subtypes of IBD, shared similar SNV correlation patterns which differed from those of adenoma (). Altogether, these analyses together demonstrated the disease specificity of the microbial SNV biomarkers for adenoma diagnosis.
Cross-modality associations among the microbial signatures are indicative of pathogenic mechanisms in adenoma
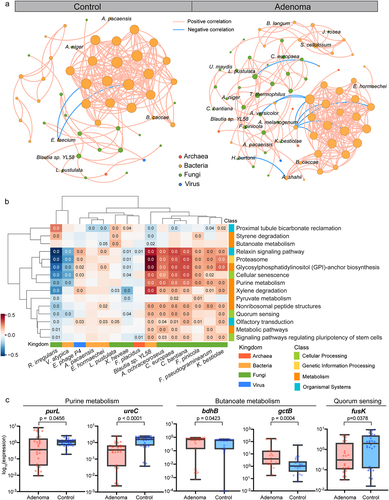
To explore the potential mechanisms for the microbial multimodal signatures to participate in adenoma pathogenesis, we constructed the microbial co-abundance networks in adenoma patients and healthy controls and observed distinct community structures. The microbial network of adenoma patients (76 species, 259 associations, Data S10) was far more complex than that of healthy controls (52 species, 185 associations, Data S11, ). Notably, adenoma network contained more frequent intra- and inter-kingdom connections, such as interactions among intra-fungal species, C. europaea-Thermothelomyces thermophilus, Cladophialophora bantiana-Ustilago maydis, and Aureobasidium melanogenum-K. bestiolae, and fungal-batcerial interactions among H. burtonii-A. shahii, Aspergillus versicolor-Prevotella enoeca and Jaminaea rosea- Sorangium cellulosum, indicating potential fungal involvement in adenoma pathogenesis through contributing to the microbial dysbiosis. Moreover, eight species biomarkers from the fungal and bacterial kingdoms, including C. europaea, C. bantiana, K. bestiolae, Lasallia pustulata, Fomitopsis pinicola, Enterobacter hormaechei, Actinomyces pacaensis and Blautia sp. YL58, presented more associations than other species, suggesting a core set of microbiota contributing to adenoma pathogenesis.
Besides, considerable associations were observed between differential functional pathways and species, as well as the optimal multi-kingdom species biomarkers (Fig. S8, ). Specifically, the species-level biomarkers A. ochraceoroseus, C. bantiana, C. europaea and K. bestiolae of fungal kingdom and Blautia sp. YL58 of bacterial kingdom were positively associated with pathways of purine metabolism and quorum sensing. Counterintuitively, the bacterial biomarkers E. hormaechei and Blautia sp. YL58, two of the butyrate-producing species, were negatively associated with butanoate metabolism. Interestingly, one of the most important fungal biomarkers, R. irregularis, and bacterial biomarker V. atypica displayed rather distinct patterns from other species-level biomarkers and were negatively correlated with most differential functional pathways.
As described above, the abundances of key genes in these pathways displayed consistent alterations, such as decreased abundances of two-component system luxU, fusK in quorum sensing pathway, ureC, purL in purine metabolism and increased abundances of atoD, gctB, bdhAB, phbB and OXCT in butanoate metabolism. Further, we validated these genes using qRT-PCR on our newly collected samples (CHN2 cohort, Data S12). Consistent with metagenomic analysis, genes of butanoate metabolism were enriched in adenoma samples, such as bdhB and gctB (, Fig. S9). Conversely, genes of quorum sensing (fusK) and purine metabolism (ureC, purL) were decreased in adenomas (, Fig. S9). Notably, three of the identified SNV biomarkers, SNV 1,069,713 of R. bicirculans, SNV 2,604,473 of F. prausnitzii (61481), and SNV 222,146 of B. vulgatus were located in genes of purine metabolism, such as SNV 1,069,713 in the differential gene of purL (Data S8). Taken together, these analyses revealed the functional connections among the multimodal microbial signatures.
Figure 6. Cross-modality associations among the microbial signatures. (a) Multi-kingdom co-abundance networks in adenoma and control samples. Colors of nodes indicate different kingdoms: archaea (red), bacteria (yellow), fungi (green) and viruses (blue). Only correlations with P values <.05 and absolute correlation coefficients >.5 are included in the networks with peach lines for positive correlations and blue lines for negative correlations. (b) HAllA results showing associations between differential pathways and multi-kingdom species biomarkers. Significant associations between pathways and species were plotted (P < .05). Correlation coefficients are coded in color: red and blue indicate positive and negative correlations, respectively. Only P values <.05 are shown in the cells. (c) qPCR results showing the expression level of key genes in purine metabolism, butanoate metabolism, and quorum sensing. P values were from two-sided Wilcoxon rank-sum tests.
Discussion
A major and prevalent challenge in the current microbial research is the considerable heterogeneity among different cohorts that obscure our understanding of the true associations between microbiota and disease. The heterogeneity comes from various biological factors and inconsistent standards for metagenomic data generation and processing. Therefore, several pioneer studies and ours identified core microbial signatures related to specific diseases by integrated analyses against multiple metagenomic sequencing cohorts.Citation10,Citation13,Citation21,Citation26 Here, we performed an integrated multi-cohort analysis to test for overall universal microbial-disease associations that can transcend potential biological and technical confounders. This integrated analysis provided a comprehensive multimodal view of adenoma-associated microbial signatures, including microbial multi-kingdom compositions, functional profiles and microbial SNVs. We systematically assessed their performances as noninvasive biomarkers for CRC early detection at precancerous adenoma stage. Diagnostic models constructed with multi-kingdom species and genes achieved AUC values of 0.75 and 0.74, respectively. Particularly, fungal species showed superior distinguishing capabilities compared with species from other kingdoms. Meanwhile, the SNV-based diagnostic model displayed the highest accuracy (AUC = 0.89) in distinguishing adenoma from control, the sensitivity and specificity of which were validated with three external adenoma cohorts. In addition, altered gene abundances in quorum sensing, purine and butanoate metabolism were observed in adenoma patients, and were further validated via qRT-PCR.
Previous efforts for microbial early detection of CRC focus on bacterial species. With 16S rRNA gene sequencing data, adenoma-specific bacterial biomarkers achieved an AUC of 0.80.Citation13 However, with WMS data in the current study, the diagnostic model based on bacterial species achieved a relatively low AUC of 0.66 (). Similarly, a WMS study by Thomas et al.Citation10 reported a low AUC with bacterial species. The discrepancy on the diagnosis power of bacteria species between 16S and WMS approaches could be attributed to insufficient coverage of the microbiome by the WMS approach. Recently, there has been an increasing interest in the roles of fungal kingdom in CRC.Citation17,Citation30 We and other researchers have shown that the gut mycobiome displayed promising potentials in the early detection of CRC.Citation20,Citation21 Taking advantage of the multi-kingdom information in WMS data, the current study was able to compare the efficacies of species from different kingdoms for the early screening of CRC. Notably, the diagnostic accuracy of models constructed with fungal species (AUC = 0.71, ) was higher than that with bacteria and other kingdoms. The best-performing species-level model comprising 15 multi-kingdom species displayed superior diagnostic capability with an AUC of 0.75, and a majority of these best-performing features were also from the fungal kingdom, with C. europaea and R. irregularis acting as the most contributing biomarkers. In addition to the prominent diagnostic capabilities of the fungal kingdom, we further investigated its potential roles in the pathogenesis of adenoma and found that fungal species, especially those with diagnostic powers, presented extensive associations with each other and with species from other kingdoms. Further, fungal biomarkers also exhibited significant associations with key functional pathways in the development of colorectal cancer. Therefore, these results highlight the importance of fungal species in CRC early screening, as well as potential fungal involvement in the adenoma pathogenesis.
One remarkable finding in our study is that diagnostic models constructed with microbial SNV biomarkers achieved the highest AUC. Classification models constructed with SNVs from single strains outperformed both multi-kingdom species- and gene-models. Further, the classification model constructed with SNVs from multiple strains achieved the highest accuracy (AUC = 0.89, ). Then, a minimal set of 36 SNVs from 12 strains achieved an AUC of 0.87 with high robustness and specificity for adenoma, which could serve as a cost-effective noninvasive biomarker panel for CRC early screening. Although the bacterial kingdom did not display strong diagnostic ability in the species-level biomarkers, the abundant bacterial species enabled a more in-depth perspective toward the gut microbiome as in the high-resolution SNVsCitation31. The observation that most SNV biomarkers belong to non-differential species, such as F. prausnitzii and E. coli (, Data S8 and S9), further highlights the importance of analyzing the genetic variations and their prominent roles as novel biomarkers for early detection at precancerous stage of CRC. Interestingly, more than half of these SNV biomarkers were synonymous mutations. From the perspective of their feature importance, these dark SNVs demonstrated equivalent, if not superior, contributions to the predictive model compared to non-synonymous mutations. Despite the absence of alteration in encoded amino acids, dark SNVs held great capability in distinguishing adenoma patients from controls. Our study emphasized the significance of dark SNVs as an indispensable modality for diagnostic biomarkers that warrant increased attention. Furthermore, although they were once referred to as silent mutations, recent evidence demonstrates their capacity to impact protein conformation and function by affecting post-transcriptional processing and regulation of RNA.Citation32
Gut microbiome influence host homeostasis in multiple ways,Citation33,Citation34 and the disruption of this harmonious interaction affects the initiation and progression of CRC.Citation1,Citation35,Citation36 Quorum sensing, a way of cell-to-cell communication, plays an important role maintaining the healthy gut microbial state through small molecules, such as autoinducers,Citation37 enabling microbial populations to efficiently synchronize microbial density and behavior with the surrounding environment like multicellular organisms. Here, damaged quorum sensing function in the microbiome of adenoma was observed, consistent with extensively altered intra-kingdom and fungal-bacterial interactions in patients with adenoma, suggesting impaired gut homeostasis (). This hypothesis was further supported by the associations detected between quorum sensing pathway and bacterial- and fungal- biomarker species (), and the decreased representations of two autoinducer receptors, luxU and fusK, in the microbiome of adenoma from both metagenomic analysis and qRT-PCR (). Meanwhile, the purine metabolism was impaired in the microbiome of adenoma patients, with two of the key genes, purL and ureC, exhibiting decreased abundances in adenoma (). Notably, three SNV biomarkers were located in the differential purine metabolism pathway, one of which was in purL, suggesting potential microbiome-driven mechanisms of impaired purine metabolism in the pathogenesis of adenoma. Abnormal purine level has been associated with microbial dysfunctions and cancer progression.Citation38,Citation39 Here our results highlighted several ways that the microbiota of adenoma may impact the purine metabolism. On the other hand, adenoma patients were observed with increased butanoate metabolism capability. This is consistent with our previous observation of increased abundance of butanoate metabolizing genes in CRC patients compared to controls,Citation21 and supports an essential role of butanoate metabolism in the development of CRC.Citation40 This was further supported by the increased abundances of key genes in butanoate metabolism, bdhAB and gctB, via qRT-PCR. F. prausnitzii, one of the most abundant species in human intestines, is a major producer of butanoate,Citation27 and also possesses the most contributing features of the best-performing SNV model (Data S6). Taken together, these specific multimodal alterations related to microbiota metabolism and quorum sensing and their close relationships may illuminate future efforts to unravel the convoluted pathological mechanisms of adenoma and CRC, and provide reasonable explanations for the outstanding performances of the microbial biomarkers in detecting adenoma.
Collectively, we uncover comprehensive adenoma-associated microbial alterations and reveal the outstanding potential of microbial SNVs as a novel noninvasive tool for CRC early screening. In addition, we propose potential pathological mechanisms for adenoma based on the extensive alterations in the multimodal microbial interactions and the associations among the microbial biomarkers of different modalities, and of different kingdoms.
Materials and Methods
Patient recruitment and sample collection
Two in-house cohorts collected in Shanghai, China, were included in this study. First, we collected WMS data from CHN1 cohort, including 40 adenoma patients and 47 healthy controls.Citation41 Besides, fecal samples were collected from CHN2 cohort, which was newly recruited from the Shanghai Tenth People’s Hospital of Tongji University, containing 29 adenoma patients and 30 healthy controls. Written informed consent was obtained from each subject before data and biospecimen collection. Patients were recruited at initial diagnosis with no reception of any treatment before fecal sample collection. Patients with hereditary colorectal syndrome, or with a previous history of colorectal disorder, were excluded. This study was approved by the Ethics Committee of the Shanghai Tenth People’s Hospital of Tongji University (ethical approval No. 20KT863).
Public data collection
To conduct an integrative multi-cohort analysis, we further collected published fecal WMS data of six cohorts consisting adenoma patients and healthy controls covering samples from five different countries. Raw sequencing data of these samples were downloaded from Sequence Read Archive (SRA) and European Nucleotide Archive (ENA) using the following accession IDs: ERP008729 for Feng et al. (AUT cohort),Citation42 ERP005534 for Zeller et al. (FRA cohort),Citation43 SRP136711 for Thomas et al. (ITA cohort),Citation10 DRA006684 and DRA008156 for Yachida et al. (JPN cohort),Citation44 SRP108915 for Hannigan et al. (USA1 cohort),Citation45 and SRP327788 for Avelar-Barragan et al. (USA2 cohort).Citation41 The metadata were manually curated from relevant original publications. Only colorectal adenoma samples and healthy controls were included for downstream integrative analysis, while samples of CRC patients were used to validate the specificity of microbial biomarkers, along with samples from CD and UC patients (SRP129027).
Study design
In total, WMS data of 750 samples of adenoma patients and healthy controls from seven geographically distinct cohorts were included in the metagenomics analysis of this study. To identify and validate global microbial biomarkers across cohorts, 622 samples from four cohorts were set as the discovery dataset, including cohorts AUT, FRA, ITA, and JPN, while cohorts USA1, USA2, and one in-house cohort from China (CHN1) were used as the validation dataset. Meanwhile, samples of CRC, CD and UC patients were used to externally estimate the specifity of microbial biomarkers and classification models against adenoma. Further, newly collected samples from CHN2 cohort were used to perform qRT-PCR validations of key genes.
Sequencing data preprocessing
KneadData (http://huttenhower.sph.harvard.edu/kneaddata, V0.6.0) was used to perform quality control on sequencing data. First, low-quality reads were removed using Trimmomatic (SLIDINGWINDOW:4:20 MINLEN:50 LEADING:3 TRAILING:3). Remaining reads were then mapped to the mammalian genomes (hg38, felCat8, canFam3, mm10, rn6, susScr3, galGal4 and bosTau8; UCSC Genome Browser), 21288 bacterial plasmids (NCBI RefSeq database accessed in January 2020), 3890 complete plastomes (NCBI RefSeq database accessed in January 2020) and 6093 UNiVec sequences (NCBI RefSeq database accessed in January 2020) by bowtie2 (V.2.3.5) to remove sequences of human and laboratory contaminationsCitation46.
Microbial multimodal annotation
Microbial multi-kingdom assignment
A customized reference database comprising 18,756 bacterial, 359 archaeal, 9346 viral reference genomes from the NCBI Refseq database (accessed in January 2020), and 1094 fungal reference genomes from the NCBI Refseq database, FungiDB (http://fungidb.org) and Ensemble (http://fungi.ensembl.org, accessed in January 2020) was built for taxonomic assignment of the sequencing reads. Taxa were assigned to sequencing reads using Kraken2, an improved taxonomic classification system using exact K-mer matches.Citation47 Further, Bracken was used for taxa abundance estimation based on Kraken2 results.Citation48 Read counts of species were converted to relative abundances and only those with relative abundances more than 0.1% in at least 10% of samples and presented in at least three cohorts were subjected to further analysis.
Functional annotation
For microbial functional profiling, high-quality reads were assembled into contigs using Megahit (V1.2.9) and only contigs longer than 500 bp were selected for downstream analysis. Microbial genes were predicted by Prodigal (V2.6.3) via the metagenome mode (−p meta). Then, a non-redundant microbial gene reference was constructed with CD-HIT using a sequence identity cutoff of 0.95, and a minimum coverage cutoff of 0.9 for the shorter sequences. The reference was annotated using EggNOG mapper (V2.0.1) based on EggNOG orthology. CoverM (https://github.com/wwood/CoverM, V4.0) was used to estimate gene abundances by mapping high quality reads to reference sequences and to calculate the coverage of genes in the original contigs. The relative abundances of KEGG orthologous (KO) groups or pathways were calculated by summing the relative abundances of genes annotated to the same KOs or pathways.
SNV calling
Metagenomic Intra-Species Diversity Analysis System (MIDAS, V1.3.2) was used to perform microbial SNV annotationCitation49. First, to ascertain the analytical robustness while guaranteeing an adequate number of features for subsequent analysis, 28 strains were selected based on their coverage and prevalence. Only those with sufficient read depth of marker genes (>3X as default parameter in MIDAS) in at least 10% of all samples were used to construct a customized reference database. A local bowtie2 database was then constructed that contains one representative genome per strain. To perform SNV calling, high-quality WMS reads were aligned to the database using Bowtie2, and the read depth and observed alleles at each position were quantified. Subsequently, the SNV profiles of each sample were merged, and only bi-allelic positions were chosen. Other parameters were in accordance with the preset option “—core_snps”. For feature selection, model construction, and other analyses in this study, SNV frequencies per genomic site of each sample were used, and samples that do not contain the designated SNV were assigned a value of zero.
Integrated analysis of microbiome-derived differential signatures
xMarkerFinder, an integrated workflow designed to address the cross-cohort heterogeneity of human microbiome, was employed in this study.Citation50 This workflow mainly comprises differential signature identification, model construction, model validation, and biomarker interpretation, as detailed in the following paragraphs.
Cross-cohort differential signature identification
Firstly, MMUPHin (V1.4.2) was used for the identification of signatures that are differential across cohorts with respect to combined phenotypes.Citation51,Citation52 Respective regression analyses in individual cohorts were performed and then aggregated with established fixed effect models to test for consistent differential signatures between adenoma and control samples with “cohort” set as the main batch and demographic indices, including gender, age and BMI, as covariates. Signatures with P values <.05 were identified as differential signatures and used as input for downstream feature selection procedure.
Feature selection
Based on multimodal differential signatures, Triple-E, a three-step feature selection procedure implemented in xMarkerFinder, was employed to identify candidate biomarkers. The first step was feature effectiveness evaluation, aiming to select individual features with discriminative power (AUC >0.5) as effective features. Next, collinear feature exclusion was performed to exclude highly correlated features and features with absolute values of correlation coefficient less than 0.7 were considered as uncorrelated-effective features and selected for the next step, recursive feature elimination for the identification of the panel of optimal biomarkers with the highest predictive capability. This is achieved by repeat modeling starting with all features and recursively removing the weakest feature for model construction per loop to obtain the best panel with the highest cross-validation AUC value.
Model construction and optimization
The optimal biomarkers were then used to construct RF models with stratified five-fold cross-validation to avoid overfitting. Further, to optimize the diagnostic RF models, hyperparameters, including the number of estimator trees, the maximum depth of the trees, the numbers of features per tree, and the maximum samples were tuned using Bayesian-optimization (V1.2.0) package. Finally, with the selected optimal biomarkers and the best combination of hyperparameters, the best-performing RF models were constructed. For further evaluating the performance of the model, MCC is used, and the normalized MCC is presented which is defined as (MCC +1)/2 with MCC = 0.5 as the average value of the coin tossing classifier.Citation53
SNV biomarker selection and model construction
For single-strain SNV models, differential SNVs from each single strain were used for feature selection by Triple-E and the selected features (SNV frequencies of each genomic site) were then used to construct respective diagnostic models.
For multi-strain SNV model, the selected best features from each single-strain models were pooled together as the input of the Triple-E feature selection process, and optimal multi-strain biomarkers were then selected to construct the best-performing SNV model. Further, to enhance the cost-effectiveness in clinical application of the SNV biomarkers, we conducted a recursive analysis. Multi-strain biomarkers were sorted by their respective contributions to the model, which were assessed by permutation feature importance. With each iteration, the least important SNV feature was removed, thereby generating a new model, until only one feature remained. Based on feature number and corresponding model performance, the best and minimal panel of SNV biomarkers were established.
Evaluation of the biomarkers’ robustness and generalization
To test the robustness and generalization of identified optimal biomarkers among geographically distinct cohorts, we performed cohort-to-cohort and LOCO validation as described in our previous study.Citation13 For cohort-to-cohort validation, diagnostic models were trained on the profile of one single cohort and validated on the profile of each of the remaining cohorts, respectively. For LOCO validation, one single cohort was set as the validation dataset, while all other cohorts were pooled together as the discovery dataset. Further, four independent cohorts were used to externally validate the robustness of identified optimal biomarkers, as well as the optimized SNV diagnostic model.
The specificity of adenoma predictive biomarkers
To avoid false positives in clinical diagnosis, we evaluated the disease specificity of the best panel of microbial biomarkers for adenoma by examination of their performances in discriminating non-adenoma diseases from controls. These non-adenoma diseases included CRC (386 cases and 439 controls), CD (68 cases and 34 controls), and UC (53 cases and 34 controls).
Co-abundance analysis of differential multi-kingdom species
To investigate the associations among differential multi-kingdom species, we employed SparCC,Citation54 a widely used approach for estimating correlations with compositional data, to construct the microbial network in different disease status. Associations among differential multi-kingdom species were inferred with 50 iterations, after which the statistical significance was calculated with a permutation-based approach. The significance of each correlation is contingent upon the frequency of observing a more extensive correlation when compared to 1000 random permutations of the original input data. Correlations with |r| >.5 and P value < .05 were regarded as moderate correlations and were included in downstream analysis. Network was visualized with Gephi (V0.9.2).
Associations between microbial species and function
To further explore the potential associations between multimodal signatures, HAllA (V 0.8.18), a computational method to find multi-resolution associations in high-dimensional heterogeneous datasets, was applied to evaluate the associations between differential pathways and multi-kingdom species.Citation55 First, paired high-dimensional microbial data were discretized to a unified representation and then clustered separately to generate a pair of data hierarchies. Spearman correlation coefficients were computed between features across the two input datasets, and the statistical significance of individual associations were determined by permutation testing with 1000 permutations. Correlations with adjusted P values <.05 were preserved as significant correlations.
qRT-PCR validation
To quantify the abundances of key genes, qRT-PCR analysis was performed in triplicates on newly collected samples of CHN2 cohort (29 adenomas and 30 controls). The genomic DNA was extracted with the TIANamp Stool DNA Kit (Cat# 4992205, TIANGEN) according to the manufacturer’s instructions. We used the primers in Data S13 for candidate genes, and standard primers F515 and R806 for 16S rRNA. To perform the qRT-PCR, the final primer concentration was diluted to 0.2 μM including 10 ng of genomic DNA in a 10 μL final reaction volume with the SYBR Green qPCR Mix (Thermo Fisher Scientific). The adopted qRT-PCR program was as follows: pre-denaturation at 95°C for 10 min; denaturation at 95°C for 15 s and annealing at 60°C for 60 s for 40 cycles; followed by a melting curve analysis. The qRT-PCR result was quantitated by calculate 2−ΔΔCt values between candidate genes and 16S Ct values as the relative expression level.
Statistical analysis
Considering the sparsity of microbial data, nonparametric Wilcoxon tests and a threshold of 0.05 in P values were used unless stated otherwise. PERMANOVA test was performed to quantify the contributions of the subjects’ physical variables to multimodal microbial profiles using R (V4.0.5) “vegan” (V2.5.7) package with 999 permutations.Citation56 Quantitative variables were transformed into categorical values for PERMANOVA analysis. Age was divided into quantiles, while BMI was transformed into three categories: <25 kg/m2 (lean), 25–30 kg/m2 (overweight), and >30 kg/m2 (obese). Alpha diversity metrics, including Shannon and Simpson Index, and beta diversity based on Bray–Curtis distance of taxonomic and functional profiles were calculated. Differences between groups were then estimated with MaAsLin 2 (V1.4.0) and PERMANOVA, respectively.Citation57 All statistical and bioinformatics analyses were implemented using R (V 4.0.5) and Python (V 3.8.5).
Code availability
The codes and scripts for the bioinformatics analysis in this paper are available at https://github.com/tjcadd2020/Adenoma. xMarkerFinder, the core workflow used in this paper, is provided at https://github.com/tjcadd2020/xMarkerFinder.
Abbreviations
AUC: area under the ROC curve; BMI: body mass index; CD: Crohn’s disease; CDS: coding sequence; CRC: colorectal cancer; CTC: circulating tumor cell; ctDNA: circulating tumor DNA; IBD: inflammatory bowel disease; IGR: intergenic region; KO: KEGG orthology; MCC: Matthews correlation coefficient; MIDAS: Metagenomic Intra-Species Diversity Analysis System; MMUPhin: Meta-analysis Methods with a Uniform Pipeline for Heterogeneity in Microbiome Studies; NAFLD: nonalcoholic fatty liver disease; PCoA: principal coordinate analysis; PERMANOVA: permutational multivariate analysis of variance; qRT-PCR: quantitative real-time PCR; RF: random forest; SNV: single-nucleotide variant; UC: ulcerative colitis; WMS: whole metagenome sequencing.
Author contributions
NJ, RZ, ZL and LZ conceived and designed the study. WG, SG, DW, and NJ performed the public data collection. WG and NJ conducted the microbiome analysis. WG performed the bioinformatics analysis and model construction. XG, RS and ZF recruited the participants, collected the fecal sample and performed the experimental validation. WG and NJ drafted the manuscript. WG, XG, LZ, SG, RS, ZF, DW, ZL, RZ and NJ reviewed and edited the manuscript. All authors read and approved the final manuscript.
Supplemental Material
Download MS Excel (3.9 MB)Supplemental Material
Download MS Word (2.7 MB)Acknowledgments
The authors would like to thank all the researchers for generously sharing their sequencing data included in this study. We acknowledge funding from the National Natural Science Foundation of China (82170542 to RZ, 92251307 to RZ, 82000536 to NJ, 91942312 to ZL, 81630017 to ZL, 32200529 to DW), the National Key Research and Development Program of China (2021YFF0703700/2021YFF0703702 to RZ), and the Guangdong Province “Pearl River Talent Plan” Innovation and Entrepreneurship Team Project (2019ZT08Y464 to LZ). The funders had no role in study design, data collection and analysis, decision to publish, or preparation of the manuscript.
Disclosure statement
No potential conflict of interest was reported by the author(s).
Data availability statement
All processed data for this work are available at NODE with project ID OEP003766. Particularly, comprehensive multi-strain microbial SNV profiles are provided for future analysis. Raw data of our in-house metagenomic sequencing cohort are available from the Sequence Read Archive (SRA) with study ID: SRP308947. Other metagenomic sequencing data used in this manuscript are available from SRA with study IDs: ERP008729, ERP005534, DRA006684, DRA008156, SRP136711, SRP108915, SRP327788, and SRP129027.
Supplementary material
Supplemental data for this article can be accessed online at https://doi.org/10.1080/19490976.2023.2245562
Correction Statement
This article has been corrected with minor changes. These changes do not impact the academic content of the article.
Additional information
Funding
References
- Wong SH, Yu J. 2019. Gut microbiota in colorectal cancer: mechanisms of action and clinical applications. Nat Rev Gastroenterol Hepatol. 16(11):690–22. doi: 10.1038/s41575-019-0209-8.
- Hyuna Sung JF, Siegel RL, Laversanne M, Soerjomataram I, Jemal A, Bray F, Bray F. 2021. Global cancer statistics 2020: GLOBOCAN estimates of incidence and mortality worldwide for 36 cancers in 185 countries. CA Cancer J Clin. 71(3):209–249. doi: 10.3322/caac.21660.
- Liang JQ, Li T, Nakatsu G, Chen Y-X, Yau TO, Chu E, Wong S, Szeto CH, Ng SC, Chan FKL, et al. 2020. A novel faecal Lachnoclostridium marker for the non-invasive diagnosis of colorectal adenoma and cancer. Gut. 69(7):1248–1257. doi: 10.1136/gutjnl-2019-318532.
- Shaukat A, Levin TR. 2022. Current and future colorectal cancer screening strategies. Nat Rev Gastro Hepat. 19(8):521–531. doi: 10.1038/s41575-022-00612-y.
- Liang L, Liang Y, Li K, Qin P, Lin G, Li Y, Xu H, Wang S, Jing Q, Liang B, et al. 2022. A risk-prediction score for colorectal lesions on 12,628 participants at high risk of colorectal cancer. Gastroenterol Rep (Oxf). 10:goac002. doi: 10.1093/gastro/goac002.
- Dasari A, Morris VK, Allegra CJ, Atreya C, Benson III AB, Boland P, Chung K, Copur MS, Corcoran RB, Deming DA, Dwyer A. 2020. ctDNA applications and integration in colorectal cancer: an NCI colon and rectal-anal task forces whitepaper. Nat Rev Clin Oncol. 17:757–770. doi: 10.1038/s41571-020-0392-0.
- Xiao Y, Zhong J, Zhong B, Huang J, Jiang L, Jiang Y, Yuan J, Sun J, Dai L, Yang C, et al. 2020. Exosomes as potential sources of biomarkers in colorectal cancer. Cancer Lett. 476:13–22. doi: 10.1016/j.canlet.2020.01.033.
- Wang P, Liu P, Glissen Brown JR, Berzin TM, Zhou G, Lei S, Liu X, Li L, Xiao X. 2020. Lower adenoma miss rate of computer-aided detection-assisted colonoscopy vs routine white-light colonoscopy in a prospective tandem study. Gastroenterology. 159:1252–1261.e1255. doi: 10.1053/j.gastro.2020.06.023.
- Ternes D, Karta J, Tsenkova M, Wilmes P, Haan S, Letellier E. 2020. Microbiome in colorectal cancer: how to get from meta-omics to mechanism? Trends Microbiol. 28:401–423. doi: 10.1016/j.tim.2020.01.001.
- Thomas AM, Manghi P, Asnicar F, Pasolli E, Armanini F, Zolfo M, Beghini F, Manara S, Karcher N, Pozzi C, et al. 2019. Metagenomic analysis of colorectal cancer datasets identifies cross-cohort microbial diagnostic signatures and a link with choline degradation. Nat Med. 25(4):667–678. doi: 10.1038/s41591-019-0405-7.
- Mo Z, Huang P, Yang C, Xiao S, Zhang G, Ling F, Li L. 2020. Meta-analysis of 16S rRNA microbial data identified distinctive and predictive microbiota dysbiosis in colorectal carcinoma adjacent tissue. mSystems. 5:e00138–00120. doi: 10.1128/mSystems.00138-20.
- Cullin N, Azevedo Antunes C, Straussman R, Stein-Thoeringer CK, Elinav E. 2021. Microbiome and cancer. Cancer Cell. 39(10):1317–1341. doi: 10.1016/j.ccell.2021.08.006.
- Wu Y, Jiao N, Zhu R, Zhang Y, Wu D, Wang A-J, Fang S, Tao L, Li Y, Cheng S, et al. 2021. Identification of microbial markers across populations in early detection of colorectal cancer. Nat Commun. 12(1):3063. doi: 10.1038/s41467-021-23265-y.
- Lang S, Demir M, Martin A, Jiang L, Zhang X, Duan Y, Gao B, Wisplinghoff H, Kasper P, Roderburg C, et al. 2020. Intestinal virome signature associated with severity of nonalcoholic fatty liver disease. Gastroenterology. 159(5):1839–1852. doi: 10.1053/j.gastro.2020.07.005.
- Zuo T, Lu X-J, Zhang Y, Cheung CP, Lam S, Zhang F, Tang W, Ching JYL, Zhao R, Chan PKS, et al. 2019. Gut mucosal virome alterations in ulcerative colitis. Gut. 68(7):1169–1179. doi: 10.1136/gutjnl-2018-318131.
- Gao S, Gao X, Zhu R, Wu D, Feng Z, Jiao N, Sun R, Gao W, He Q, Liu Z, et al. 2023. Microbial genes outperform species and SNVs as diagnostic markers for Crohn’s disease on multicohort fecal metagenomes empowered by artificial intelligence. Gut Microbes. 15(1):2221428. doi: 10.1080/19490976.2023.2221428.
- Coker OO, Nakatsu G, Dai RZ, Wu WKK, Wong SH, Ng SC, Chan FKL, Sung JJY, Yu J. 2019. Enteric fungal microbiota dysbiosis and ecological alterations in colorectal cancer. Gut. 68:654–662. doi: 10.1136/gutjnl-2018-317178.
- Coker OO, Wu WKK, Wong SH, Sung JJY, Yu J. 2020. Altered gut archaea composition and interaction with bacteria are associated with colorectal cancer. Gastroenterology. 159:1459–1470.e1455. doi: 10.1053/j.gastro.2020.06.042.
- Chen F, Li S, Guo R, Song F, Zhang Y, Wang X, Huo X, Lv Q, Ullah H, Wang G, et al. 2022. Meta-analysis of fecal viromes demonstrates high diagnostic potential of the gut viral signatures for colorectal cancer and adenoma risk assessment. J Adv Res. 103–114. doi: 10.1016/j.jare.2022.09.012.
- Lin Y, Lau HCH, Liu Y, Kang X, Wang Y, Ting NLN, Kwong TNY, Han J, Liu W, Liu C, et al. 2022. Altered mycobiota signatures and enriched pathogenic aspergillus rambellii are associated with colorectal cancer based on multicohort fecal metagenomic analyses. Gastroenterology. 163(4):908–921. doi: 10.1053/j.gastro.2022.06.038.
- Liu N-N, Jiao N, Tan J-C, Wang Z, Wu D, Wang A-J, Chen J, Tao L, Zhou C, Fang W, et al. 2022. Multi-kingdom microbiota analyses identify bacterial–fungal interactions and biomarkers of colorectal cancer across cohorts. Nat Microbiol. 7:238–250. doi: 10.1038/s41564-021-01030-7.
- Tierney BT, Tan Y, Kostic AD, Patel CJ. 2021. Gene-level metagenomic architectures across diseases yield high-resolution microbiome diagnostic indicators. Nat Commun. 12(1):2907. doi: 10.1038/s41467-021-23029-8.
- Heintz-Buschart A, Wilmes P. 2018. Human gut microbiome: function matters. Trends Microbiol. 26(7):563–574. doi: 10.1016/j.tim.2017.11.002.
- Ma C, Chen K, Wang Y, Cen C, Zhai Q, Zhang J. 2021. Establishing a novel colorectal cancer predictive model based on unique gut microbial single nucleotide variant markers. Gut Microbes. 13:1–6. doi: 10.1080/19490976.2020.1869505.
- Zhu Q, Hou Q, Huang S, Ou Q, Huo D, Vázquez-Baeza Y, Cen C, Cantu V, Estaki M, Chang H, et al. 2021. Compositional and genetic alterations in Graves’ disease gut microbiome reveal specific diagnostic biomarkers. ISME J. 15(11):3399–3411. doi: 10.1038/s41396-021-01016-7.
- Wirbel J, Pyl PT, Kartal E, Zych K, Kashani A, Milanese A, Fleck JS, Voigt AY, Palleja A, Ponnudurai R, et al. 2019. Meta-analysis of fecal metagenomes reveals global microbial signatures that are specific for colorectal cancer. Nat Med. 25(4):679–689. doi: 10.1038/s41591-019-0406-6.
- Lopez-Siles M, Duncan SH, Garcia-Gil LJ, Martinez-Medina M. 2017. Faecalibacterium prausnitzii: from microbiology to diagnostics and prognostics. ISME J. 11(4):841–852. doi: 10.1038/ismej.2016.176.
- Kong C, Liang L, Liu G, Du L, Yang Y, Liu J, Shi D, Li X, Ma Y. 2022. Integrated metagenomic and metabolomic analysis reveals distinct gut-microbiome-derived phenotypes in early-onset colorectal cancer. Gut. 72:1129–1142. doi: 10.1136/gutjnl-2022-327156.
- Yang Y, Du L, Shi D, Kong C, Liu J, Liu G, Li X, Ma Y. 2021. Dysbiosis of human gut microbiome in young-onset colorectal cancer. Nat Commun. 12. doi: 10.1038/s41467-021-27112-y.
- Conche C, Greten FR. 2018. Fungi enter the stage of colon carcinogenesis. Immunity. 49(3):384–386. doi: 10.1016/j.immuni.2018.09.002.
- Almeida A, Nayfach S, Boland M, Strozzi F, Beracochea M, Shi ZJ, Pollard KS, Sakharova E, Parks DH, Hugenholtz P, et al. 2021. A unified catalog of 204,938 reference genomes from the human gut microbiome. Nat Biotechnol. 39(1):105–114. doi: 10.1038/s41587-020-0603-3.
- Sauna ZE, Kimchi-Sarfaty C. 2011. Understanding the contribution of synonymous mutations to human disease. Nat Rev Genet. 12(10):683–691. doi: 10.1038/nrg3051.
- Jiao N, Baker SS, Chapa-Rodriguez A, Liu W, Nugent CA, Tsompana M, Mastrandrea L, Buck MJ, Baker RD, Genco RJ, et al. 2018. Suppressed hepatic bile acid signalling despite elevated production of primary and secondary bile acids in NAFLD. Gut. 67(10):1881–1891. doi: 10.1136/gutjnl-2017-314307.
- Fan Y, Pedersen O. 2021. Gut microbiota in human metabolic health and disease. Nat Rev Microbiol. 19(1):55–71. doi: 10.1038/s41579-020-0433-9.
- Wong CC, Yu J. 2023. Gut microbiota in colorectal cancer development and therapy. Nat Rev Clin Oncol. 20(7):429–452. doi: 10.1038/s41571-023-00766-x.
- Okumura S, Konishi Y, Narukawa M, Sugiura Y, Yoshimoto S, Arai Y, Sato S, Yoshida Y, Tsuji S, Uemura K, et al. 2021. Gut bacteria identified in colorectal cancer patients promote tumourigenesis via butyrate secretion. Nat Commun. 12(1):5674. doi: 10.1038/s41467-021-25965-x.
- Whiteley M, Diggle SP, Greenberg EP. 2017. Progress in and promise of bacterial quorum sensing research. Nature. 551(7680):313–320. doi: 10.1038/nature24624.
- Goncheva MI, Flannagan RS, Sterling BE, Laakso HA, Friedrich NC, Kaiser JC, Watson DW, Wilson CH, Sheldon JR, McGavin MJ, et al. 2019. Stress-induced inactivation of the Staphylococcus aureus purine biosynthesis repressor leads to hypervirulence. Nat Commun. 10(1):775. doi: 10.1038/s41467-019-08724-x.
- Satoh K, Yachida S, Sugimoto M, Oshima M, Nakagawa T, Akamoto S, Tabata S, Saitoh K, Kato K, Sato S, Igarashi K. 2017. Global metabolic reprogramming of colorectal cancer occurs at adenoma stage and is induced by MYC. Proceedings of the National Academy of Sciences 114, E7697–E7706.
- Tjalsma H, Boleij A, Marchesi JR, Dutilh BE 2012. A bacterial driver-passenger model for colorectal cancer: beyond the usual suspects. Nat Rev Microbiol. 10:575–582. doi: 10.1038/nrmicro2819.
- Avelar-Barragan J, DeDecker L, Lu ZN, Coppedge B, Karnes WE, Whiteson KL. 2022. Distinct colon mucosa microbiomes associated with tubular adenomas and serrated polyps. NPJ Biofilms Microbiomes. 8:69. doi: 10.1038/s41522-022-00328-6.
- Feng Q, Liang S, Jia H, Stadlmayr A, Tang L, Lan Z, Zhang D, Xia H, Xu X, Jie Z, et al. 2015. Gut microbiome development along the colorectal adenoma–carcinoma sequence. Nat Commun. 6:6528. doi: 10.1038/ncomms7528.
- Zeller G, Tap J, Voigt AY, Sunagawa S, Kultima JR, Costea PI, Amiot A, Böhm J, Brunetti F, Habermann N, et al. 2014. Potential of fecal microbiota for early‐stage detection of colorectal cancer. Mol Syst Biol. 10(11):766. doi: 10.15252/msb.20145645.
- Yachida S, Mizutani S, Shiroma H, Shiba S, Nakajima T, Sakamoto T, Watanabe H, Masuda K, Nishimoto Y, Kubo M, et al. 2019. Metagenomic and metabolomic analyses reveal distinct stage-specific phenotypes of the gut microbiota in colorectal cancer. Nat Med. 25(6):968–976. doi: 10.1038/s41591-019-0458-7.
- Hannigan GD, Duhaime MB, Ruffin MT, Koumpouras CC, Schloss PD. 2018. Diagnostic potential and interactive dynamics of the colorectal cancer virome. mBio. 9:e02248–02218. doi: 10.1128/mBio.02248-18.
- Langmead B, Salzberg SL. 2012. Fast gapped-read alignment with Bowtie 2. Nat Methods. 9(4):357–359. doi: 10.1038/nmeth.1923.
- Wood DE, Lu J, Langmead B. 2019. Improved metagenomic analysis with Kraken 2. Genome Biol. 20(1):257. doi: 10.1186/s13059-019-1891-0.
- Lu J, Breitwieser FP, Thielen P, Salzberg SL. 2017. Bracken: estimating species abundance in metagenomics data. PeerJ Comput Sci. 3:e104. doi: 10.7717/peerj-cs.104.
- Nayfach S, Rodriguez-Mueller B, Garud N, Pollard KS. 2016. An integrated metagenomics pipeline for strain profiling reveals novel patterns of bacterial transmission and biogeography. Genome Res. 26(11):1612–1625. doi: 10.1101/gr.201863.115.
- Gao W, Chen W, Yin W, Zhu X, Gao S, Liu L, Wu D, Zhu R, Jiao N. 2022. Identification and validation of microbial biomarkers from cross-cohort datasets using xMarkerfinder.PROTOCOL (Version 1) Available At Protocol Exchange. doi: 10.21203/rs.3.pex-1984/v1.
- Ma S. 2021. Mmuphin: meta-analysis methods with uniform pipeline for heterogeneity in microbiome studies. R package version 1.4.2
- Ma S, Shungin D, Mallick H, Schirmer M, Nguyen LH, Kolde R, Franzosa E, Vlamakis H, Xavier R, Huttenhower C, et al. 2022. Population structure discovery in meta-analyzed microbial communities and inflammatory bowel disease using MMUPHin. Genome Biol. 23(1):208. doi: 10.1186/s13059-022-02753-4.
- Chicco D, Jurman G. 2020. The advantages of the Matthews correlation coefficient (MCC) over F1 score and accuracy in binary classification evaluation. BMC Genom. 21(1):6. doi: 10.1186/s12864-019-6413-7.
- Friedman J, Alm EJ, von Mering C. 2012. Inferring correlation networks from genomic survey data. PLoS Comput Biol. 8(9):e1002687. doi: 10.1371/journal.pcbi.1002687.
- Ghazi AR, Sucipto K, Rahnavard A, Franzosa EA, McIver LJ, Lloyd-Price J, Schwager E, Weingart G, Moon YS, Morgan XC, Waldron L, Huttenhower C. High-sensitivity pattern discovery in large, paired multiomic datasets. Bioinformatics. 2022. Jun 24;38(Suppl 1):i378-i385. doi: 10.1093/bioinformatics/btac232
- Oksanen J, Kindt R, Legendre P, O’Hara B, Stevens MH, Oksanen MJ, Suggests MA. 2020. Vegan: Community Ecology Package. R package version 2.5-7.
- Mallick H, Rahnavard A, McIver L. 2020. Maaslin2. R package version 1.4.0.