
ABSTRACT
This paper addresses the publication of results from national tests in primary and lower secondary schools by Norwegian national authorities. Test results must be made available to the public, and are published in an aggregated format at school, municipal, county and national levels on a public website. These aggregated test results are meant to provide information on school quality for local government, as well as for school development. However, how the data are presented influences their usability, and this is further affected by the fact that many municipalities and the majority of schools are quite small. Hence, in many instances the information that can be retrieved from aggregated test results at school or municipal level are of little or no value to the users. When presenting the aggregated data to the public, the government should clearly state that the data might not be useful for small schools or small municipalities with regard to analysing their own performance and for quality enhancement.
Introduction
National tests were introduced in Norway in 2004 as one of several tools and indicators forming a national system for quality assurance in education. These tests are run in September and October each year for 5th and 8th graders, and focus on core academic skills – namely numeracy, literacy and English. The main purpose of national tests is to provide educational authorities at local and national levels with information on general student competency at the end of the 4th and 7th years of compulsory schooling. However, in justifying the implementation of tests it has also been argued that the tests can provide valuable information for principals, teachers and students.
The quality assurance system combines information on students’ learning results with data gathered through various surveys, international comparative tests, school inspections, and guidance material provided by governmental authorities (Allerup, Velibor, Kvåle, Langfeldt, & Skov, Citation2009; Skedsmo, Citation2011a). A website, Skoleporten.no, gathers and dispatches this information to national and local school authorities. The media and the public have access to a certain amount of anonymised data through the same website.
The establishment of a national system for quality assessment in 2004 can be said to represent a shift in Norwegian school governance. Historically, student results have not been regarded as a major indicator of school quality in Norway. Skedsmo (Citation2011a, p. 77) pointed out how the expectations of certain results become implicit goals for schools’ quality, reinforcing the need for countervailing measures to be taken.
For Norwegian students at primary school, national tests in reading, numeracy and English are the only standardised indicators of learning results until these students complete their final exams in the 10th grade. The tests were met with apprehension at first, then with increasing interest, mainly from municipal stakeholders. However, some municipalities and many teachers still experience difficulties in using the test for improving school quality (Seland, Hovdhaugen, & Vibe, Citation2015, p. 55).
Research question
The research question this paper addresses pertains to the usability of national test results for Norwegian municipalities: to what extent is the information made available to school owners and principals by the official website useful to them? Hence, we are asking whether there is a discrepancy between the assumed usability of the tests for school owners and principals and their actual usefulness, especially for small municipalities. In order to investigate the usability of aggregated test results, the paper examines and discusses how the tests for 5th graders have been presented, and addresses the general challenges linked to making aggregated test results available to the public.
Context: municipal stakeholders in Norwegian educational policy
Public schools dominate the Norwegian educational system, as more than 92 per cent of schools are publicly owned and 96 per cent of the student population attends a public school (Statistics Norway, Citation2015a). Historically, the responsibility for primary education has been with municipalities, and this has been institutionalised through national–municipal government partnerships. These partnerships underpin the general development of the Norwegian welfare state, and have thus contributed to creating the division of responsibility between national and local levels of governance that is still visible today. As the right to vote was extended to new demographic strata at the turn of the 19th century, the municipal political body, along with a multitude of volunteer associations, spurred political mobilisation for democratic inclusion and societal change. Coupled with a relatively low level of economic inequality, this mobilisation has been referred to as one of the main reasons behind the sense of trust and shared interest between national and local political institutions that characterises the Nordic countries (Lien, Lidén, & Vike, Citation2001, p. 23; Vike, Citation2004, p. 22). On this basis, primary education was developed gradually, along with other welfare services, which were all locally administered but paid for by tax revenue provided by the national government (Sejersted, Citation2005; Telhaug & Mediås, Citation2003). The government has also continued to make decisions on the syllabus, which is held to be a guarantee of quality, as well as equality, within the educational system (Skedsmo, Citation2011a).
From the beginning of the 1980s, a shift in administrative trends began to affect the relationship between the government and the municipality as a general provider of welfare services. Structurally and economically, these trends included elements of new public management, which can be seen as an international trend within public administration (Klausen, Citation2011). As a result, the government’s main objective became exercising control over public administration by setting national policy goals, while the municipalities were left to carry out assignments without further detailed intervention from the national government. National rights-based welfare legislation and budget control came to be used as a means to decentralise responsibility from the government to municipalities, and also as a way for the government to continue to maintain some control over the more decentralised municipalities (Vike, Citation2004, p. 28).
Within this system of decentralisation, the democratically elected Norwegian municipal bodies are termed owners of local public welfare enterprise and service, including primary and lower secondary schools (Paulsen & Høyer, Citation2016). Following the decentralisation pattern, most of the municipal school owners delegate responsibility for local school management and activity to school leaders, i.e. principals are made co-responsible and accountable for the municipal budget.
National tests as tools for quality assurance
These structural and administrative changes in Norwegian education culminated in the educational reform termed The Knowledge Promotion in 2006. The reform also included measures to develop and strengthen students’ learning results through a new curriculum focusing on core academic skills and teachers’ assessment practices (Aasen et al., Citation2012; Møller, Prøitz, Rye, & Aasen, Citation2013). A national system of quality assurance for education was launched as part of the reform (Allerup et al., Citation2009; Elstad, Citation2009, NOU Citation2002, p. 10). Prior to this, Norwegian authorities lacked systematic data at the school level, including student results (Utdanningsdirektoratet, Citation2011, p. 27). The quality assurance system was implemented in order to secure an overview of the level of student achievement, and to yield information on institutional performance, which in turn should be used to enhance student performance (Skedsmo, Citation2011b, p. 11).
Skedsmo (Citation2011a, p. 76, Citation2011b, p. 5) referred to the establishment of a national quality assurance system as a significant shift in the management of Norwegian education. In accordance with the decentralised administrative system described above, student results serve as one indicator of school quality, created by the united efforts of teachers, school leaders and municipal school owners.
A heated debate followed the introduction of national tests in Norway, and the debate took on several problematic aspects linked to such tests. The accountability aspects associated with the tests challenged what teachers saw as their main task and professional values (Mausethagen, Citation2013a, p. 140). In addition, the issue of curriculum and assessment standards embedded within the tests had been unresolved between Norwegian authorities and the teachers’ union for many years (Tveit, Citation2013). Media rankings of school quality following the publication of national test results proved highly problematic for teachers and school leaders in schools at which students performed relatively poorly (Elstad, Citation2009). Following the debate, national tests were put on hold (Lie, Hopfenbeck, Ibsen, & Turmo, Citation2005), and were then reintroduced as tests from 2007 in reading, numeracy and English for students starting years 5, 8 and 9 of compulsory schooling.Footnote1 After being in place for more than five years, the tests appear to be more established among teachers and within the local school organisation, and there is now less debate (Seland, Vibe, & Hovdhaugen, Citation2013).
Municipal governance in a low stakes accountability regime
Throughout the US, Europe and several Asian countries, accountability can be seen as the dominant political and administrative tool for enhancing school quality and student performance (Mausethagen, Citation2013b, p. 18). In these countries, accountability policies are implemented through a range of high-stakes measures. The Norwegian context differs from this, as implementation of the national quality assurance system is characterised by low-stakes testing and follow-up (Skedsmo, Citation2011b, p. 6). Paulsen and Høyer (Citation2016, p. 99) described school governance in Norway as a combination of external control devices and professional trust. Central to the national quality assurance system is a yearly report in which municipalities evaluate and provide documentation and follow-up of local schools’ results. The report holds elements of governmental control imposed on municipal school owners. Paulsen and Høyer (Citation2016), for instance, found that members of local school boards recognise this element of control, and thus hold the municipal school superintendents accountable for students’ results in national tests. However, contact between superintendents and local school leaders is characterised by a more collaborative and less controlling discourse when it comes to inspection, quality assurance and follow-up of students’ results. Paulsen and Høyer (Citation2016, p. 97) called this situation ‘a political vacuum’ of local school governance in Norway, ‘evident in local curriculum development, evaluation criteria, implementation strategies, organisational innovation and learning goals’. Skedsmo (2011b, p. 13) remarked that ‘compared to the accountability systems in other countries, there is nothing at stake for Norwegian principals’.
In this paper, we offer a methodological take on this ‘political vacuum’ when it comes to municipal superintendents and school leaders’ follow-up of results from national tests. As this situation is given a systemic explanation in the difference between managerial and professional accountability discourses by Paulsen and Høyer (Citation2016), we suggest that an additional explanation may lie in the fact that the data presented in the form of national test results are simply inadequate for this purpose for the majority of municipal superintendents and school leaders. In order for the data to be useful, the groups have to be large enough for the data to be representative. However, this is a specific challenge in the Norwegian case, since Norway has 428 municipalities, many of which have relatively small populations. If a school has few students, the data presented for that school may be of little value, either as information for principals and school owners, or for policy makers in general. The reason for this is that average figures based on few students are burdened with high statistical uncertainty.
A multitude of municipalities in a sparsely populated country
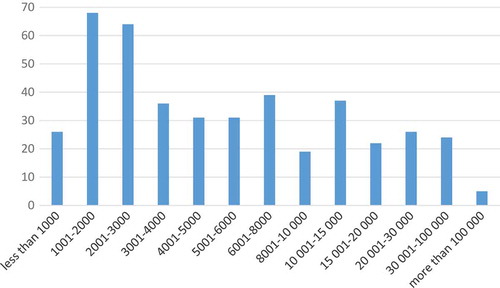
Compared with many countries, Norway is sparsely populated. In 2015, Norway had 5.2 million inhabitants and 428 municipalities. The largest municipality is Oslo, the capital, which is home to about 650,000 of the national population. Hence, about 4.5 million live in one of the other 427 municipalities, and the municipalities vary considerably in size. In 2015, the mean number of inhabitants in a municipality was about 12,000, while the median number of inhabitants was around 4,600. As indicates, a large proportion of the municipalities are small, as more than one-third of municipalities have fewer than 3,000 inhabitants and only five municipalities have more than 100,000. Hence, the distribution of municipalities according to numbers of inhabitants is positively skewed, as there are more municipalities at the lower end of the scale.
Figure 1. Number of municipalities, according to population. Data retrieved from Statistics Norway (Citation2015b).
In addition, many municipalities are large in area, and in order to avoid students having to travel long distances to go to school, there are many small schools. illustrates this by showing the number of 5th graders in municipalities and in primary schools. Forty-seven per cent of municipalities have fewer than 50 students in the 5th grade, and less than a third have more than 100 5th grade students. This implies that almost half of all municipalities have few or very few students. The median number of 5th graders in a municipality is 53, which is far less than the mean of 138 students in 5th grade. If we turn to schools, there are even more small schools, illustrating the above point about large distances. In 47 per cent of primary schools, there are fewer than 20 students in 5th grade, and only 11 schools in all of Norway have more than 100 students at the 5th grade level. The distribution of students in 5th grade is positively skewed for both municipalities and schools; however, the skewness is greater in municipalities than in schools.
Table 1. Number of 5th graders in Norwegian municipalities and primary schools, Citation2015.Footnote2 Data from the Norwegian Directorate for Education and Training (Udir).
The size of groups is a common challenge linked to the use of aggregated data, as groups for which the data are presented have to be large enough for the data to be useful. To reiterate, if a school or a municipality has few students, the data presented may be of little value either as information to principals and school owners, or to policy makers in general. The reason for this is that average figures based on few students are burdened with a high level of statistical uncertainty.
Theoretical framework
The main discussion in this paper is related to interpretation of aggregated data at the municipal and school levels. Although national tests include all 5th graders, at the municipal or school level the cohort sample for a single municipality or school may be quite small. Hence, even though the test is administered to the population of 5th graders across the country each year, it is still possible to view a single municipality or school in one particular year as a sample of a population across a period of several years. There may be variations among students at the school from year to year, which should be taken into consideration when comparing results across years or across schools. For example, we can imagine that a small school may have two students with dyslexia in one cohort, and none in the cohort for the year after. At a school with fewer than 20 5th graders (which is true for almost half of all schools) it is possible to imagine these two cohorts as alternative samples drawn from a larger population consisting of two or more cohorts of 5th graders. Thus, the question is to what extent this sample is representative of this population, especially when viewed over time.
According to what is commonly called ‘the law of small numbers’ (Kahneman & Tversky, Citation1972; Tversky & Kahneman, Citation1971), assuming representativeness might not be appropriate. The origin of the concept of the law of small numbers is actually the law of large numbers, which implies that if the same experiment or test is performed a large number of times, the average of the results obtained from many tests or trials should be close to the expected value. This argument builds on the fact that the more tests/trials conducted, the closer the results will come to the expected value. Kahneman and Tversky (Citation1972) proposed that this also applies to representativeness of samples, as they state ‘we have characterized the expectancy of local representativeness as a belief in the law of small numbers, according to which “the law of large numbers applies to small numbers as well.” This belief, we suggest, underlies the erroneous intuitions about randomness, which are manifest in a wide variety of contexts’ (Kahneman & Tversky, Citation1972, p. 435). Hence, their argument, which is the main message with respect to small numbers, is that the randomness of an error term cannot be assumed when a sample is small or a test is being performed/test results are being confirmed based on a small number of participants. In their example, regarding a finding drawn from a test of 40 test animals, the same test must be performed on 50 test animals to be able to confirm the first finding with certainty (Tversky & Kahneman, Citation1971, p. 108).
This type of argument is also relevant to national test results in Norway. When a cohort of 5th graders taking the test is divided into municipalities and schools, many of the groups they are split into are small or very small, and cannot be considered random. In order to be able to test whether changes between years are significant, it needs to be assumed that the sample is randomly drawn. As there may be great variability in students from one year to the next, for no obvious reason – i.e. just by chance – it is very hard for small and medium-sized municipalities to use and compare their results, as the Ministry for Education and Research proposes that they do (St.meld. nr. 31, Citation2007–2008). Ultimately, this comes down to low statistical power when results are divided into municipalities and schools; however, as Tversky and Kahnman (Citation1971, p. 110) pointed out, ‘significance levels are usually computed and reported, but power and confidence limits are not’.
Data and methods
The focus of this paper is on the presentation of data from national tests, and how data are and have been made available to the public through the Skoleporten.no website, which is run by the Norwegian Directorate for Education and Training. As mentioned in the introduction, some school owners and school leaders have stated that they struggle to use the data, and it is mainly larger municipalities who engage in analysing the test results (Seland et al., Citation2015). However, our analysis will focus instead on the challenges and pitfalls that potential users of aggregated data might be exposed to. The paper does not consider the validity or reliability of the tests as such, but rather how results for groups of students are presented in the public sphere, and the challenges linked to this. Specifically, we will focus on the uncertainty linked to average results.
In the following, we have used screenshots of data presentations in graphs from Skoleporten.no, where the figure text indicates when the screenshot was taken. Some of the screenshots have Norwegian text in them, but information needed by non-Norwegian speakers to read the graphs has been recorded in the figure text. Further, we have used examples of how this plays out at the school level, in order to illustrate the extent to which aggregated test data can be viewed as useful information for school leaders and school owners. All the examples we have chosen to use have been anonymised, but common to each is that they can be considered ‘average’. What we mean by ‘average’ is that the example of a municipality or a school is somewhere between the mean and the median value based on variables such as size, number of inhabitants, number of schools and number of students within schools. As shown earlier, there is a high level of variability, both in size and in population between Norwegian municipalities, and it is therefore difficult to select a ‘typical municipality’, because this also differs according to where it is located in the country. Therefore, our choice of examples does not rely on a premise that there are counties, municipalities or schools that can be considered average, since the variability within the three groups is so big, but rather that the examples we have chosen are within the average range, considering both geographical size and scores on the tests.
The Skoleporten.no website presents aggregated data at four different levels, from schools through municipalities and counties, to the national level. There is also an option that enables differentiation between girls and boys within each group. The presentation is user driven, as the user may choose which level to use, and whether the data should be for only girls, only boys, or all students at the level they are interested in looking at.
In order to investigate how the issue of size plays out in presentations of aggregated data from national tests, we show how data were presented on the Skoleporten.no website at two given points in time. Hence, this is a comparative design, as we compared two cases over time (Ringdal, Citation2001). First, we looked at how data were presented in 2013, when a research-based evaluation of national tests took place. The evaluation report (Seland et al., Citation2013) pointed out several weaknesses in the presentation of data, and suggested improvements. In this paper, we compared these original presentations and suggestions for improvements with how data were presented in 2016. We examined the presentation of average test results at the two points in time, as well as discussing practical implications regarding how the data are presented. Additionally, even if the Norwegian Directorate for Education and Training has changed the mode of presentation of data, the challenges linked to size and what constitutes a significant change persist. These challenges are elaborated on in the final discussion in this paper.
Presentation of aggregated test results in 2013 and 2016
In order to investigate how the issue of size plays out in presentations of aggregated data from national tests, we studied how data were presented, and continue to be presented, at two points in time. The Norwegian Directorate for Education and Training changed the mode of data presentation, and we thus compared how data were presented in 2013, when the evaluation project took place, with how data were presented in 2016.
illustrates how aggregated test data were presented at county and municipality levels in 2013. In 2013, Skoleporten.no used average ‘mastering’ or competence levels of students, not actual scores. The national average for 5th graders in 2013 showed that a quarter of students fell into Level 1, the lowest level; half of students came within Level 2; and the highest-performing quartile of students were in Level 3. That is, the test results were recalculated into three competence levels. Based on the recalculation of actual scores into competence levels, the mean and the standard deviation for the competence level of the selected group can also be calculated. For the aggregated levels of data, at county and municipality level, it is also possible to view results for several school years at the same time; in this case, this is data for the school years 2008–09 to 2012–13 across the three tests (English, literacy and numeracy) presented side by side in one graph.
Figure 2. Screenshot from Skoleporten.no, taken in 2013. Average ‘mastering’ level in English, reading and numeracy for 5th graders in a county, for the school years 2008–09 to 2012–13.
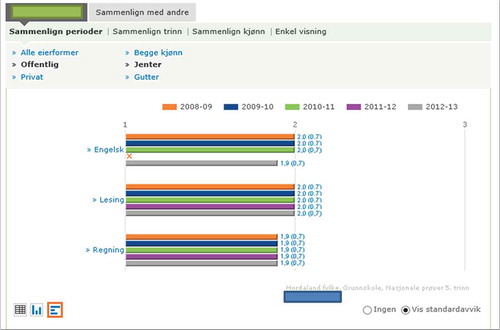
There are several challenges linked to the presentation in . First, the scale, with data presented to one decimal place, gives an impression of exactness that might not be accurate. Second, the data are very stable over time, and as the number of students behind the average mastering level has not been provided, readers of the data have no way of knowing whether a change from one year to the next is statistically significant or is pure coincidence.
The first concern is that the presentation in 2013 used a scale for the mean and the standard deviation to one decimal place. This gives viewers the impression that the average competence level is quite a precise measure, which can be stated to the number of decimal places. However, as the scores are recalculated into three quite broad levels of mastery, information that lies within the data (the actual scores) is concealed, and it is likely that schools and municipalities will get less information out of the levels of mastery.
The second concern is linked to information that stakeholders are supposed to retrieve from the data. At the municipality or county level, the mean is quite stable over time. As shown in , the average competence level in literacy was 2.0 for all five years, while the average competence level in numeracy was 1.9 in the same period. For English, there was some variation over time. During the first three years, the average was 2.0; in 2011–12 the test system failed and data were therefore not reported; while in 2012–13, the last year shown in this graph, the mean competence level was 1.9.
But how do we know whether a mean average competence level of 1.9 is significantly different from a mean average competence level of 2.0? In 2013, Skoleporten.no did not provide information on the number of persons in the different groups displayed, and it is therefore not possible to say whether the change observed in English is significant.
In order to state that an average of 1.9 in a municipality with 95 per cent certainty is different from the national average of 2.0, the number of students who have taken the test in a given municipality has to be at least 189. As indicates, less than a third of municipalities had more than 100 students, and therefore statements that can be made about significant changes in general are rather limited.
In 2012–13, it was also possible to compare two municipalities to each other in Skoleporten.no. If we wanted to compare two equally large municipalities, it would be necessary for there to be a minimum of 377 students in 5th grade in each of the two municipalities in order to state that an average of 1.9 is significantly different (with 95 per cent certainty) from an average of 2.0. In 2013, only 25 Norwegian municipalities had as many students as that in 5th grade. As shows, no schools were large enough to make this kind of comparison at the school level. In 2013, the largest school in the country had 140 students in 5th grade, thereby rendering comparisons between individual schools when differences are small irrelevant. Hence, making the type of comparisons Skoleporten.no envisaged being undertaken between municipalities and schools in 2013 is not possible, at least if one is interested in comparing differences that are statistically significant, and not just due to coincidence.
The evaluation report commented on challenges linked to the public presentation of aggregated data on the Skoleporten.no website, and suggested an alternative way of presenting data (Seland et al., Citation2013, p. 160f). The following changes were recommended:
To show average test scores for groups, rather than average level of competence, as the former is a more precise measurement.
To display the error margin instead of, or in addition to, the standard deviation. This would give readers a better understanding of whether small differences between schools or municipalities are actually statistically significant.
To display the number of students (cases) who are behind the mean for a specific group.
After publication of the evaluation report, the way data are published on the Skoleporten.no website was changed. The Norwegian Directorate for Education and Training no longer publish average levels of competence, but instead publish average scores at the group level. In addition to the mean, the number of students and 95 per cent confidence intervals at the group level were reported, as well as the range covering 60 per cent of the students. This normally equals slightly less than one standard deviation each way, given that data are usually uniformly distributed. Another important change is that test items that are repeated every year (and are kept secret) function as an anchor, making the means for one year comparable to means in another year. This has been in place since 2014 for numeracy and English, but has still not been introduced for reading. This specific change has implications for how results are presented on Skoleporten.no, and, as indicated in , results are no longer published as average levels of mastery, but rather as mean scores. The national mean is centred on 50 in numeracy and English. However, even though the national mean in the different subjects is centred, it bears little meaning when comparing test results across the three different tests. They only share the same scale, with 50 as a national average.
Figure 3. Graph showing screenshot from Skoleporten.no, taken in 2016. Average mean scores in English, literacy and numeracy for 5th graders in a representative (typical) Norwegian municipality. School years 2014–15 and 2015–16. Key figures for each test are included in the table below the graph.
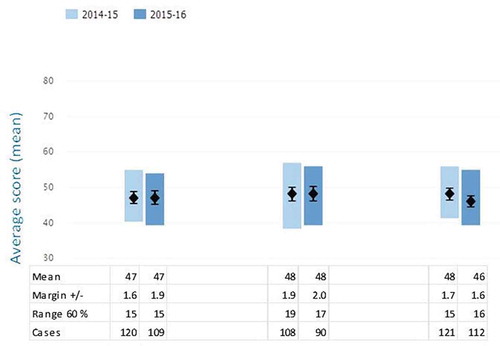
shows a way of presenting data that provides much more information. This is an adapted version of how data are presented on the Skoleporten.no website. The graph is displayed on the website, and when the mouse is hovered over a certain score, information on the margins of error and the number of cases becomes visible. In order to clarify the website presentation in this paper, the information provided has instead been displayed in a table below the graph (see ). However, in the average Norwegian municipality examined in , there were no statistically significant changes for any of the tests from 2014–15 to 2015–16, as the outer limits of the black dots overlap in all cases. For English and numeracy, the mean was the same in both years. For numeracy, there was a drop of two points, but this was not significant. To be significant, the change would have to have been at least three points with the actual sample size and spread.
However, the way the scale is shaped also has implications for how many students there should be in a group to be sure that differences are statistically significant. To use the same example as earlier: if we want to compare the results from one municipality with the national result, there would have to be at least 279 students in 5th grade in this municipality in order to state that the average of 49 is significantly different from 50. Only 50 of Norway’s 428 municipalities had that many 5th graders in 2015. If we want to compare two equally large municipalities with regards to the difference in mean scores, the number of 5th graders would have to be at least 556 in each municipality to state that 49 differs significantly from 50. Only 16 municipalities had such a large number of students, and, as stated earlier, no school was as large as that. According to , only 11 out of 2,257 schools had more than 100 5th graders, of which eight schools are located in Oslo. Hence, it is in most cases meaningless to compare data at school level. Further, it is important to remember that nearly half the schools had fewer than 20 students in 5th grade, and nearly half of the municipalities had fewer than 50 5th graders in total. This implies that the type of school comparisons that Skoleporten.no still provides the opportunity to conduct are generally not meaningful, at least not if one is interested in comparing significant differences at school level. Hægland, Kirkebøen, Raaum, and Salvanes (Citation2004, p. 30) showed, using data on grades for lower secondary schools, that differences between small schools (defined as less than 31 pupils per grade) are due to a great extent to random variation.
In order to further explore this, shows a graph that compiles the results for each of the schools of the municipality used in . This average municipality has five schools with 5th graders, but one is too small to allow public presentation of the test results (fewer than 10 students in 5th grade). We also see that data are missing for six of the 24 tests. Reasons for this could be that there were practical or technical problems when the tests were carried out. Comparing two different years of the same test within the same school reveals no significant differences. However, due to random variation being much greater in small schools than in larger schools (Hægland et al., Citation2004, p. 30), the averages displayed for the very small schools in (B and C) could have been very different from year to year, only due to random variation. Hence, as a source of information for stakeholders in the municipality, this set of data is of little or limited usefulness, apart from stating that school results generally do not differ much from year to year and that changes are usually within the margins of error.
Figure 4. Average mean score in English, literacy and numeracy for 5th graders in four schools in a representative (typical) Norwegian municipality. School years 2014–15 and 2015–16. Results from school D have not been reported, due to its having fewer than 10 cases. Source: Skoleporten.no, 2016.
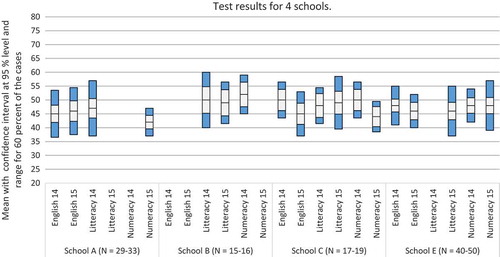
Skoleporten.no also allows the comparison of test results across gender, but such comparison would further reduce the availability of information. In the particular case outlined here, dividing the data by both school and gender would imply that results for schools B and C would not be made public, because the number of cases would be fewer than 10 for at least one of the two groups. The statistical uncertainty would also increase considerably. Hence, the value of the information retrieved from national tests for local politicians and policy makers is marginal, as they get information on only two out of the five schools in their municipality, and the little information they do get has quite high levels of statistical uncertainty. Additionally, the municipality used as an example in is of average size, with a population between the mean and the median, and this challenge would be the case for quite a large number of municipalities. Consequently, our case clearly demonstrates the limited usefulness of this kind of information for school administrators and leaders of most Norwegian municipalities. However, it is still possible that an individual school that is aware of its context and variations between cohorts can get some information from the tests that is useful for school development.
Discussion
The aim of this paper was to explore how data from Norwegian national tests have been presented in the past, and continue to be presented, in an aggregated format on an official website; how this presentation has changed over time; and the implications of using aggregated test results for municipal stakeholders in order to improve school quality.
It is important to keep in mind that all types of statistical information can be considered somewhat uncertain, and that this also applies to figures that have not been derived from sample surveys and thus includes all students in a particular population. Therefore, statistical uncertainty must also be taken into account when interpreting average figures. The publication of results at the school level that do not take into account the margin of error gives the impression that aggregate results from national tests can be considered a precise measure, while this is actually only the case for very few of the larger schools. Even at the municipal level, most results will have a margin of error that must be taken into account, and this margin of error should therefore be made public along with the results.
There has been a clear improvement in presentation format when comparing the online presentation of aggregated test results for different groups in 2016 with the presentation used in 2013. In 2013, average competence levels were displayed, rather than actual scores. Average competence levels reduce the information that can be retrieved from national tests, and may, to some extent, misrepresent the results (as they are pooled in groups). The change to presenting actual scores on a norm-based scale with 50 as the national average is a much better way of presenting data to the public, and can display interesting information for large groups, which is relevant to principals, municipal stakeholders and parents. Further improvements made to the 2016 presentation include margins of error and the number of cases in the group for which the aggregate data is valid. Hence, this gives the public a real opportunity to evaluate the data, and to see more easily whether changes from one year to another are statistically significant. In general, the presentation of aggregated test results shown on Skoleporten.no is now highly informative, paving the way for fewer misunderstandings and less misinterpretation of data. The improvements to the online publication, with publication of relevant information, such as margins of error and size of groups, could also contribute to enhancing the public’s understanding of what the average national test scores actually mean, as well as contributing to providing information about the limits of the utility of test scores.
However, challenges linked to the public use of aggregated test results remain. One challenge is linked to the use of data by stakeholders. The Directorate for Education and Training recommends caution when using the results to compare data between years, or to compare results across schools. However, this is still done by stakeholders at school level, municipal level and governmental level. The Ministry for Education and Research encourages school owners to use data actively, and many municipalities adhere to this, especially in their annual reports. However, even though the Ministry for Education and Research has asked school leaders and school owners to use aggregated data to inform policy, they do not consider the fact that some municipalities, and especially many schools, may be too small to actually get valid and useful information out of aggregated test data. Hence, the type of use the Ministry aims to inspire may lead to misunderstandings and misinterpretations.
Even though the data presentation has improved, the fact remains that many municipalities and a majority of schools are too small to extract data that are useful. As stated earlier, there should be at least 50 5th graders in a school or municipality before it is possible to make any valid comparisons of aggregated test scores. However, only 22.5 per cent of schools are this size, which implies that most schools are too small. In fact, 47 per cent of schools have 19 or fewer students in 5th grade; therefore, aggregated results at the school level are probably useless for these schools, and therefore also for the municipal stakeholders who are responsible for them. Hence, by encouraging active use of displayed data, as the Ministry for Education and Research did in a White Paper (St.meld. nr. 31, Citation2007–2008), small schools and municipalities are actually conned into believing that they can use the data to inform policy. This is a general challenge that is linked to the geography and the population pattern throughout the country. It would have been fairer for the Ministry for Education and Research to acknowledge that this type of data is useful for some larger schools and municipalities, but not for all. Luckily, some of the smaller municipalities have already accepted and recognised that the applicability of such data is limited, and are thus not using aggregated test data as an indicator of school quality (Seland & Hovdhaugen, Citation2017; Seland et al., Citation2013).
Methodological challenges linked to presentation of aggregated test results
Even though it may often be perceived as highly accurate, most statistical information is uncertain to some extent, in terms of comparing numbers with each other. When comparing cohorts, schools or municipalities, each group of students should be regarded as a sample. Therefore, it is crucial for the interpretation of figures to take the statistical uncertainty of the numbers into account. For example, accurate presentation of data on a mean must include the number behind all groups, as well as the standard deviation or the standard error. This makes it possible to calculate whether a difference between two groups is statistically significant. Improvements made to the publication of aggregated test results on the Skoleporten.no website fulfil this requirement, and the publication format used in 2016 is thus an improvement compared with the presentation used in 2013.
A trained user of statistical information could easily interpret the data presented, and would be able to see the limitations of the aggregated test results presented, as well as implications for the work carried out in school leadership and administration. Our concern, however, is that the actual users of this information – who could be principals, teachers or educational administrators at the municipality level, as well as parents and local newspaper journalists – may not always possess the skills needed to obtain a full understanding of what the presented aggregated test results actually mean, and the limits of their utility. Therefore, it is of the utmost importance that the Skoleporten.no website provides clear information on when and how differences between groups can be considered statistically significant, and when groups are so small that any differences found between them are most probably incidental rather than statistically significant, due to random variation.
Disclosure statement
No potential conflict of interest was reported by the authors.
Notes
1. National tests in year 9 of compulsory schooling are a repetition of the tests undertaken by 8th graders, to compare student development.
2. is based on data for 2015, but there are only minor changes from year to year in the number of 5th graders in municipalities and schools.
References
- Aasen, P., Møller, J., Rye, E., Ottesen, E., Prøitz, T. S., & Hertzberg, F. (2012). Kunnskapsløftet som styringsreform – et løft eller et løfte? Forvaltningsnivåenes og institusjonenes rolle i implementeringen av reformen. (NIFU-rapport 20/2012). Oslo: NIFU & ILS, UiO.
- Allerup, P., Velibor, K., Kvåle, G., Langfeldt, G., & Skov, P. (2009). Evaluering av det nasjonale kvalitetsvurderingssystemet for grunnopplæringen. (FoU-rapport 8/2009). Kristiansand: Agderforskning.
- Elstad, E. (2009). Schools which are named, shamed and blamed by the media: School accountability in Norway. Educational Assessment, Evaluation and Accountability, 21(2), 173–189. doi:10.1007/s11092-009-9076-0
- Hægland, T., Kirkebøen, L. J., Raaum, O., & Salvanes, K. G. (2004): Marks across lower secondary schools in Norway. What can be explained by the composition of pupils and school resources? (Statistics Norway Report 2004/11). Oslo: Statistics Norway.
- Kahneman, D., & Tversky, A. (1972). Subjective probability: A judgment of representativeness. Cognitive Psychology, 3, 430–454. doi:10.1016/0010-0285(72)90016-3
- Klausen, K. K. (2011). Fra Public Administration over New PA til NPM – en fortolkningsramme for reformer. In T. Busch, E. Johnsen, K. K. Klausen, & J. O. Vanebo (Eds.), Modernisering av offentlig sektor. Trender, ideer og praksiser. Chapter 3 (pp. 48–61). Oslo: Universitetsforlaget.
- Lie, S., Hopfenbeck, T. N., Ibsen, E., & Turmo, A. (2005). Nasjonale prøver på ny prøve. Rapport fra en utvalgsundersøkelse for å analysere og vurdere kvaliteten på oppgaver og resultater til nasjonale prøver våren 2005. Oslo: Institutt for lærerutdanning og skoleutvikling, Universitetet i Oslo.
- Lien, M., Lidén, H., & Vike, H. (2001). Likhetens paradokser. Antropologiske undersøkelser i det moderne Norge. Oslo: Universitetsforlaget.
- Mausethagen, S. (2013a). Talking about the test. Boundary work in primary school teachers’ interactions around national testing of student performance. Teaching and Teacher Education, 36, 132–142. doi:10.1016/j.tate.2013.08.003
- Mausethagen, S. (2013b). A research review of the impact of accountability policies on teachers’ workplace relations. Educational Research Review, 9, 16–33. doi:10.1016/j.edurev.2012.12.001
- Møller, J., Prøitz, T. S., Rye, E., & Aasen, P. (2013). Kunnskapsløftet som styringsreform. In B. Karseth, J. Møller, & P. Aasen (Eds.), Reformtakter. Om fornyelse og stabilitet i grunnopplæringen. Chapter 2 (pp. 23–41). Oslo: Universitetsforlaget.
- NOU 2002: 10. (2002). Førsteklasses fra første klasse. Forslag til rammeverk for et nasjonalt kvalitetsvurderingssystem for norsk grunnopplæring. Delinnstilling fra Kvalitetsutvalget, levert til Utdannings- og forskningsdepartementet. Oslo: Utdannings-og forskningsdepartementet
- Paulsen, J. M., & Høyer, H. C. (2016). External control and professional trust in norwegian school governing. Nordic Studies in Education, 35, 86–102. doi:10.18261/issn.1891-5949
- Ringdal, K. (2001). Enhet og mangfold. Samfunnsvitenskapelig forskning og kvantitativ metode. Bergen: Fagbokforlaget.
- Sejersted, F. (2005). Sosialdemokratiets tidsalder: Norge og Sverige i det 20. århundre. Oslo: Pax.
- Seland, I., & Hovdhaugen, E. (2017). National tests in Norway – an undeclared standard in education. In S. Blömeke & J.-E. Gustafsson (Eds.), Standard setting - international state of research and practices in the nordic countries. Methodology of educational measurement and assessment series. Dordrecht: Springer.
- Seland, I., Hovdhaugen, E., & Vibe, N. (2015). Mellom resultatstyring og profesjonsverdier. Nordisk Adminstrativt Tidsskrift, 92(3), 44–59.
- Seland, I., Vibe, N., & Hovdhaugen, E. (2013). Evaluering av nasjonale prøver som system. (NIFU rapport 4/2013). Oslo: NIFU.
- Skedsmo, G. (2011a). Vurdering som styring av utvikling og overvåkning av resultater. In J. Møller & E. Ottesen (Eds.), Rektor som leder og sjef. Om styring, ledelse og resultatutvikling I skolen. Chapter 4 (pp. 74–94). Oslo: Universitetsforlaget.
- Skedsmo, G. (2011b). Formulation and realisation of evaluation policy: Inconsistencies and problematic issues. Educational Assessment, Evaluation & Accountability, 23(1), 5–20. doi:10.1007/s11092-010-9110-2
- St.meld. nr. 31. (2007–2008). Kvalitet i skolen. Oslo: Kunnskapsdepartementet.
- Statistics Norway. (2015a). Pupils in primary and lower secondary school, October 1st, 2015. Statistics publish December 11th, 2015. Retrieved August 2, 2016, from https://www.ssb.no/en/utdanning/statistikker/utgrs/aar/2015-12-11
- Statistics Norway. (2015b). Population and population changes, table 60913 (Data from StatBank, for 2015). Retrieved August 9, 2016, from https://www.ssb.no/statistikkbanken
- Telhaug, A. O., & Mediås, O. A. (2003). Grunnskolen som nasjonsbygger. Fra statspietisme til nyliberalisme. Oslo: Abstrakt forlag.
- Tveit, S. (2013). Profiles of educational assessment systems worldwide: Educational assessment in Norway. Assessment in Education, 21(2), 221–237. doi:10.1080/0969594X.2013.830079
- Tversky, A., & Kahneman, D. (1971). Belief in the law of small numbers. Psychological Bulletin, 76(2), 105–110. doi:10.1037/h0031322
- Utdanningsdirektoratet. (2011). Norsk landrapport til OECD. OECD review on evaluation and assessment frameworks for improving school outcomes. Oslo: Utdanningsdirektoratet.
- Vike, H. (2004). Velferd uten grenser. Den norske velferdsstaten ved veiskillet. Oslo: Akribe.