
ABSTRACT
The aim of the study was to analyse learning using Augmented Reality (AR) technology and the motivational and cognitive aspects related to it in an informal learning context. The 146 participants were 11- to 13-year-old Finnish pupils visiting a science centre exhibition. The data, which consisted of both cognitive tasks and self-report questionnaires, were collected using a pre- post-test design and were analysed by SEM path-analysis. The results showed that AR-technology experience was beneficial for all, but especially for the lowest-achieving group and for the girls. In general, pre-knowledge skills predicted post-knowledge test results. As expected, school achievement had an effect on pre-knowledge results. In addition, motivation turned out to be an alternative key route for learning. Being a boy predicted directly or indirectly all other motivational variables, enjoyment and interest, but girls had a higher relative autonomy experience (RAI). Situation motivation and attitude towards learning in the science exhibition were much more strongly inter-connected among boys than girls, and attitude predicted post-knowledge only for boys. AR seems to be a promising method by which to learn abstract phenomena using a concrete manner.
Introduction
Information and communication technologies have profoundly altered our everyday lives. For more than two decades, they have been considered as highly promising tools for improving education. Although the amount of publications related to qualitative and quantitative results has been growing rapidly, the demand and challenge published in the thematic issue of Science (1/2009) is still more than actual: Making a Science of Education demanded that a great deal of high-quality research should be performed by focussing on the utilisation and effects of the new technologies in both school and informal learning environments (Alberts, Citation2009; Rennie, Citation2014; Salmi, Kaasinen, & Kallunki, Citation2012). This study aims to contribute to the research literature of Augmented Reality (AR) both in practice and theory. The focus is in bridging the gap between formal education and informal learning.
The original definition of AR has been summarised for our purposes with four simultaneously required elements (Azuma, Citation1997): (a) a mixture of real-world and digital illusions, (b) interactivity with the real environment, (c) on-line effects and (d) three-dimensional impressions (Martin et al., Citation2011; Salmi et al., Citation2012). As in earlier research reports, there have been lots of opportunities to apply these technologies: ‘The more a virtual immersive experience is based on design strategies that combine actional, symbolic, and sensory factors, the greater the participant’s suspension of disbelief that she or he is “inside” a digitally enhanced setting’ (Dede & Barab, Citation2009, p. 66). However, only a few applications have been created and orientated towards educational purposes. In particular, there have still only been a few teaching applications of AR (Andújar, Mejías, & Márquez, Citation2011; Salmi et al., Citation2012), but they have started to grow fast (Bacca, Baldris, Fabregat, Graf, & Kinshuk, Citation2014; Bower, Howe, McCredie, Robinson, & Grover, Citation2014; Radu, Citation2014).
‘Mixed Reality’ has become the widely used term for combining AR with the environments of real objects. The separate environments of the real world and the virtual world form a reality – virtuality continuum of mixed reality (see ). While viewing from the very ends of the continuum, augmented reality and augmented virtuality appear. This continuum has been extended into a two-dimensional plane of ‘Virtuality’ and ‘Mediality’. This already classical continuum (Milgram & Kishino, Citation1994) can be derived as an educational model as has been shown in . The model below describes formal education and informal learning from a new angle by adding the real ↔ virtual-dimension. The figure shows that different types of virtual learning solutions have brought a lot of new learning materials especially to informal learning settings. However, AR has become more common in current applications because not every little detail of reality has been needed to be modelled as they are already presented (Andújar et al., Citation2011; Salmi et al., Citation2012).
Figure 1. Milgram's Reality-Virtuality Continuum. (Milgram & Kishino, Citation1994).
Figure 2. Persistent dichotomies or blurring boundaries? (Salmi, Kaasinen & Kallunki, Citation2012).
AR has been utilising the already existing environment and has added new visual information to it. According to its broadest definition, AR may be considered a term that describes technologies that allow the real-time mixture of computer-generated digital content and the real world (Haller, Billinghurst, & Thomas, Citation2007).
AR’s first utilisation – like many new innovations – only came about in military and high-tech solutions demanding big investments. Boeing inventor and technician Thomas Caudell has been attributed to having been the very first ‘civil’ solution in the beginning of the1990s; at that time he started to use it as a new term to describe how the head-mounted displays that electricians use when assembling complicated wiring harnesses work.
Since then the AR has been a trendy technology which attracts more and more attention from HCI-Human Computer Interaction planners, designers and researcher (Salmi, Sotiriou, & Bogner, Citation2010). Today, trendy i-glasses, heads-up displays and car windshields with data have become perhaps the most well-known consumer AR products, but the technology has been used in many industries, including healthcare, public safety, gas and oil and tourism and marketing.
Reported learning results by using AR-solutions
One indicator of the AR boom in education is that there have been several recent meta-analyses about the topic. One such analysis is Bacca et al. (Citation2014) meta-study ‘Augmented Reality Trends in Education: A Systematic Review of Research and Applications’, which analysed more than 30 research reports from 2003 to 2013. The review partly described the current state of AR research in education. Besides the main outcomes, this meta-study showed that there is a lack of review studies which focus on investigating factors such as the uses, advantages, limitations, effectiveness, challenges and features of AR in educational settings. Personalisation for promoting inclusive learning using AR has also become a growing area of interest.
In Radu’s (Citation2014) ‘Augmented reality in education: A meta-review and cross-media analysis’, 26 articles were selected for analysis. The articles mainly compared AR vs. non-AR solutions. Thus, the approach provided both a critical literature review and at the same time identifying the outcomes that AR can give learners. The positive outcomes were as follows: increased content understanding, learning spatial structure and function, learning language associations,Footnote1 retention in long-term memory, improved physical task performance and increased student motivation. On the other hand, the negative outcomes were as follows: attention tunneling,Footnote2 usability difficulties, ineffective classroom integration and learner differences.
The abovementioned meta-analyses by Bacca et al. (Citation2014) and by Radu (Citation2014) have only covered a very small part of the research area. Much of the reported research has been very pragmatic as it often contains research and development elements and has sometimes been also conducted and published outside the traditional academic field. It has, however, offered a firm starting point for further analysis. The meta-studies (Bacca et al., Citation2014; Radu, Citation2014) discussed also the trends and the vision of the future and opportunities for further research in AR for educational settings. As such, for this present research, we have brought three elements to the discussion, which have so far been underrepresented. We have focused on the following: (1) to bridge the gap between informal learning and formal education, (2) to take into account different learners, especially (3) the possible gender effects, (4) to analyse the learning effect of AR in pre- and post-design and (5) to find pathways for changing the strong interest and external situation motivation into intrinsic, content-based motivation.
Authenticity of science learning (Braund & Reiss, Citation2007) has been found to be an effective motivating factor. AR educational solutions have been trying to use it as the starting point while designing AR simulations. In a study (Rosenbaum, Klopfer, & Perry, Citation2007) related to role playing by AR, the topic to be learned was disease transmission that the students could affect through their own actions. According to the results, this kind of ‘participatory reality’ game has made new kinds of authentic science inquiry experiences possible. This approach has become known globally during the Pokémon GO game trend in 2016. Furthermore, visual and immersive interfaces have been offering new approaches for utilising the visual reasoning ability to transfer learning processes from out of the classroom into real and authentic, open learning environments (Salmi et al., Citation2010).
There has been evidence that virtual learning environments promote higher learning results (Vilkoniené, Lamanauskas, & Vilkonis, Citation2008). However, in the case of learning natural sciences, either real learning itself or a combination of real and virtual environments (Bilek, Zemanova, & Turcani, Citation2007) has been preferred (Lamanauskas & Vilkonis, Citation2007).
AR has shown to improve learning achievement (Chiang, Yang, & Hwang, Citation2014). More specifically, several reports (Radu, Citation2014; Vilkoniené, Citation2009) have found that AR solutions could help gifted learners, but the results are somewhat mixed, as, for example, Freitas and Campos (Citation2008) claim that high-achievers do not especially gain from AR-technology. Pupils with low motivation as well as pupils with lower school achievement have shown to benefit from the use of AR (Bower et al., Citation2014; Freitas & Campos, Citation2008; Nincarean, Bilal Alia, Halim, & Rahman, Citation2013; Salmi et al., Citation2010).
Science centre exhibitions and informal learning settings have been found to be more gender equal than formal classroom education settings (Osborne & Dillon, Citation2008; Salmi, Thuneberg, & Vainikainen, Citation2016). Video games and computer-based entertainment and serious pc-educational games (cf. Connolly, Boyle, MacArthur, Hainey, & Boyle, Citation2012) have traditionally been more beneficial for the boys. In addition, results by Echeverría, Gil, and Nussbaum (Citation2011) relating to educational use of AR-technology indicate that boys benefit from AR more than girls, as they performed better in the knowledge post-test.
In one of the few reports related to teacher education and teacher professional development (Salmi et al., Citation2012), questionnaire data of 292 teachers were statistically analysed. The main outcomes were as follows: moving from a teacher-controlled learning environment towards a pupil-orientated learning one, connecting ICT-AR with and between learning environments, seeing remarkable changes in the roles and responsibilities of students and teachers towards student centeredness, autonomy, and peer collaboration. Teachers were also seeing structural changes in the learning environments.
Informal learning, open learning environments, science centre, and AR exhibits
Learning in informal science education contexts has been far less studied than science education in traditional school settings. The present study has focused on both the cognitive and the motivational aspects of learning using AR exhibits as part of the science centre visit. Using this type of technology as mixed reality of concrete and virtual objects has become more common in the modern science exhibitions recently (Kamarainen et al., Citation2013; Martin et al., Citation2011).
The main results about informal learning and especially about science centre education have been related to the effects of motivation on learning (Falk & Dierking, Citation1992; Fenichel & Schweingruber, Citation2010; Osborne & Dillon, Citation2008; Salmi, Citation2003, Citation2011; Salmi et al., Citation2016, Salmi, Vainikainen, & Thuneberg, Citation2015; TanWee Hin & Subramaniam, Citation2003). Learning from informal sources and in an out-of-school environment has been found to be effective and motivating (Fenichel & Schweingruber, Citation2010; Osborne & Dillon, Citation2008).
This quantitative study has been based on the theories and literature findings bridging the gap between formal education and informal learning. A huge amount of information, especially about modern phenomena like the recent developments in mathematics, science and the new technologies, has been obtained in a personal way from family, friends and peer groups. Furthermore, the roles of television, libraries, magazines and newspapers have also been essential for public understanding of science. Museums and science centres have regularly had more visitors during the last decades. Despite this development, there has been less theoretical or empirical research in the informal sector (Osborne & Dillon, Citation2008). ICT- and web-based learning have challenged and changed the vision of traditional formal education (Salmi, Citation2011, Citation2012).
Interest, situation and context of learning
Researchers have shown that there is significant overlap between interest and motivation (Durik & Harackiewicz, Citation2007). It has been claimed that in the science centre learning context interest could be the link bridging situation and intrinsic motivation (Salmi, Citation2003). On the one hand, interest-based, self-determined forms of learning motivation provide the most favourable learning outcomes also in relation to use of AR-technology (Antonioli, Blake, & Sparks, Citation2014), and on the other hand the organisation of the learning environment can spark interest before personal motivation develops (Fenichel & Schweingruber, Citation2010; Renninger & Hidi, Citation2011). Thus, out-of-school learning – formal-like teaching in an informal context – can provide an excellent opportunity for enhancing pupils’ interest and motivation towards learning science and mathematics (Vainikainen, Salmi, & Thuneberg, Citation2015).
Novelty has been the key factor in creating the interest and situational motivation in science centres. The shock of a new setting can be addressed by the so-called ‘sniff around corners’ method (Balling & Falk, Citation1980). It works also as a ‘head-start’ for the learning process. It has also a clear link to intrinsic learning motivation. The content of an exhibition is essential: meaningful experiences are closely connected with a positive development of interest in the subject. Of course, the starting point of this process of growing interest lies within the person, but the content and interaction define the development of situational and individual interests (Hidi & Renninger, Citation2006). The conflict between earlier knowledge and capacities and the goals that can be reached by own learning activities start this process (Salmi, Citation2003). However, the informal learning settings might give strong stimuli and thus motivate also the students who otherwise would not be ‘academically’ orientated. Those pupils, who like what they have learnt, are then apt to develop an autonomous learning motivation (Hsiao, Chen, & Huang, Citation2012; Wagner, Citation2008), thus cultivating the more superficial interest into a deeper desire to continue learning.
Description of the AR-exhibitions of the present study
The pupils used the exhibits ‘Doppler Effect’ and ‘Molecule Movement in Gas’, the AR-application which enabled them to see something more than is possible by ordinary experiments (Salmi, Citation2012). While investigating thermal motion, the velocity of molecular nitrogen for example in a refrigerator or on a hotplate can be compared both by following the motion of augmented molecules in different places and also by comparing the different velocities of the molecules on a temperature-velocity graph (Gargalakos, Rogalas, Lazoudis, & Sotiriou, Citation2012). In a similar way, also the exhibit ‘Doppler Effect’ described for the pupils three-dimensionally the phenomenon of mixing the graphical elements with the original physical phenomenon: a mini-fire-truck passed the listener on the side of a road, then the listener heard first a higher sound when the fire truck approached, and after passing the sound heard is lower (Owen, Owen, Barajas, & Trifonova, Citation2012). In the case of this experiment the augmented information was the circular wave pattern that represents the 3-D spherical pressure wave (Giallouri, Lazuodis, & Sotiriou, Citation2012). The wave pattern changes according to the Doppler effect when the fire truck starts to drive (Larsen & Bogner, Citation2012). Also the theoretical and mathematical patterns and formulas have been included in visual screens, which can be seen by the users (Buchholz & Brosda, Citation2012). See the exact description of the project ‘Guide of Good Practice’ ed. by Lazoudis, Sotiriou, & Salmi, Citation2012.
Research questions
The referenced literature in the previous pages suggests that AR might be beneficial, for example, for pupils with special needs, gender, or pupils with low motivation, the goal is to test whether these assumptions would hold. The focus is to test motivational aspects and to analyse learning results relating to AR of the differently achieving (school success) pupils.
The aim of the study was to find out how pupils learn when using AR technology in a science centre context. The specific research questions were:
Q1: How did the contextual (formal vs. informal learning context) variables predict learning?
H1: The more interest pupils show towards the exhibition context, the better cognitive learning results they will receive.
Q2: How did the motivational variables predict learning?
H2: Situational motivation supports cognitive learning outcomes.
H3: Pupils intrinsic motivation and autonomy experience have an effect on cognitive learning in the exhibition.
Q3: What is the role of gender in the learning process?
H4: Boys gain more by using AR
H5: Girls have stronger autonomy experience.
Q4: What was the role of visual reasoning ability and school achievement in the learning process?
H6: Lower achieving pupils benefit from the AR technology the most.
H7: Visual reasoning scores predict pupils’ knowledge learning results.
Method
Participants
The participants consisted of 146 pupils, of which 51% (n = 75) were girls. The pupils were in average 12.3 years old. From the 32 schools in the Helsinki metropolitan area in Finland visiting the science centre exhibition, 7 schools were randomly selected.
Venue
The pupils visited a typical science centre exhibition, which was supported and fulfilled by five AR-technology supported exhibits. They were the (1) Doppler phenomenon, (2) Boltzmann’s molecule movement, (3) Young Experiment, (4) Aeroplane Mini Wing exhibit and (5) Rolling Double Cone.
Measures
presents an overview of the design of the study, the measures and timing.
Table 1. Design of the study.
Deci and Ryan autonomous motivation
We used self-determination theory (SDT) to test the autonomous motivation. It was only administrated as a pre-test because after a short visit, there should not be any major changes in the overall motivation, which is related to the whole personality.
The Deci-Ryan Motivation (SRQ-A: Self-Regulation Quality – Academic) test includes 32 standardised items on a Likert scale (1 = not at all true, 2 = not nearly true, 3 = somewhat true, 4 = totally true). The summative variables on the self-determination continuum are located in the order from external towards intrinsic: external, introjected, identified and intrinsic.
The SRQ-A test includes a formula (Ryan & Connell, Citation1989) by which the Relative Autonomy Index (RAI) can be calculated. In this study, the RAI was used as the indicator of the level of autonomous motivation. The positive sign in RAI indicates that the experience is rather autonomous, and the negative one that it is more externally controlled and relies more on adults or others than on one-self.
The reliability of the test was α = .92 (32 items).
Situation motivation
Situation motivation was measured with a questionnaire consisting of 14 Likert scale items (scale 1–5, totally agree – totally disagree). The questionnaire was administered as a post-test only. This test provided information about how attractive the pupils experienced the exhibition. An example of an item: ‘Visiting the exhibition with AR was fun’. The reliability of the test was α = .91 (14 items).
Raven test
The cognitive measure was a visual reasoning and learning capacity test: Raven Standard Progressive Matrices (Raven, Raven, & Court, Citation2003). This test has been widely utilised in both practice and theoretical research. The cumulative amount of data in different age groups, schools and socio-economic cultures has shown the Raven test to be a valid tool. In addition, it does not give gender advantage for either male or female pupils.
According to the test theory (Raven, Raven, & Court, Citation2000, pp. 1–2), the main elements in the common cognitive ability are the capacity to learn and the capacity to embrace and remember the knowledge once learned. This Raven test acts as the measurement of non-verbal based cognitive skills. It gives a reliable standardised tool for comparing the individuals’ learning abilities compared to the representative age group.
In each test item, the subject is asked to identify the missing element that completes a pattern. The test contains 60 items that have been divided into five sets (A, B, C, D, E). Each of these groups contains 12 different tasks. The reliability of the test was α = .79 (60 items).
Knowledge test
The knowledge test consisted of 31 items related to the content areas of the school curriculum combined with the AR-solutions and the science exhibition. The questions were piloted two months before the actual pre-knowledge test. Three items were omitted in this phase as irrelevant, as they turned out to be too easy or all too difficult for the majority of the pupils. The answering options to the statements in the test were 1 = true, 2 = untrue and 3 = I don’t know. In the present study, only the number of correct answers was analysed. An example of an item: ‘While the air is heated, the gas molecules start to move more quickly’.
The post-knowledge tests (exactly the same as the pre-tests) were conducted one week after the science exhibition visit. The reliabilities of the pre-test and the post-test were α = .72 and α = .77 (31 items), respectively.
School achievement
The school achievement variable was the summary of the four school grades (Physics, Chemistry, Mathematics and Mother tongue) based on information obtained from the teachers. The pupils were classified into three categories according to their school achievement level:
A+ = Above Average School Achievement (A+; 25% of the pupils in each class),
A = Average School Achievement (A; 50% of the pupils in each class),
A− = Below Average School Achievement (A−; 25% of the pupils in each class).
Learning context: school vs. AR in science centre
The Semantic Differential method (Osgood, Citation1964) was used for measuring pupils’ interest towards learning science in school settings and in the science centre. They had to evaluate 14 pairs of adjectives on a five-point scale (e.g. studying science in school is (5) interesting to (1) boring). The reliability of the school science interest scale (pre-test) was α = .81 (14 items), and α = .88 (14 items) for the science centre science (post-test). The questions were the same, but the pupils had to relate their attitudes in the pre-test with the school science learning context and in the post-test with the science centre learning context.
Analysis methods
We used the path modelling (AMOS 22) to find out how the observed data would support the theoretical assumptions and set hypotheses. However, in order to enhance interpretation of the path-analysis results, it was necessary to start the analysis by other methods. First we compared the simple pre- and post-knowledge test means. The differences between the groups (boys vs. girls, and pupils with low vs. average vs. high school achievement) was tested by GLM Multivariate analysis of variance (MANOVA). In addition, the GLM repeated measures was applied for revealing the significance of the change. The effect size measure was partial η2 (interpretation: >.01 small, >.06 middle, >.14 large (Cohen, Citation1988; Cohen, Miles, & Shevlin, Citation2001).
By the path modelling method, we could then identify the direct and indirect effects of the studied variables, the direction of the effects and, in addition, the size of the effects. Gender, RAVEN, RAI and school achievement were used as covariates to control their effects on the measured pre- and post-knowledge test variables and on situational motivation (only as a post-test) and attitudes towards learning in the school learning context and science centre learning context. The goodness-of-fit evaluation of the models was based on a χ2-test and NFI, CFI (good fit > .90, or better > .95) and RMSEA (reasonable fit < .08, good fit < .05) (see Byrne, Citation2010). Parametric bootstrapping was applied to obtain also the indirect effects and to test invariance of the models of gender and school achievement groups (indicator: χ2-tests the difference between the unconstrained and fully constrained models). In case the models were not invariant, pair-wise comparison of the regression weights (paths) between the models was analysed (indicator: z-test).
Missing values
There were 3.0–5.4% missing values depending on the tested variable. The list-wise method was used to remove the cases with missing values in the SEM, because the bootstrapping method in AMOS requires it.
Results
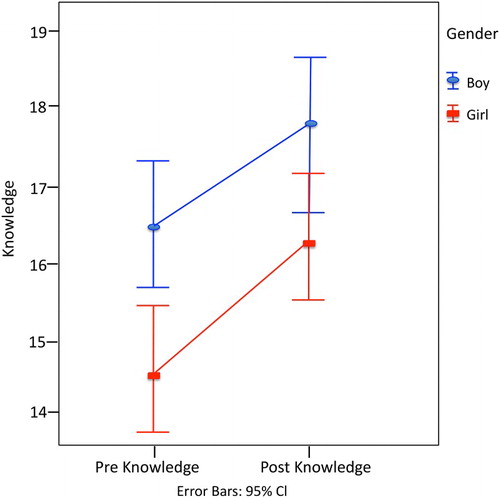
The analysis by the GLM MANOVA showed that there were no interaction effects of the gender and school achievement group on the knowledge-tests, which allows the simple analysis of the main effects of gender and school achievement group separately. The exact statistical descriptives are shown in and . Gender had a significant effect on the pre-knowledge test, [F(df = 1) = 11.83, p < .01, partial η2 = .08], but the effect was non-significant in the post-knowledge test (p = .055; see ).
Figure 3. Pre and post knowledge-test 95% confidence intervals of boys and girls.
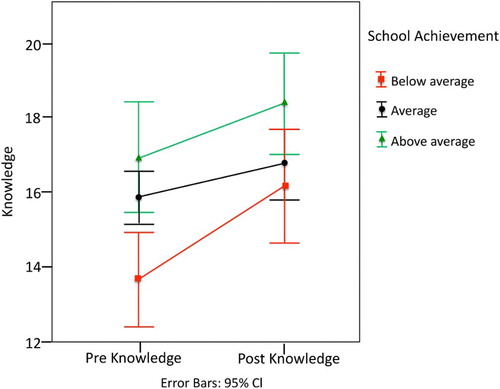
The school achievement group had an effect on the pre-knowledge test [F(df = 2) = 7.37, p < .01, partial η2 = .09], but the effect was non-significant in the post-knowledge test (p = .08). In the pre-knowledge test, the post hoc analyses revealed statistically significant differences between the lowest achieving group and the average (p < .01) and the highest (p < .001; see ).
Figure 4. Pre and post knowledge-test 95% confidence intervals by school achievement group (below average, average, above average).
GLM Repeated measures test showed that overall (with no intervening variables) the change in knowledge was significant [Wilk’s lambda F(df = 1) = 16.79, p < .001, partial η2 = .10]. The predictors of the change were then analysed by the path model presented in in order to take the cognitive and motivational direct and indirect effects into account. The final model with only significant paths fitted the data well (χ2 = 23.02, df = 25, p = .58; NFI = .94, CFI = 1.00, RMSEA = .00).
Figure 5. The final path model.
In the following, the statistical path-model results are explained first. The meaning and conclusions of the results are discussed in the Discussion and conclusions section.
The path-model results are presented by showing the significant direct effects and their directions by arrows in the . In addition, the total effect percentage of all the involved direct effects is shown in relation to each variable in concern. The indirect effects are explained in the text by showing the standardised betas and the significance level. After the path-model, the possible moderation effects are analysed by comparing whether the same model would fit (a) to both the boys and girls, and (b) to the three school achievement groups.
The path model in showed that three variables predicted pre-knowledge directly:Footnote3 school achievement, school learning context and gender. Being a boy (boy coded as 0, girl as 1) predicted higher performance. Gender predicted knowledge also indirectly (β = −.06, p < .01). The exogenous variables together explained a fourth of the variance of the pre-knowledge test. The descriptives of the pre- and the post-tests are presented in and .
RAI and gender predicted interest in learning science in school learning context by explaining 19% of its variance. Situation motivation at the science centre was directly predicted only by the interest in learning science in the school learning context. However, RAI had a small indirect effect on situation motivation, (β = .14, p < .01), and being a boy enhanced it indirectly, as well (β = −.09, p < .01).
Interest in learning science in the science centre learning context was largely and directly predicted by situation motivation. Overall, 71% of its variance was explained by the model and, in addition to situation motivation, it was also indirectly explained by gender (β = −.08, p < .01), RAI (β = .12, p < .01) and school learning context (β = .29, p < .01).
The variables of the model explained 28% of the post-knowledge test results. In addition to the direct effects of the pre-knowledge test and interest in science in the science centre learning context, there were several indirect effects: school achievement (β = .15, p < .01), gender (β = −.16, p < .01), RAI (β = .06, p < .01), school learning context (β = .16, p < .01) and situation motivation (β = .18, p < .01). Cognitive competence as measured by Raven had no direct effects of its own, but in the model its role shows as a significant covariance between it and school achievement.
Next, the possible moderation effects of the gender and school achievement group were tested in order to find out whether the same model would fit across groups. Indeed, the models of boys and girls did differ. The difference between the unconstrained and fully constrained model was χ2 difference = 27.21, df = 7, p = .000. Two individual paths were different. The regression coefficient of situation motivation on interest in learning science in the science centre context was positive in both groups, but the relation was much stronger for boys (z = −4.76, p < .01). The second difference, the regression coefficient of interest in learning science in the science centre context on the post-knowledge test was not significant in the girls’ group, which was in contrast to the boys’ result (z = −.2.24, p < .05).
The models of the school achievement groups were invariant, indicating no significant difference between the unconstrained and fully constrained model (χ2 difference = 18.16, df = 16, p = .315). Pre-knowledge was a significant predictor of post-knowledge in all school achievement groups (A−, p < .001, A p < .001, A+ p < .05), but the paths differed in that the regression coefficient was significantly stronger in the lowest achieving group than in the highest achieving group (z = −2.59, p < .01). Being a boy was related with higher interest in learning science in the school context more in the lowest achieving group than in the average achieving group (z = 2.19, p < .05).
Discussion and conclusions
The question related to the science centres is whether they are capable of managing to orient and enhance the momentary, strong situation motivation into a long-lasting intrinsic motivation. This is also one of the biggest challenges for open learning environments, such as science centres (Falk & Dierking, Citation1992; Rennie, Citation2014; Salmi, Citation2003; Salmi et al., Citation2010; Salmi et al., Citation2015, Salmi et al., Citation2016).
The post-tests were administrated one week after the exhibition visit. Of course, there are several factors which – theoretically – might have caused the learning effect. However, controlling these everyday experiences as variables is nearly impossible. In addition, if the pupils have gained more knowledge from other sources, it is a positive outcome too. This type of extra curriculum learning indicates an increase in intrinsic motivation, which is an important goal for bridging the gap between formal education and informal learning.
Contextual variables predict learning
Previous research shows that positive effects of informal environment on learning gains are not self-evident, but they vary according to the pupils’ prior interest in science and their readiness to take responsibility of setting their own goals (Renninger, Citation2000). The results of this study provide evidence that interest in school science is enhanced by situation motivation in the science exhibition context. This leads to better cognitive learning results in the post-knowledge test, which confirms the first hypothesis (H1). The results also show that in general pupils really learn in the science centre exhibition as their overall science knowledge scores increase after the AR experience. This result is in line with earlier findings (Bacca et al., Citation2014; Radu, Citation2014). We could also show that the learning effect was mid-size.
Two routes resulting to better performance outcomes
The present study indicates that there were two routes which enhance learning as measured by the post-test knowledge scores – a stronger one that depends on prior knowledge and another less effective one that depends on interest and motivation. Knowledge before the exhibition is a moderate direct explainer of the post-test results, but interest in learning in the science centre context predicts the outcomes directly, as well. School achievement, gender and autonomy experience, interest in learning science in the school context and situation motivation during the science centre experience predict the knowledge results indirectly to some extent. By these results, the second (H2) and third hypothesis (H3) were confirmed: both situational motivation and autonomy experience support learning. However, as shown, there are other factors involved, and both indirect and direct effects.
No gender gap after the AR-experience – somewhat different processes
Before the AR exhibition, boys had higher science knowledge scores than girls. However, in the post-tests, gender shows no direct effect anymore, which implies that then the boys and girls learned equally much. By this result, the fourth hypothesis (H4) cannot be confirmed. Thus, the results contradict previously found results.
The higher pre-test results of boys are partly due to the direct and indirect effect of boys’ higher interest in science learning at school. It is of interest to note that being a boy is generally related to having higher direct or indirect effects on all other motivational variables. However, in regard to RAI, being a girl is beneficial, which confirms the fifth hypothesis (H5), and implies that the non-significant difference in the post-knowledge test results between boys and girls can be partly attributable to the higher autonomy experience of girls.
Comparison of the girls’ and boys’ models shows that the coupling with situation motivation and interest in learning in the science centre is very strong among boys, and much more powerful than that of girls. It implies that if boys are situationally motivated and feel inspired there, they become more interested in science centre learning in general. That positive attitude enhances the knowledge-test results afterwards. On the other hand, the lower their situation motivation, the less interesting the informal learning option is perceived, and so these detrimental attitudes result in weaker knowledge outcomes. That attitude has no effect on the knowledge results of girls, but it does on the results of boys. This implies that intervention on the attitudes of boys would be a way to enhance their learning and prevent underachievement. On the other hand, it would be important to find out why there is no link between the girls’ interest in learning in the science exhibition and their learning outcomes.
Low-achievers gained from AR-technology: visual reasoning ability in indirect role
The concrete AR-learning session is most beneficial for the lowest achieving pupils, who do not know as much as the others before the exhibition. This is despite the higher achieving pupils also learning during the exhibition. This is an encouraging result for developing new methods for pupils in drop-out risk, and confirms the sixth hypothesis (H6). However, also the best-performing pupils were receiving new, better learning results. This is also in harmony with the earlier findings (Bacca et al., Citation2014) of personalisation for promoting an inclusive learning using AR is also a growing area of interest. Unlike it was assumed in the seventh hypothesis (H7) based on research literature, visual reasoning scores did not predict knowledge results.
Within the lowest achieving group, high pre-test results predict post-test results more than in the other achievement groups. That is, when a pupil has low school grades but good pre-test knowledge results; those results are of higher importance for the post-test results than they are in the groups that have higher school grades. Higher school achievement predicts neither interest in learning science at school nor the arousal of situation motivation nor interest in the science centre. It is interesting that the path by path analysis reveals that being a boy is related with higher interest in learning science at school more in the lowest achieving group.
AR-technology itself has and will develop rapidly. However, during the last five years the development has concentrated on producing applications for tablets and smartphones. Meanwhile, only a few innovations exist of the optical head-mounted displays, and the few existing glasses are on the proto-type level. The big advantage when comparing head-mounted displays to tablets and screens is that the glasses leave users’ hands free to do concrete things, which is exactly in keeping with Thomas Caudell’s original definition of AR.
Radu (Citation2014) names two weaknesses of using AR in education: (1) ineffective classroom integration and (2) learner differences. But, actually, we use the re-framing approach (Mattila, Citation2001) to change the ‘weaknesses’ into strengths. The ‘ineffective classroom integration’ gives the opportunity for especially out-of-school methods to bridge the gap between formal education and informal learning via AR. Also, the ‘learner differences’ is also an important factor. AR clearly offers new types of learning paths for different types of pupils. AR seems to be turning out to be one of the very few and rare pedagogical solutions that benefits those pupils who are below average in traditional school success and achievement level.
Disclosure statement
No potential conflict of interest was reported by the authors.
Notes
1. AR used for teaching purposes of symbolic associations like the meaning of written words (Freitas & Campos, Citation2008).
2. Focusing attention to a particular channel of information, which might to lead to neglect of relevant events on other channels (Wickens & Alexander, Citation2009).
3. Note! All found effects were positive. However, in case of gender, the minus-sign indicates significant effect of boys, because boy was coded as 0, girl as 1.
References
- Alberts, B. (2009). Making a science of education. Science, 323(5910), 15. doi:10.1126/science.1169941
- Andújar, J. M., Mejías, A., & Márquez, M. A. (2011). Augmented reality for the improvement of remote laboratories: An augmented remote laboratory. IEEE Transactions on Education, 54(3), 492–500. doi: 10.1109/TE.2010.2085047
- Antonioli, M., Blake, C., & Sparks, K. (2014). Augmented reality applications in education. The Journal of Technology Studies, 40(2), 96–107. doi: 10.21061/jots.v40i2.a.4
- Azuma, R. T. (1997). A survey of augmented reality. Presence: Teleoperators and Virtual Environments, 6(4), 355–385. doi: 10.1162/pres.1997.6.4.355
- Bacca, J., Baldris, S., Fabregat, R., Graf, S., & Kinshuk. (2014). Augmented reality trends in education: A systematic review of research and applications. Education Technology & Society, 17(4), 133–149.
- Balling, J., & Falk, J. (1980). A perspective on field trips: Environmental effects on learning. Curator: The Museum Journal, 23(4), 229–240. doi: 10.1111/j.2151-6952.1980.tb01672.x
- Bilek, M., Zemanova, M., & Turcani, M. (2007). ICT for the workday activity of chemistry teachers in the Czech Republic (pp. 29–32). In Information & Communication Technology in Science Education 2007/Proceedings of international scientific practical conference, Siauliai.
- Bower, M., Howe, K., McCredie, N., Robinson, A., & Grover, D. (2014). Augmented reality in education – Cases, places and potentials. Educational Media International, 51(1), 1–15. doi:10.1080/09523987.2014.889400
- Braund, M., & Reiss, M. (2007). What does out-of-school learning offer school science? The Science Education Review, 6, 35–37.
- Buchholz, H., & Brosda, C. (2012). Melting interfaces – Learning in mixed realities a retrospective on transitional objects (pp. 69–80). Proceedings of the EDEN 2011 ‘science center to go’ workshops. Athens: Ellinogermaniki Agogi. ISBN 978-960-473-328-6. www.sctg.eu/materials/sctgo_proceedings_low.pdf
- Byrne, B. (2010). Structural equation modeling with AMOS: Basic concepts, applications, and programming (2nd ed.). New York, NY: Routledge.
- Chiang, T.-H.-C., Yang, S.-J.-H., & Hwang, G.-J. (2014). An augmented reality-based mobile learning system to improve students’ learning achievements and motivations I natural science inquiry activities. Educational Technology & Society, 17(4), 352–365.
- Cohen, J. (1988). Statistical power analysis for the behavioral sciences (2nd ed., p. 174). Hillsdale, NJ: Erlbaum.
- Cohen, J., Miles, J., & Shevlin, M. (2001). Applying regression and correlation: A guide for students and researchers (p. 272). London: Sage.
- Connolly, T., Boyle, E., MacArthur, E., Hainey, T., & Boyle, J. (2012). A systematic literature review of empirical evidence on computer games and serious games. Computers & Education, 59, 661–686. doi: 10.1016/j.compedu.2012.03.004
- Dede, C., & Barab, S. (2009). Emerging technologies for learning science: A time of rapid advances. Journal of Science Education and Technology, 18(4), 301–304. doi: 10.1007/s10956-009-9172-4
- Durik, A. M., Harackiewicz, J. M. (2007). Different strokes for different folks: How personal interest moderates the effects of situational factors on task interest. Journal of Educational Psychology, 99(4), 597–610. doi: 10.1037/0022-0663.99.3.597
- Echeverría, A., Gil, F., & Nussbaum, M. (2011). Classroom Augmented Reality games: A model for the creation of immersive collaborative games in the classroom. Retrieved April 2016 in www.ceppe.cl/images/stories/articulos/tic/2.2-Nussbaum-Classroom-Augmented-Reality-Games-A-model-for-the-creation-of-immersive-collaborative-games-in-the-classroom.pdf
- Falk, J., & Dierking, L. (1992). The museum experience. Washington DC: Whalesbak Books.
- Fenichel, M., & Schweingruber, H. (2010). Surrounded by science: Learning science in informal environments. Board of Science education, Centre of education, Division of behavioral and social sciences and education. Washington, DC: The National Academic Press.
- Freitas, R., & Campos, P. (2008). SMART: A system of Augmented Reality for teaching 2nd grade students (pp. 27–30). In Proceedings of the 22nd British HCI Group annual conference on people and computers: Culture, creativity, interaction, Vol. 2. Swinton, UK.
- Gargalakos, M., Rogalas, D., Lazoudis, A., & Sotiriou, S. (2012). The exploar project: Visualizing the invisible (pp. 57–68). Proceedings of the EDEN 2011 ‘science center to go’ workshops. Athens: Ellinogermaniki Agogi. ISBN 978-960-473-328-6. Retrieved from www.sctg.eu/materials/sctgo_proceedings_low.pdf
- Giallouri, E., Lazuodis, A., & Sotiriou, S. (2012). Assessing the impact of the science center to go system on understanding of quantum interpretation of the double slit experiment. In Proceedings of the EDEN 2011 ‘science center to go’ workshops (pp. 41–46). Athens: Ellinogermaniki Agogi. ISBN 978-960-473-328-6. Retrieved from www.sctg.eu/materials/sctgo_proceedings_low.pdf
- Lazoudis, A., Sotiriou, S., & Salmi, H. (2012). Science center to go: Guide of good practice. (p. (p. 212). Athens, Greece: Ellinogermaniki Agogi. Retrieved from http://www.sctg.eu/materials/SCTGO_GoGP-low.pdf
- Haller, M., Billinghurst, M., & Thomas, B. (2007). Emerging technologies of augmented reality: Interfaces and design ( 399 p). New York, NY: Idea Group.
- Hidi, S., & Renninger, K. A. (2006). The four-phase model of interest development. Educational Psychologist, 41(2), 111–127. doi: 10.1207/s15326985ep4102_4
- Hsiao, K., Chen, N., & Huang, S. (2012). Learning while exercising for science education in augmented reality among adolescents. Interactive Learning Environments, 20(4), 331–349. doi: 10.1080/10494820.2010.486682
- Kamarainen, A., Metcalf, S., Grotzer, T., Browne, A., Mazzuca, D., Tutwiler, M., & Dede, C. (2013). EcoMOBILE: Integrating augmented reality and probeware with environmental education field trips. Computers & Education, 68, 545–556. doi: 10.1016/j.compedu.2013.02.018
- Lamanauskas, V., & Vilkonis, R. (2007). Information communication technologies in natural science education: Situational analysis and prospects in baltic countries. Journal of Baltic Science Education, 6(2), 35–49.
- Larsen, Y., & Bogner, F. (2012). Evaluation of a portable and interactive AR learning system by teachers and students: Augmented reality in education. Proceedings of the EDEN 2011 ‘science center to go’ workshops (pp. 47–56). Athens: Ellinogermaniki Agogi. ISBN 978-960-473-328-6. Retrieved from www.sctg.eu/materials/sctgo_proceedings_low.pdf
- Martin, S., Diaz, G., Sancristobal, E., Gil, R., Castro, M., & Peire, J. (2011). New technology trends in education: Seven years of forecasts and convergence. Computers & Education, 57(2), 1893–1906. doi: 10.1016/j.compedu.2011.04.003
- Mattila, A. (2001). Seeing things in a new light: Reframing in therapeutic conversation. Helsinki: Rehabilitation Foundation, Research Reports 67/2001
- Milgram, P., & Kishino, A. F. (1994). Taxonomy of mixed reality visual displays. IEICE Transactions on Information and Systems, E77-D(12), 1321–1329.
- Nincarean, D., Bilal Alia, M., Halim, N., & Rahman, M. (2013). Mobile augmented reality: The potential for education. Procedia – Social and Behavioral Sciences, 103, 657–664. doi:10.1016/j.sbspro.2013.10.385
- Osborne, J. F., & Dillon, J. (2008). Science education in Europe. London: Nuffield Foundation.
- Osgood, C. E. (1964). Semantic differential technique in the comparative study of cultures. American Anthropologist, 66(3), 171–200. doi: 10.1525/aa.1964.66.3.02a00880
- Owen, M., Owen, S., Barajas, M., & Trifonova, A. (2012). Pedagogical issues and questions from Augmented Reality: Augmented reality in Education (pp. 13–30). Proceedings of the EDEN 2011 ‘science center to go’ workshops. Athens: Ellinogermaniki Agogi. ISBN 978-960-473-328-6. www.sctg.eu/materials/sctgo_proceedings_low.pdf
- Radu, J. (2014). Augmented reality in education: A meta-review and cross-media analysis. Personal and Ubiquitous Computing, 18(6), 1533–1543. doi: 10.1007/s00779-013-0747-y
- Raven, J., Raven, J. C., & Court, J. (2000). Section 3. Standard progressive matrices, 2000 edition. Oxford: Elsfield Hall.
- Raven, J., Raven, J. C., & Court, J. (2003). Manual for Raven’s progressive matrices and vocabulary scales. Oxford: OPP.
- Rennie, L. (2014). Learning science outside of school. In N. Lederman & S. Abell (Eds.), Handbook of research on science education (vol. II, pp. 120–144). London: Routledge.
- Renninger, K. (2000). Individual interest and its implications for understanding intrinsic motivation. In C. Sansone & J.M. Harakiewicz (Eds.), Intrinsic motivation: Controversies and new directions (pp. 373–404). Sand Diego, CA: Academic Press.
- Renninger, K.A., & Hidi, S. (2011). Revisiting the conceptualisation, measurement, and generation of interest. Educational Psychologist, 46(3), 168–184. doi:10.1080/00461520.2011.587723
- Rosenbaum, E., Klopfer, E., & Perry, J. (2007). On location learning: Authentic applied science with networked augmented realities. Journal of Science Education and Technology, 16(1), 31–45. doi: 10.1007/s10956-006-9036-0
- Ryan, R., & Connell, J. (1989). Perceived locus of causality and internalisation: Examining reasons for acting in two domains. Journal of Personality and Social Psychology, 57, 749–761. doi: 10.1037/0022-3514.57.5.749
- Salmi, H. (2003). Science centres as learning laboratories: Experiences of Heureka, the Finnish science centre. International Journal of Technology Management, 25(5), 460–476. doi: 10.1504/IJTM.2003.003113
- Salmi, H. (2011). Evidence of bridging the gap between formal and informal learning through teacher education. Reflecting Education, 8(2), 45–61.
- Salmi, H. (2012). Augmented reality in education. Proceedings of the ‘science center to go’ workshops. Athens: Ellinogermaniki Agogi. ISBN 978-960-473-328-6. www.sctg.eu/materials/sctgo_proceedings_low.pdf
- Salmi, H., Kaasinen, A., & Kallunki, V. (2012). Towards an open learning environment via Augmented Reality (AR): Visualising the invisible in science centres and schools for teacher education. Procedia – Social and Behavioral Sciences, 45, 284–295. doi: 10.1016/j.sbspro.2012.06.565
- Salmi, H., Sotiriou, S., & Bogner, F. (2010). Visualising the invisible in science centres and science museums: Augmented Reality (AR) technology application and science teaching. In N. Karacapilidis (Ed.), Web-based learning solutions for communities of practice: Developing virtual environments for social and pedagogical advancement (pp. 185–208). New York, NY: Information Science Reference. Hershey. ISBN 978-1-60566-711-9.
- Salmi, H., Thuneberg, H., & Vainikainen, M.-P. (2016). How do engineering attitudes vary by gender and motivation? Attractiveness of outreach science exhibition in four countries. European Journal of Engineering Education, 18(1), 2–22. doi:10.1080/03043797.2015.1121466
- Salmi, H., Vainikainen, M-P., & Thuneberg, H. (2015) Mathematical thinking skills, self-concept and learning outcomes of 12-year-olds visiting a mathematics science centre exhibition in Latvia and Sweden. Journal of Science Communication, 14(4), 1–19.
- TanWee Hin, L. & Subramaniam, R. (2003). Science and technology centres as agents for promoting science culture in developing nations. International Journal of Technology Management, 25(5), 413–426. doi: 10.1504/IJTM.2003.003110
- Vainikainen, M-P., Salmi, H., & Thuneberg, H. (2015). Situational interest and learning in a science centre mathematics exhibition. Journal of Science Communication, 14(4), 1–19.
- Vilkoniené, M. (2009). Influence of augmented reality upon pupil’s knowledge about Human Digestive System: The Results of the Experiment. Online Submission, Retrieved from ERIC database.
- Vilkoniené, M., Lamanauskas, V., & Vilkonis, R. (2008). Pedagogical evaluation of the teaching/learning platform based on augmented reality technology: The opinion of science teachers and the experts providing assistance with teaching/learning (pp. 407–412). Proceedings of Internat. Scientific Practical Conference ‘Science Education Technologic – 2008’.
- Wagner, T. (2008). The global achievement gap. New York, NY: Basic Books.
- Wickens, C., & Alexander, A. (2009). Attentional tunneling and task management in synthetic vision displays. The International Journal of Aviation Psychology, 19(2), 182–199. doi: 10.1080/10508410902766549