
Abstract
Alantolactone (Ala), a major sesquiterpene lactone extracted from Inula helenium, exerts potent anti-tumour activities in various cancers. However, the underlying mechanism of such activities is still ambiguous. This study focused on evaluating the anti-tumour effects and molecular mechanisms of Ala on HepG2 cells. Our results demonstrated that Ala might inhibit cellular proliferation, induce G2/M phase arrest and apoptosis in HepG2 cells. Specifically, this study confirmed that Ala induced G2/M phase arrest by upregulating p21, downregulating cyclin A1 and cyclin B1, and promoting cellular apoptosis by increasing the expression of cleaved caspase-3 and PARP. Furthermore, Ala caused an increase in reactive oxygen species (ROS) level and inhibition of ROS production significantly prevented Ala-induced apoptosis. Interestingly, the accumulation of ROS, in turn, suppressed the downstream AKT signalling. Finally, mitophagy of Ala-treated HepG2 cells was observed by Mito/Lyso staining. Mitophagy was significantly inhibited by downregulation of the expression of PINK1 and Parkin proteins. The inhibition of mitophagy by a mitophagy inhibitor was found to markedly enhance Ala-mediated apoptosis and growth inhibition in HepG2 cells. Consequently, Ala induced cellular apoptosis via ROS-mediated suppression of AKT signalling and inhibition of PINK1-mediated mitophagy. Thus, Ala has potential to be used for the treatment of liver cancer.
Keywords:
Introduction
Hepatocellular carcinoma (HCC) is considered highly malignant and has an extremely poor prognosis. It is the third most frequent cause of cancer-related death worldwide [Citation1]. Presently, the available therapeutic options for HCC include surgery, radiotherapy, chemotherapy, immunotherapy, targeted therapy and a combination of these therapies based on the stage of cancer. Among these, surgery and chemotherapy remain the most common treatment option for early stage (A) and intermediate stage (B) cancer, respectively [Citation2]. However, resistance to multidrug therapy and chemotherapy lead to a high frequency of unfavourable therapeutic effects resulting in poor overall survival and recurrence rates [Citation3,Citation4]. Thus, it is necessary to explore novel, less toxic and high-efficiency therapeutic agents with anti-cancer activities against HCC.
Currently, natural products are crucial resources for the development of small molecules against cancer, such as paclitaxel [Citation5], resveratrol [Citation6] and camptothecin [Citation7]. The sesquiterpene lactone compound alantolactone (Ala) is mainly extracted from the roots of Inula helenium L () [Citation8]. Ala has diverse pharmacological effects, including anti-inflammatory, anti-bacterial and anti-fungal effects [Citation9,Citation10]. In recent years, Ala has attracted the attention of researchers because of its potential anti-cancer activities against various human cancer cells through multiple mechanisms [Citation11]. A recent study reported that Ala could trigger the mitochondrial apoptotic pathway by Bcl-2 downregulation and caspase-9 activation in liver cancer cells [Citation12]. Interestingly, recent studies have also shown that Ala induced reactive oxygen species (ROS)-mediated apoptosis in U87 glioblastoma and HepG2 liver cancer cells [Citation13,Citation14], implicating apoptosis as an emergency response to ROS production. In addition, Ala has been proposed to induce cell cycle arrest in human liver cancer cells [Citation12]. However, the underlying molecular mechanism through which Ala induces anti-cancer effects and apoptosis in HCC remains to be elucidated.
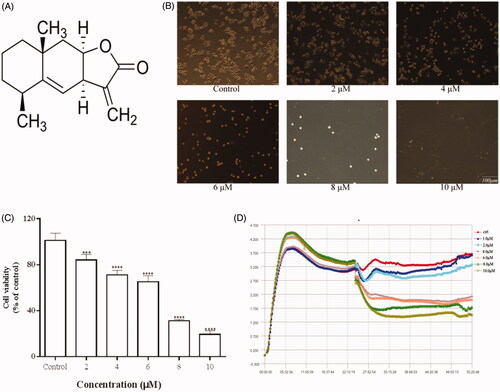
Figure 1. Effects of Ala on the viability of HepG2 cells. (A) Chemical structure of Ala. (B) Morphological changes of HepG2 cells were observed under a phase contrast microscope after treatment with different concentrations of Ala for 24 h. (C) and (D) HepG2 cells were treated with indicated concentrations of Ala for 24 h, and the viability was estimated by CCK-8 and RTCA assay, respectively. ***p < .001 and ****p < .0001 as compared to the control group.
Mitophagy is a well-studied type of cargo-specific autophagy, which is responsible for the selective removal of mitochondria. It involves different pathways to recognize superfluous or defective organelles and target them to form autophagosomes, including Atg32 in yeast, NIX/BNIP3 during red blood cell differentiation and PINK1-Parkin during damaged mitochondria in many types of cells [Citation15]. Under stress, mitophagy attempts to maintain cellular homeostasis and protect cell from death [Citation16]. Recent works have linked inhibition of PINK1/Parkin signalling pathway-mediated mitophagy priming with the sensitivity of various anti-tumour drugs [Citation17] and anti-tumour drugs-induced cellular apoptosis with inhibition of mitophagy [Citation18]. Therefore, mitophagy is one of the cell survival mechanisms that plays a critical role in many physiological processes, especially tumourigenesis. The aim of this study was to (a) characterize the role of Ala in proliferation, cycle arrest and apoptosis in HepG2 cells, a potential process that has been overlooked, and (b) investigate whether ROS/AKT signalling and PINK1-mediated mitophagy were involved in Ala-triggered apoptosis in HepG2 cells.
Materials and methods
Reagents and antibodies
Ala, mitochondrial division inhibitor 1 (Mdivi-1) and N-acetyl cysteine (NAC) were purchased from Sigma-Aldrich (St. Louis, MO). The antibodies were obtained from Cell Signalling Technology (Beverly, MA) (including Parkin, PINK1, PARP, caspase-3, p-AKT, AKT and β-actin) and R&D Systems (Minneapolis, MN) (including Cyclin A1, Cyclin B1 and p21), respectively. Anti-rabbit and anti-mouse secondary antibodies were obtained from Abclonal (Abclonal, Wuhan, China). DAPI was purchased from KeyGEN (KeyGEN BioTECH, Jiangsu, China). Mito Tracker Red and LysoTracker Yellow were obtained from Thermo Fisher (Thermo Scientific, Waltham, MA), unless otherwise indicated.
Cell culture
Human hepatoma HepG2 cell line was kindly provided by Stem Cell Bank, Chinese Academy of Sciences (Shanghai, China). The cells were incubated in Dulbecco’s modified Eagle medium (DMEM) (Procell, Wuhan, China) supplemented with 10% foetal bovine serum (FBS) (Procell, Wuhan, China), and 1% penicillin/streptomycin at 37 °C in a humidified atmosphere containing 5% CO2.
Cell viability assay
The cell viability was monitored using the iCELLigence system (Roche Diagnostics GmbH, Basel, Switzerland) and CCK-8 assay.
For continuous monitoring of changes in cell viability, HepG2 cells (1 × 10⁴ cells/well) were seeded in an E-plate 8 (Roche Diagnostics GmbH, Switzerland) and incubated for 30 min at room temperature, after which each E-plate was placed onto the real-time cell analyzer (RTCA) station. The cells were grown overnight at 37 °C in the presence of 5% CO2 and impedance was measured every 10 min prior to treatment as previously described [Citation19]. Further, the wells were treated with different concentrations of Ala (1, 2, 4, 6, 8 and 10 μM) and serum-free medium (blank), observed every 10 min during 24 h. The obtained data were analyzed using RTCA software (ACEA Biosciences, Hangzhou, China).
The cell viability was detected using cell counting kit-8 (ck04-20, Dojindo, Japan). Briefly, the cells were seeded in a 96-well plate at a density of 1 × 10⁴ cells/well overnight and then treated with different concentrations of Ala for 24 h. The cells were incubated with fresh medium (100 μL) added with CCK-8 solution (10 μL) for 1.5 h at 37 °C. The absorbance was recorded using a microplate reader at an optical density (OD) of 450 nm. The measured OD values were converted into cell viability as follows: survival ratio (%)=(A treatment/A control)×100. Furthermore, the morphological changes in HepG2 cells treated with various concentrations of Ala for 24 h were also observed using an inverted microscope (Olympus, Tokyo, Japan).
Flow cytometry assay for cell cycle detection
The HepG2 cells were seeded in 6-well plates and treated with different concentrations of Ala (0, 4, 6 and 8 μM) for 24 h and the cells without any added Ala were used as the control. Based on treatment with Ala and suspending with DPBS, the cells were collected and fixed with 70% ethanol at 4 °C for 2 h. After washing twice with DPBS, the cells were stained with a solution containing 100 μL RNase A and 400 μL PI for 30 min in the dark at room temperature using Cell Cycle Detection Kit (KeyGEN BioTECH, Jiangsu, China), and at least 10,000 cells were recorded for each sample. The percentage of cells in G1/G0, S and G2/M phases was detected by FACStar flow cytometry (FACSCalibur, San Jose, CA) equipped with the Modfit software.
DAPI staining and flow cytometry for cellular apoptosis assay
DAPI staining was performed to assess HepG2 cellular apoptosis. The cells were seeded in 6-well plates and cultured overnight. After stimulating with a medium containing Ala (0, 4, 6 and 8 μM) for 24 h, the cells were stained with DAPI for around 15 − 30 min and washed twice with DPBS and then observed immediately under an IX53 fluorescence microscope (Olympus, Tokyo, Japan). For evaluating cellular apoptosis, after seeding and treating with different concentrations of Ala, the HepG2 cells were collected into tubes and were suspended in DPBS. Briefly, for apoptosis assay, Annexin V-FITC/PI Apoptosis Detection Kit (KeyGEN BioTECH, Jiangsu, China) was used for flow cytometry as described earlier [Citation20]. Apoptosis and necrotic cells were analyzed by a FACStar flow cytometer using the FlowJo version 7.6 software (FlowJo LLC, Ashland, OR, USA) and a minimum of 10,000 events was recorded for each sample.
Estimation of reactive oxygen species (ROS) level
To determine the level of ROS, an ROS assay kit (Jiancheng Bioengineering Institute, Nanjing, China) was used. Specifically, HepG2 cells were incubated with the indicated concentrations of Ala with or without NAC (10 μM) for 24 h. The cells were then washed in DPBS and incubated with 30 μM H2DCFHDA at 37 °C for 30 min. The stained cells were washed, digested and resuspended in DPBS and analyzed by FACStar flow cytometer. The fluorescence of the stained cells was analyzed using flow cytometry and each group had more than 10,000 individual cells. The mean fluorescence intensity was analyzed using FlowJo version 7.6 software.
Confocal microscopy
HepG2 cells were grown in 35-mm Petri dishes (NEST, GBD-35–20) having a glass bottom. After incubation for 24 h, the cells reached around 60 − 80% confluence following treatment with Ala for 24 h. When required, mitochondria were stained with 100 nM Mito Tracker Red for 30 min and then the lysosomes were labelled with 200 nM LysoTracker Yellow for 10 min at 37 °C. After incubation, the cells were washed with DPBS twice and fixed with 4% paraformaldehyde and then imaged using Olympus Confocal Laser Scanning Microscopy (Olympus, Tokyo, Japan). The results were finally analyzed by FV10 software (Olympus, Tokyo, Japan).
Protein extraction and western blot
To detect the expression of the related proteins, HepG2 cells were lysed in 1% sodium dodecyl sulphate (SDS). The lysed solution was centrifuged at 12,000 rpm for 10 min at 4 °C. Subsequently, the soluble lysates (around 20 − 40 μL) were subjected to around 10 − 12% sodium dodecyl sulphate-polyacrylamide gel electrophoresis (SDS-PAGE), transferred onto nitrocellulose membranes (Amersham Biosciences, Piscataway, NJ) and then blocked with 5% skim milk in Tris-buffered saline with Tween (TBST) for at least 2 h at room temperature. The membranes were incubated with the respective primary antibodies [caspase-3 (1:1000), PARP (1:1000), cyclin A1 (1:1000), cyclin B1 (1:1000), p21 (1:500), AKT (1:2000), p-AKT (1:1500), PINK1 (1:1000), Parkin (1:1000) and β-actin (1:4000)] for at least overnight at 4 °C, followed by incubation with the corresponding secondary antibodies (dilution, 1:20,000) for a minimum of 2 h at room temperature. After washing with TBST three times, the immune-reactive bands were exposed to SuperSignalTM ELISA Femto Maximus Sensitivity Substrate (Thermo Scientific, Waltham, MA). The quantification of the protein bands was performed using the Image J software.
Statistical analyses
All experimental data were represented as the mean ± standard deviation and each experiment was repeated for at least three times. One-way analysis of variance followed by Dunnett’s or Tukey’s post hoc tests was used. All analyses were performed using GraphPad Prism Software version 7.0 (GraphPad Software Inc., La Jolla, CA). A p value of <.05 was considered statistically significant.
Results
Ala inhibited proliferation of HepG2 cells in vitro
The cytotoxic effects of Ala were first evaluated by observing the morphological changes in HepG2 cells under a phase contrast microscope, which showed a significant decrease in the number of cells after Ala treatment as compared to the control group (). Meanwhile, the cytotoxic activity of Ala against HepG2 cells was also investigated by determination of cell viability using CCK-8 assay. As shown in , Ala dramatically inhibited cell proliferation in a dose-dependent manner and the IC50 value was found to be 7 μM at 24 h. To further understand the kinetics of Ala cytotoxicity in HepG2 cells, we performed real-time cell proliferation analysis using the xCELLigence system assay. HepG2 cells were treated with various concentrations (0, 1, 2, 4, 6, 8 and 10 μM) of Ala for 24 h. The results showed that Ala significantly suppressed the growth of human HepG2 cells in a dose and time-dependent manner ().
Ala induced cell cycle arrest at the G2/M phase in HepG2 cells
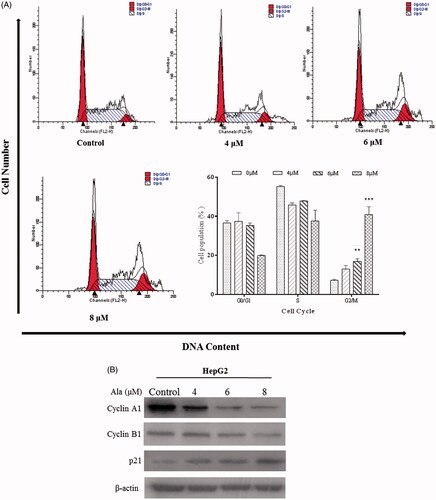
G2/M phase cell cycle arrest was firstly observed in HepG2 cells exposed to Ala as compared to the control group (). Furthermore, Ala induced G2/M cell cycle arrest in a dose-dependent manner and the percentage of cells accumulated in the G2/M phase was enhanced by 13.45%, 34.65% and 42.41% in the 4, 6 and 8 μM groups, respectively, as compared to that in the control group (7.42%, p < .001). Additionally, we performed western blot analysis to determine the cell cycle regulatory proteins involved in the action of Ala in HepG2 cells. As shown in , the expression of cyclin A1 and cyclin B1 decreased, whereas p21 expression significantly increased. These results suggested that Ala effectively blocked proliferation by inducing G2/M phase arrest in HepG2 cells.
Figure 2. Ala induced G2/M phase arrest in HepG2 cell line. (A) HepG2 cells were treated with 0, 4, 6 and 8 μM of Ala for 24 h. Subsequently, the relative number of cells in each cell cycle was determined by flow cytometry. The experiment was repeated three times, and the representative results are presented. **p < .01 and ***p < .001 as compared to the control group (B) HepG2 cells were treated with 0, 4, 6 and 8 μM of Ala for 24 h, and the protein expression of cyclin A1, Cycle B1 and p21 was detected by western blot with β-actin as internal control.
Ala induced apoptosis in HepG2 cells
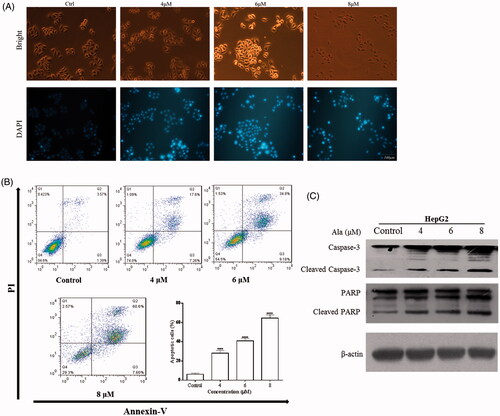
DAPI staining was used to observe the apoptotic morphology of HepG2 cells. As exhibited in , Ala treatment caused typical apoptotic nuclear changes as demonstrated by fragmentation nuclei and condensed chromatin (shown as intense blue fluorescence). In addition, HepG2 cells were treated with different concentrations (0, 4, 6 and 8 μM) of Ala for 24 h and harvested for flow cytometric analysis. Following treatment with 4, 6 and 8 μM Ala, the percentage of apoptotic cells was 24.86%, 43.98% and 68.2%, respectively, which was significantly higher than that in the control group (4.96%, p < .0001). The representative results were presented in . To further probe into the underlying apoptosis mechanism, the expression of apoptotic-related proteins, such as PARP and Caspase-3 in the Ala-treated cells was estimated by western blot. The data revealed that Ala effectively increased the expression of PARP and Caspase-3 cleavage as compared to the control group (). These data demonstrated that Ala induced apoptosis of HepG2 cells in a dose-dependent manner.
Figure 3. Ala-induced apoptosis in HepG2 cells. (A) DAPI staining was used to determine the nuclear morphological alterations of HepG2 cells (scale bar, 100 μm). (B) HepG2 cells were treated with 0, 4, 6 and 8 μM of Ala for 24 h. Ala-induced apoptosis in HepG2 cells was analyzed by V-FITC/PI staining and flow cytometry. The results were representative of three independent experiments having similar results. ****p < .0001 as compared to the control group. (C) The protein expression of Caspase-3 and PARP cleavage was detected by western blot after treatment with 0, 4, 6 and 8 μM of Ala, with β-actin as internal control.
Ala-induced cell apoptosis involving the suppression of the p-AKT pathway regulated by ROS production
Several studies have shown that Ala induced apoptosis in various cell lines through the generation of ROS [Citation13,Citation21,Citation22]. To elucidate the possible role of ROS in Ala-induced HepG2 cellular apoptosis, the effects of Ala on the generation of ROS in HepG2 cells were firstly investigated. The cells were exposed to different concentrations of Ala (0, 4, 6 and 8 μM) for 24 h and analyzed for the accumulation of ROS by flow cytometry following staining with DCFH-DA. showed that Ala resulted in a significant increase in intracellular ROS in a concentration-dependent manner. To further determine the role of ROS in Ala-mediated apoptosis and proliferation of HepG2 cells, ROS scavenger NAC was used. As shown in , pre-treatment with NAC [Citation23] for 1 h remarkably attenuated Ala-induced apoptosis and growth inhibition in HepG2 cells. Consistent with the CCK-8 and flow cytometric assay results, western blot analysis revealed that pre-treatment with NAC decreased the expression of pro-apoptotic proteins cleaved Caspase-3 and PARP (). Thus, Ala significantly triggered ROS-mediated apoptosis in HepG2 cells.
Figure 4. Ala induced apoptosis via ROS in HepG2 cell line. (A) Levels of intracellular ROS. HepG2 cells were treated with 0, 4, 6 and 8 μM of Ala for 24 h. ROS were determined with fluorescence dye DCFH-DA by flow cytometry. The results were representative of three independent experiments having similar results. ****p < .001 as compared to the control group. (B) and (C) The cells were pre-incubated with NAC (10 mM) for 1 h and then 6 μM of Ala was added to the cells for 24 h. Flow cytometry and CCK-8 were used to assess the change of apoptosis and cell viability in HepG2 cells. The results were representative of three independent experiments having similar results. **p < .01 and ****p < .001 as compared to Ala treatment alone. (D) The cells were pre-incubated with NAC (10 mM) for 1 h and then treated with 6 μM of Ala for 24 h. The expression of apoptosis-related proteins caspase-3 and PARP cleavage were analyzed by western blot with β-actin as internal control.
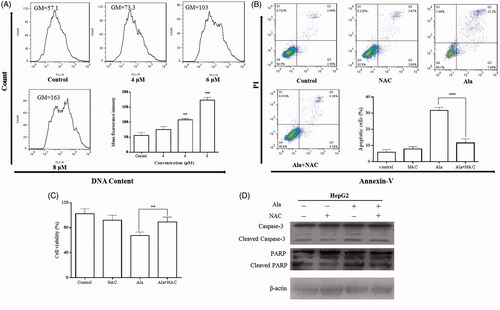
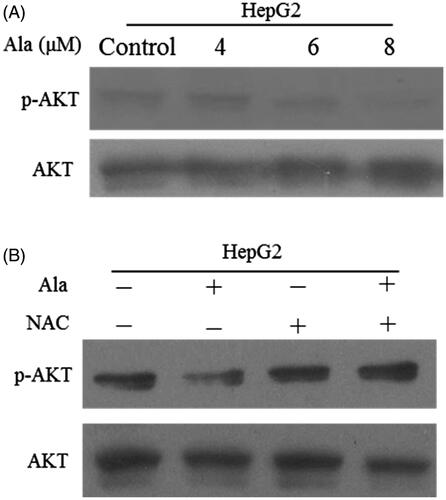
Principally, as one of the downstream targets of ROS, the AKT pathway plays an important role in anticancer drug-induced apoptosis [Citation24]. Western blot was performed to evaluate the effects of Ala on the expression of AKT and p-AKT proteins. Our results showed that p-AKT expression was attenuated in Ala-treated HepG2 cells (). To further confirm whether ROS regulated Ala-mediated AKT pathway, the cells were pre-treated with NAC along with Ala and the results revealed that Ala combined with NAC increased the expression of p-AKT as compared to Ala alone (). Taken together, these results demonstrated that Ala-induced HepG2 cellular apoptosis through ROS/AKT pathway.
Figure 5. Ala inhibited AKT signalling pathway through ROS generation. (A) The protein expression of p-AKT and AKT was detected by western blot after treatment with 0, 4, 6 and 8 μM of Ala. (B) The cells were pre-incubated with NAC (10 mM) for 1 h and then treated with 6 μM of Ala for 24 h. The expression of p-AKT and AKT protein was analyzed by western blot with AKT as internal control.
Mitophagy inhibition enhanced Ala-induced apoptosis in HepG2 cells
Notably, previous studies have shown that mitophagy played an essential role in drug-induced cellular apoptosis [Citation18,Citation25]. To assess the occurrence of mitophagy after treatment with Ala in HepG2 cells, Mito Tracker and LysoTracker staining were performed and the cells were examined by confocal microscopy. As shown by the number of Mito-Lyso punctate dots, Ala treatment led to a remarkable decrease of stained autophagic vesicles in a concentration-dependent manner (). Meanwhile, western blot was performed to explore the expression of mitophagy-related proteins. As illustrated in , Ala dose-dependently triggered a significant reduction of PINK1 and Parkin expression at the protein level in HepG2 cells.
Figure 6. Mitophagy inhibition enhanced Ala-induced apoptosis in HepG2 cells. (A) The protein expression of PINK1 and Parkin was detected by western blot after treatment with 0, 4, 6 and 8 μM of Ala. (B) Ala-inhibited mitophagy was detected by MitoTracker and LysoTracker in HepG2 cells, and analyzed by laser confocal microscope. (C) The cells were pre-treated with 10 mM Mdivi-1 for 1 h and then stimulated with 6 μM of Ala for 24 h. The annexin-V-FITC/PI stained cells were evaluated by flow cytometry. (D) Pre-incubated with Mdivi-1 (10 mM) for 1 h, HepG2 cells following treatment with 6 μM Ala for 24 h. CCK-8 assay was used to assess the viability of HepG2 cells. The results were representative of three independent experiments having similar results. **p < .01 and ****p < .0001 as compared to Ala treatment alone.
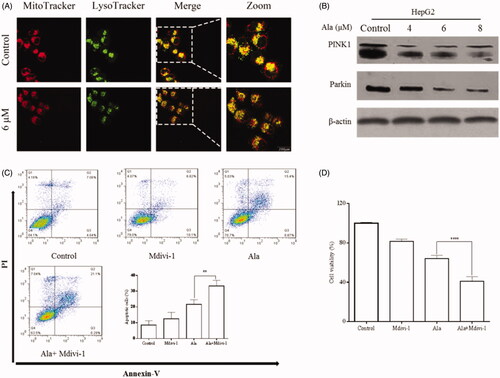
To further clarify the involvement of mitophagy in Ala-mediated apoptosis, we evaluated the effects of Mdivi-1, a mitophagy inhibitor, along with Ala. As shown in , Ala combined with Mdivi-1 led to increase apoptosis as compared to Ala or Mdivi-1 alone. In addition, the influence of Ala along with Mdivi-1 on cell viability was also assessed and Ala-mediated cell death was markedly enhanced in the presence of Mdivi-1 (). Collectively, these results demonstrated that Ala promoted apoptosis in HepG2 cells through the inhibition of PINK1/Parkin-mediated mitophagy.
Discussion
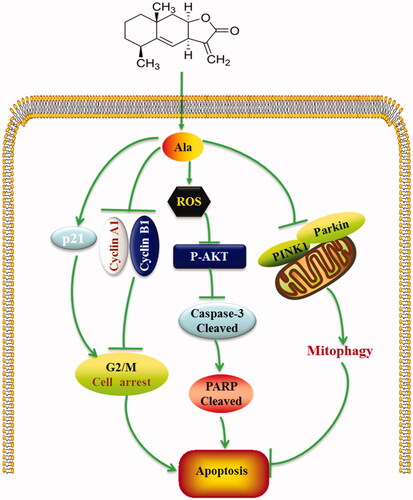
The present research was conducted to elucidate the underlying anti-tumour mechanisms of Ala in HepG2 cells. To evaluate the anti-tumour activities of Ala on the liver cancer cells, HepG2 cell line was used as a model. We found that Ala reduced proliferation through inducing apoptosis and G2/M phase arrest in HepG2 cells. We further confirmed that Ala induced cellular apoptosis by elevating ROS production and inhibiting AKT signalling in HepG2 cells. We also identified that PINK1-related mitophagy was involved in the regulation of apoptosis (). Based on these findings, we preliminarily explored the effects of Ala in vivo and on the SMMC-7721 cell line. In contrast to the HepG2 cell line, we found that Ala induced G0/G1 cell cycle arrest and MAPK signalling pathway in SMMC-7721 cells and exhibited a subtle difference of molecular mechanisms in Ala-treated tumour cell lines. Administration of Ala in vivo reduced tumour volume compared to the normal nude mice, which was consistent with our in vitro results (data not shown).
Figure 7. A proposed mechanism of Ala-induced apoptosis in HepG2 cells.
Cell cycle arrest is considered to be an essential mechanism resulting in inhibition of cell growth [Citation26]. Dysregulation of cell cycle phase is a common characteristic of tumours. Studies have shown that cell cycle progression is controlled by the activation of CDKs complexed with their activator cyclins which play vital roles in the S-G2 and G2-M transition [Citation27,Citation28]. Furthermore, Ala also has been shown to inhibit cell cycle progression in HepG2 and human breast cancer cells and human erythroleukaemia [Citation12,Citation29]. Lei et al. and Cui et al. reported that Ala could induce a concomitant accumulation of HepG2 and MDA-MB-231 cells in the G2/M phase [Citation12,Citation30]. Our findings implied that HepG2 cells exposed to Ala inhibited cell cycle progression in G2/M phase arrest by flow cytometric analysis. The expression of cyclin A1 and cyclin B1 in Ala-treated cells showed a gradual decline in a dose-dependent manner, whereas the upregulation of p21 was noted. It suggested that certain cell cycle regulators including cyclin A1, cyclin B1 and p21 played essential roles in Ala-mediated G2/M cycle arrest in HepG2 cells.
Apoptosis is regarded as the most pervasive form of programmed cell death. It is a physiological process that results in additional damage to the abnormal cells and tissues surrounding a tumour [Citation31]. Thus, the induction of apoptosis is regarded to be an effective strategy in cancer treatment. Currently, there are only a few reports depicting that Ala induces apoptosis of HepG2 cells through the modulation of Bcl-2 family proteins, mitochondrial dysfunction, GSH depletion and STAT3 signal pathway [Citation12,Citation14]. The caspase family proteins are vital to apoptotic activation and cascade while apoptosis is triggered and the activated effector caspases stimulate downstream molecules, such as PARP [Citation32]. Recent studies have demonstrated that activation of cleaved Caspase-3 and PARP by Ala resulted in apoptosis in HepG2 cells [Citation12,Citation14]. In our study, Ala exhibited inhibitory effects on HepG2 cell viability in a dose-dependent manner. The results obtained from DAPI staining revealed that Ala-treated HepG2 cells exhibited classical morphological characteristics of apoptosis. Flow cytometric analysis also showed that Ala could induce apoptosis of HepG2 cells. We further found that Caspase-3 and PARP cleavage were activated after Ala treatment, which confirmed the apoptosis-inducing effect of Ala on HepG2 cells. Our study indicated that Ala might be a promising candidate against liver cancer acting through a caspase-dependent apoptosis pathway.
Cellular apoptosis is strictly controlled by complex network of signalling pathways, including PI3K/AKT, MAPKs, NF-κB and ROS pathways [Citation33]. ROS is regarded as one of the important mediators of the apoptotic signalling pathway which is associated with many human diseases, especially cancer [Citation34]. Accordingly, ROS have lately attracted extensive scientific interest because of its fundamental role in anti-tumour activities and apoptosis. A study by Xu et al. found that corilagin markedly increased ROS production and triggered apoptosis in gastric cancer cells [Citation35]. Ding et al. also reported that Ala-mediated ROS overload triggered the activation of the intrinsic apoptosis pathway in colorectal cancer cells [Citation21]. Consistently, we have demonstrated that Ala dose-dependently induced ROS generation. Direct involvement of ROS overproduction was also involved in Ala-mediated HepG2 cellular apoptosis. On the other hand, Ala-induced cellular apoptosis was significantly inhibited when HepG2 cells were pre-treated with NAC. The data suggested that ROS production might be involved in Ala-induced cellular apoptosis considering that ROS has been frequently implicated in regulating apoptosis in various cells through the modulation of the AKT pathway. For instance, Lai et al. found that ROS was involved in Brucein D-mediated apoptosis and down-regulation of the AKT pathway [Citation36]. According to Pei et al., treatment of A549 cells with Oenothein B significantly suppressed AKT pathway activation by elevating ROS level [Citation37]. We further determined the possibility of whether the AKT pathway was involved in Ala-induced HepG2 cellular apoptosis. As expected, the results showed that ROS could suppress the activation of p-AKT in HepG2 cells. Moreover, the production of ROS in response to Ala was supported by the finding that pre-treatment with NAC promoted ROS-mediated p-AKT activation and then attenuated the inhibitory effects of Ala on the AKT pathway. Thus, induction of p-AKT activation may contribute to the acceleration of apoptosis partly due to Ala treatment in HepG2 cells, suggesting that the ROS/AKT pathway may also participate in Ala-induced apoptosis.
Mitophagy as one type of the cargo-specific autophagy mainly mediates selective removal of damaged mitochondria [Citation15]. Overwhelming pieces of evidence have implicated that multiple signalling pathways were involved in mitophagy activation, such as the PINK1-dependent pathway [Citation15,Citation38]. Remarkably, previous studies have confirmed that mitophagy played an essential role in apoptosis in several types of cancer [Citation39,Citation40]. Augmented mitophagy eliminates the damaged mitochondria and protects the apoptotic signalling from amplification. In HepG2 cells, matrine was found to repress mitophagy activity by blocking the PINK1/Parkin pathway and activating apoptosis [Citation25]. Additionally, activated PINK1/Parkin-triggered mitophagy exerted a significantly protective effect against 1,4-benzoquinone-induced apoptosis in HL-60 cells [Citation41]. In this regard, the results obtained from Mito/Lyso staining exhibited inhibition of mitophagy in the Ala-treated HepG2 cells. The PTEN-induced putative kinase 1 (PINK1)/Parkin-mediated pathway is considered as one of the major mitophagy-initiating event [Citation42]. To verify whether the PINK1/Parkin pathway was also involved in Ala-induced mitophagy, the protein expression of PINK1 and Parkin was estimated. We found that the expression of both proteins was significantly reduced in response to Ala treatment, suggesting that Ala-inhibited mitophagy was mediated through the suppression of the PINK1/Parkin pathway. Meanwhile, compared to Ala-treatment alone, inhibition of mitophagy by Mdivi-1 further promoted Ala-induced inhibition of the proliferation in HepG2 cells. These data indicated that Ala could stimulate apoptosis through perturbing PINK1-dependent mitophagy in HepG2 cells.
Conclusively, this is the first study to demonstrate that the anti-cancer Chinese traditional medicine Ala not only had specific anti-cancer effects but also could inhibit the proliferation of HepG2 cells and induce apoptosis and cycle arrest in vitro through the accumulation of ROS and suppression of the AKT signalling pathway. Additionally, the present research assessed the function of PINK1/mitophagy inhibition which is involved in the regulation of Ala-mediated apoptosis. To validate the rational use of Ala in the prevention of liver cancer, further exploration of the effects of Ala in in vivo models is necessary. These findings may provide promising therapeutic strategies for utilizing Ala-mediated apoptosis for the prevention and treatment of hepatic carcinoma in the future.
Disclosure statement
The authors declare that they have no competing interests.
Additional information
Funding
Related Research Data
References
- Ferlay J, Soerjomataram I, Dikshit R, et al. Cancer incidence and mortality worldwide: sources, methods and major patterns in GLOBOCAN 2012. Int J Cancer. 2015;136:E359–E386.
- Llovet JM, Zucman-Rossi J, Pikarsky E, et al. Hepatocellular carcinoma. Nat Rev Dis Primers. 2016;2:16018.
- Worns MA, Galle PR. HCC therapies-lessons learned. Nat Rev Gastroenterol Hepatol. 2014;11:447–452.
- Zhu AX. Systemic treatment of hepatocellular carcinoma: dawn of a new era? Ann Surg Oncol. 2010;17:1247–1256.
- Kim SB, Dent R, Im SA, et al. Ipatasertib plus paclitaxel versus placebo plus paclitaxel as first-line therapy for metastatic triple-negative breast cancer (LOTUS): a multicentre, randomised, double-blind, placebo-controlled, phase 2 trial. Lancet Oncol. 2017;18:1360–1372.
- Wahab A, Gao K, Jia C, et al. Significance of resveratrol in clinical management of chronic diseases. Molecules. 2017;22:1329.
- Gigliotti CL, Ferrara B, Occhipinti S, et al. Enhanced cytotoxic effect of camptothecin nanosponges in anaplastic thyroid cancer cells in vitro and in vivo on orthotopic xenograft tumours. Drug Deliv. 2017;24:670–680.
- Trendafilova A, Chanev C, Todorova M. Ultrasound-assisted extraction of alantolactone and isoalantolactone from Inula helenium roots. Phcog Mag. 2010;6:234–237.
- Meng JC, Hu YF, Chen JH, et al. Antifungal highly oxygenated guaianolides and other constituents from Ajania fruticulosa. Phytochemistry 2001;58:1141–1145.
- Chun J, Choi RJ, Khan S, et al. Alantolactone suppresses inducible nitric oxide synthase and cyclooxygenase-2 expression by down-regulating NF-kappaB, MAPK and AP-1 via the MyD88 signaling pathway in LPS-activated RAW 264.7 cells. Int Immunopharmacol. 2012;14:375–383.
- Yao Y, Xia D, Bian Y, et al. Alantolactone induces G1 phase arrest and apoptosis of multiple myeloma cells and overcomes bortezomib resistance. Apoptosis. 2015;20:1122–1133.
- Lei JC, Yu JQ, Yin Y, et al. Alantolactone induces activation of apoptosis in human hepatoma cells. Food Chem Toxicol. 2012;50:3313–3319.
- Khan M, Yi F, Rasul A, et al. Alantolactone induces apoptosis in glioblastoma cells via GSH depletion, ROS generation, and mitochondrial dysfunction. IUBMB Life. 2012;64:783–794.
- Khan M, Li T, Ahmad Khan MK, et al. Alantolactone induces apoptosis in HepG2 cells through GSH depletion, inhibition of STAT3 activation, and mitochondrial dysfunction. BioMed Res Int. 2013;2013:1.
- Youle RJ, Narendra DP. Mechanisms of mitophagy. Nat Rev Mol Cell Biol. 2011;12:9–14.
- Larson-Casey JL, Deshane JS, Ryan AJ, et al. Macrophage akt1 kinase-mediated mitophagy modulates apoptosis resistance and pulmonary fibrosis. Immunity. 2016;44:582–596.
- Prieto-Dominguez N, Ordonez R, Fernandez A, et al. Melatonin-induced increase in sensitivity of human hepatocellular carcinoma cells to sorafenib is associated with reactive oxygen species production and mitophagy. J Pineal Res. 2016;61:396–407.
- He L, Gu K. Tanshinone IIA regulates colorectal cancer apoptosis via attenuation of Parkin‑mediated mitophagy by suppressing AMPK/Skp2 pathways. Mol Med Rep. 2018;18:1692–1703.
- Kuo YF, Su YZ, Tseng YH, et al. Flavokawain B, a novel chalcone from Alpinia pricei Hayata with potent apoptotic activity: involvement of ROS and GADD153 upstream of mitochondria-dependent apoptosis in HCT116 cells. Free Radic Biol Med. 2010;49:214–226.
- Shali H, Shabani M, Pourgholi F, et al. Co-delivery of insulin-like growth factor 1 receptor specific siRNA and doxorubicin using chitosan-based nanoparticles enhanced anticancer efficacy in A549 lung cancer cell line. Artif Cells Nanomed Biotechnol. 2018;46:293–302.
- Ding Y, Wang H, Niu J, et al. Induction of ROS overload by alantolactone prompts oxidative DNA damage and apoptosis in colorectal cancer cells. Int J Mol Sci. 2016;17:558.
- Zhang Y, Bao YL, Wu Y, et al. Alantolactone induces apoptosis in RKO cells through the generation of reactive oxygen species and the mitochondrial pathway. Mol Med Rep. 2013;8:967–972.
- Zafarullah M, Li WQ, Sylvester J, et al. Molecular mechanisms of N-acetylcysteine actions. Cell Mol Life Sci. 2003;60:6–20.
- Song Y, Kong L, Sun B, et al. Induction of autophagy by an oleanolic acid derivative, SZC017, promotes ROS-dependent apoptosis through Akt and JAK2/STAT3 signaling pathway in human lung cancer cells. Cell Biol Int. 2017;41:1367–1378.
- Wei R, Cao J, Yao S. Matrine promotes liver cancer cell apoptosis by inhibiting mitophagy and PINK1/Parkin pathways. Cell Stress Chaperones. 2018;23:1295–1309.
- King KL, Cidlowski JA. Cell cycle regulation and apoptosis. Annu Rev Physiol. 1998;60:601–617.
- Malumbres M, Barbacid M. Is Cyclin D1-CDK4 kinase a bona fide cancer target? Cancer Cell. 2006;9:2–4.
- Cicenas J, Valius M. The CDK inhibitors in cancer research and therapy. J Cancer Res Clin Oncol. 2011;137:1409–1418.
- Yang C, Yang J, Sun M, et al. Alantolactone inhibits growth of K562/adriamycin cells by downregulating Bcr/Abl and P-glycoprotein expression. IUBMB Life. 2013;65:435–444.
- Cui L, Bu W, Song J, et al. Apoptosis induction by alantolactone in breast cancer MDA-MB-231 cells through reactive oxygen species-mediated mitochondrion-dependent pathway. Arch Pharm Res. 2018;41:299–313.
- Evan GI, Vousden KH. Proliferation, cell cycle and apoptosis in cancer. Nature. 2001;411:342–348.
- Estaquier J, Vallette F, Vayssiere JL, et al. The mitochondrial pathways of apoptosis. Adv Exp Med Biol. 2012;942:157–183.
- Jin Z, El-Deiry WS. Overview of cell death signaling pathways. Cancer Biol Ther. 2005;4:139–163.
- Benhar M, Engelberg D, Levitzki A. ROS, stress-activated kinases and stress signaling in cancer. EMBO Rep. 2002;3:420–425.
- Xu J, Zhang G, Tong Y, et al. Corilagin induces apoptosis, autophagy and ROS generation in gastric cancer cells in vitro. Int J Mol Med. 2019;43:967–979.
- Lai ZQ, Ip SP, Liao HJ, et al. Brucein D, a naturally occurring tetracyclic triterpene quassinoid, induces apoptosis in pancreatic cancer through ROS-associated PI3K/Akt signaling pathway. Front Pharmacol. 2017;8:936.
- Pei X, Xiao J, Wei G, et al. Oenothein B inhibits human non-small cell lung cancer A549 cell proliferation by ROS-mediated PI3K/Akt/NF-κB signaling pathway. Chem Biol Interact. 2019;298:112–120.
- Zhang L, Zhao Y, Guo L. 17beta-estradiol protects INS-1 insulinoma cells from mitophagy via G protein-coupled estrogen receptors and the PI3K/Akt signaling pathway. Int J Mol Med. 2018;41:2839–2846.
- Sun M, Wang S, Jiang L, et al. Patulin induces autophagy-dependent apoptosis through lysosomal-mitochondrial axis and impaired mitophagy in HepG2 cells. J Agric Food Chem. 2018;66:12376–12384.
- Sun DZ, Song CQ, Xu YM, et al. Involvement of PINK1/Parkin-mediated mitophagy in paraquat- induced apoptosis in human lung epithelial-like A549 cells. Toxicol In Vitro. 2018;53:148–159.
- Zhang C, Yu X, Gao J, et al. PINK1/Parkin-mediated mitophagy was activated against 1,4-Benzoquinone-induced apoptosis in HL-60 cells. Toxicol In Vitro. 2018;50:217–224.
- Zhang HT, Mi L, Wang T, et al. PINK1/Parkin-mediated mitophagy play a protective role in manganese induced apoptosis in SH-SY5Y cells. Toxicol In Vitro. 2016;34:212–219.