
Abstract
Two hundred years after the Greek Revolution (1821), a large number of different administrations (governments) comprising of an even larger number of members of the implementing authority have served the Greek State. In this paper, we study these entities from a Social Analytic Perspective view. We create networks of actors (ministers) over the above-mentioned time period and perform network analysis in the global, average, and local levels, together with a network classification discussion. We also include some insights on nepotism issues in the government context. Results reveal interesting views, patterns, groupings and rankings of important politicians of modern Greece.
PUBLIC INTEREST STATEMENT
In this paper, the author uses a number of techniques from Social Network Analysis, in order to create and investigate the collaboration network of all prime-ministers and ministers that have served for a period of 200 hundred years in various cabinets in Greece. The analysis follows an exploratory manner, macroscopically, microscopically and in the medium level, in order to reveal not only structural and mathematically oriented aspects of this network, but also to provide with insights regarding Greek political life, famous politicians and aspects of their authoritative roles. Finally, one of the purposes of this paper is to discuss other issues, common within the Greek political life, such as nepotism over the whole bicentennial period.
1. Introduction
In 2021, 200 years have passed since the 1821 Greek Revolution against the Ottoman Empire. During this period, the Greek State has passed through many different forms, ranging from monarchy, constitutional monarchy, different forms of representative democracy, dictatorships and war periods, until the present period (metapolitefsi). Ever since the first months of the newly founded state (January of 1822), governments of different forms were assembled, while it is clear that despite these different forms, there has been a continuity in the sense that, even if the most turbulent times like wars, a government comprising of a number of members was always present.
It has been rather common knowledge (and also has been extensively studied in the literature) that the formation of cabinets of ministers, at least in the Greek case, is subject to a restricted number of persons (a “ministerial pool”) and is not actually open to society, or even to governing party members. It is, however, also a fact that research literature on Greek political life in general and especially in the implementing authority rarely uses any statistical methods or models. Researchers tend to use rather a rather traditional, in terms of political science, type of analysis (Karakatsanis, Citation2017). In a relevant paper on the subject the authors do a thorough review of the relevant literature on the topic of Greek ministers, dive into an in-depth statistical analysis of background characteristics, credentials, professions and even gender of Greek ministers within a similar to this paper time period (Sotiropoulos & Bourikos, Citation2002). As stated, their main purpose was to locate who holds political power, how and why. Some of this paper’s objectives are also present in our study, albeit through the use of different tools. A research on power and resources within the Greek core executive uses empirical analysis to explore the nature of the Greek core executive, arguing that—in the end—the structure of the system of the Greek government is rather one of “solitary center” within a “segmental government” (Feathersone & Papadimitriou, Citation2012). Another relevant paper studies families’ relationship in the Greek Parliament for a period of about one decade (2000–12) and through the use of statistical methods shows that while it is common for the Greek Parliament to show a dynastic structure, this phenomenon is rather slowing down during the economic crisis, although a longer period of time is needed to prove such a permanent decline (Patrikios & Chatzikonstantinou, Citation2015).
Social Network Analysis (SNA) is not statistics or social science in the traditional sense. While social science relies heavily on the description and measurements of individual’s attributes, SNA puts aside this manner of thinking and mostly deals with the social relations between these individuals (Wellman, Citation1988). Other researchers move on to clarify that in SNA (elsewhere met as Network Science or Network Analysis) what we study is the attributes of pairs of individuals, since social relations are just one type of such dyadic attributes (Borgatti & Everett, Citation1997).
The purpose of this article is to examine the overall structure of all implementing authorities (executive authorities/minister cabinets), in a both macroscopic and microscopic manner, over the complete two-centuries period, through the use of SNA methods and tools. We use a number of data sources to locate which ministers served in the same cabinet and create a two-mode (bipartite) network. Through a simple linear algebra function, we obtain the co-occurrence network of all ministers over the complete modern Greek political history. Our main research questions are listed as follows:
RQ1: Can a structural representation through SNA reveal an overall degree of “health” regarding democratic continuity and institutions in Greece and generally?
RQ2: Can ministers be divided into categories? Does such a division reveal hidden information, otherwise considered to be “urban legends”?
RQ3: Who are the main actors, the most prominent persons that have played an important role in modern Greek political history?
RQ4: What is the role of nepotism in this framework?
In order to address the above RQs, we venture to identify whether this network falls into special categories (small worlds and/or scale-free), to discuss its connectivity and proper clustering in groups, to identify and measure important ministers’ metrics and to discuss issues on nepotism, as they emerge through visualizations. In the following sections, we will start with a discussion regarding relevant literature, continue with our data collection and methodology processes and the presentation of our results. A final discussion of our findings, together with some hints for further investigation of our data will conclude our analysis.
2. SNA, politics and the Greek case in the literature
SNA was first introduced since Moreno’s first depiction of sociograms (Freeman, Citation2004, p. 15) a first attempt to visualize social relations among person and continued to emerge as an important paradigm within social sciences through many important works by influential scientists (Cartwright & Harary, Citation1956; Granovetter, Citation1985; Hage & Harary, Citation1983; Katz & Lazarsfeld, Citation1955) some of which come from different disciplines such as pure mathematics, computer science and sociology. Actually, SNA’s tools and procedures heavily rely on a branch of pure mathematics, Graph Theory, first introduced by Euler in 1736 through the famous Königsberg bridges walkaround problem. During the 90s and the first two decades of the 21st century, new boost in the field was given through the study of the evolution of social networks (i.e., the way networks grow or shrink over time) and the internal structure of real-life networks, in contrast to random ones, giving large quantities of research regarding especially small-worlds and/or scale free networks and their special characteristics (Barabási & Réka, Citation1999; Newman et al., Citation2006; Watts & Strogatz, Citation1998). During these latest years, new SNA software appeared with features that facilitate creation, visualizations and calculations on social networks, such as UCINET (Borgatti et al., Citation2002), PAJEK (Batagelj & Mrvar, Citation2003), NodeXL (Smith et al., Citation2010) and others.
Despite the field’s growth, it’s acceptance in political science’s related research was rather slower than expected (Żukiewicz et al., Citation2018). Furthermore, it seems that there exists a (not easily explained) preference by American rather than European researchers in applying SNA methods and tools in political science (Heaney & MacClurg, Citation2009; Ward et al., Citation2011). Regarding methodology, it was in 2017 that The Oxford Handbook of Political Networks was published, including methods and applications in political science. Some of the most discussed relevant topics include voting and political participation or vote choice, political parties and campaigns, interest groups, discussion networks, local networks, network segregation, international relations, comparative politics etc. It should also be noted that during the last decade, significant analysis is held on politics and social network applications, such as Facebook or Twitter (Cadena et al., Citation2015; Gruzd & Tsyganova, Citation2015; Morales et al., Citation2014) together with research on political discourse through the creation of semantic networks (among others: JafariAsbagh et al., Citation2014; Yaqub et al., Citation2017).
During the latest decade, significant amount of relevant research deals with the use of social network applications, such as Facebook and Twitter, and their impact on the way modern politics are held. Research focuses on the way modern political campaigns use these applications are used in order to promote or fight against not only politicians but political ideas as well (Jungherr, Citation2016). The Cambridge Analytica—Facebook alleged scandal, where the firm used data improperly obtained from Facebook to build voter profiles, is quite recent (Confessore, Citation2018). Furthermore, common knowledge is that Twitter is used by important or powerful politicians to rapidly respond to their current, daily political agendas.
Finally, special research interest is devoted to content analysis, the analysis of texts, within the political sphere. Blog articles, political speeches, texts from political brochures and programs, Facebook posts and Tweets are analyzed in various ways, based on semantic analysis. Texts are represented as networks and SNA is then applied to retrieve underlying ideas, reveal social movements or (of course) reveal propaganda attempts (among others: Ahmed & Lugovic, Citation2019; Chase Dunn, Citation2019; Keller & Ulrike Klinger, Citation2019).
SNA’s tools and procedures are quite rarely referenced in the Greek political sphere, at least to our knowledge. An analysis on connectivity practices of Greek political blogs with the use of SNA techniques revealed that only a few blogs serve as authority ones while also few try to expand their influence (Zafiropoulos, Citation2012). In a more qualitative research (Zeri, Citation2014), four political blogs were analyzed with respect to their content and the conclusion was that what dominates in the debates of the far-left and far-right blogs belongs to the same rigid ideological raster that excludes an understanding of the principles and grounds of democracy. In another research study, the author examined how social and new media tools such as Facebook, Twitter, blogs, and online radio have influenced the potential development or rejuvenation of public sphere, civil society, and public discourse in Greece during the years of the country’s economic, political, and social crisis. An attempt to discuss a similar issue, regarding members of the Parliament and not ministers, showed a rather congested situation with no clear results (Kydros & Trevlakis, Citation2012). Finally, some content analysis on the Greek political language during the economic crisis through SNA tools was held, where the authors examined political speeches by Greek politicians during the 2015 general elections (Kydros & Anastasiadis, Citation2017).
One of the objectives of the present research is to enrich this (rather poor) relevant literature. Actually, to our knowledge, the following methodology has never been used before at least in the present context of members of governments over a large time period.
3. Methodology, data collection and networks creation
The first question that need to be addressed has to do with our selected time-period. Other studies have chosen to begin with year 1843, since it was this year that the first general elections were held (alas in a heavy political climate), after the revolution of the September 3rd, 1843 against King Othon’s regime. Hence, this year marks the beginning of the “constitutional” period in Greece (Sotiropoulos & Bourikos, Citation2002). However, as already stated in our introductory section, primitive forms of governments were formed from the first month following the 1825 Greek Revolution. It was in January 1822 when “Εκτελεστικό”—executive/implementing—was appointed by the First National Assembly of Epidaurus. This body resembles authoritative authority in these early years in contrast to “Βουλευτικό”—congressional/legislative. Hence, in order to preserve continuity, we chose to include the governments of these first years (this period is also referred to as “Προσωρινή Διοίκησις της Ελλάδος”—Temporary Administration of Greece).Footnote1
The data used in this study include the names of ministers, their approximate year of birth (for synonym discrepancies), the approximate year of their first appointment as ministers and the governments in which they served. Data were retrieved from a number of different sources, including officialFootnote2 and unofficial webpages, reference textbooks (Δημητρόπουλος 2004) and other sources. It should be noted that especially for the pre-1909 period, some data might be erroneous, however not to a degree that could affect the complete picture.Footnote3 We also include the name of the ministers’ political families, for a later discussion on nepotism; however, this is not at all an easy task. Again, different sources were used, such as (unpublished) data from an NGO,Footnote4 a various number of online newspapers or other webpages.Footnote5 Since these data mainly come from unofficial sources, they prone to be incomplete or even erroneous by nature to some extent, so the relevant discussion will be presented under this fundamental assumption.
A social network is comprised of nodes and edges (or actors and ties, respectively).Footnote6 Nodes are entities that relate (interact) to each other and edges represent this relation. Pictorially, nodes are represented as dots and edges are represented as lines that connect related nodes. In our case, nodes obviously correspond to ministers, however, in order to define edges, we need to clarify “interaction”—the defining relation. In this study, an edge is created between two nodes whenever these the corresponding ministers have served in the same cabinet at any time. It is important to note that a minister may serve in many different governments over time, thus relating with the corresponding other members of cabinets. Hence, the overall network created will connect a large number of ministers, some closely (when served in the same cabinet) and some remotely (through a third minister who has served in both cabinets).
Clearly, what is described is a collaboration network,Footnote7 similar to co-authorship among researchers, highly placed directors in the corporate world that serve in many inter-locking boards of directors, co-appearance of actors in cinema films etc. (Misruchi Citation1996; Newman, Citation2001). By using historical records, the patterns of collaboration can be tracked for a large period of time, even a century or more (Easly & Kleinberg, Citation2010, p. 22). It is generally accepted that when dealing with human beings as actors, social ties are created and enhanced over time because the relating actors have more opportunities to interact and they collaborate enough to create trust (Easly & Kleinberg, Citation2010, p. 50). Of course, one could claim that this general idea may not be fully applicable between ministers within a cabinet, where different agendas or interpersonal animosities might be present; however, it should be accepted that a cabinet is a closely knitted group and collaboration is imposed de facto (or by the prime-minister). Furthermore, the issue of time is always present, since the examined time period spans two centuries.
A collaboration network (also called a bipartite or two-mode network) is represented as a two-dimensional matrix with N rows and M columns (N X M). Rows represent actors (here: ministers), columns represent clubs or groups (here: cabinets) and the entries in the matrix represent participation of a minister in a cabinet (denoted with 1) or not (denoted with 0). If such a matrix is called A, then its transpose (a flip of the matrix where rows and columns are interchanged) is denoted as AT. A subsequent multiplication function of A*AT leads to a second, symmetrical matrix, B, representing co-occurrences of actors. In a final step, matrix B is dichotomized and used as the adjacency matric of the final network. In an example is presented in order to clarify the procedure.Footnote8
Figure 1. An example of our methodology
Some final comments must be clarified at this point. The dichotomization function can be omitted, thus resulting in a network with weights. An edge would then be coupled with a value showing the actual number of co-occurrences of ministers in different cabinets. Such a network needs a somehow different (from this paper) approach, especially in link analysis. However, we chose to dichotomize because in our data layout we had to decide whether to include different formations of the same government in the same electoral period. It is known that a prime minister (or a king in older times) has the constitutional right to change the cabinet and this right has been used many times. Furthermore, ministers resign or decease, new ministries are installed in an existing cabinet, and these changes are recorded as new cabinets. Hence, had matrix B not been dichotomized, false results would emerge. Finally, it must be noted that the resulting network is undirected, meaning that all edges are reciprocal. Actually, collaboration of ministers in one cabinet should be considered as reciprocal in the broad sense: even if personal agendas are present, members of a cabinet are required to work together to achieve its goals.
4. The ministers’ network: analysis
All in all, a total number of 1955 ministers were recorded, having served in 386 different formations of cabinets. Initially, data were stored in a spreadsheet and in almost all subsequent calculations, visualizations and processes, NodeXL Pro is used (Smith et al., Citation2010). NodeXL Pro is a Microsoft Excel Template that includes a number of tools for network analysis. In certain calculations, we use NetworkX (python-based) or igraph (R-based) packages (Hagberg et al., Citation2008; Csardi & Nepusz, Citation2006 respectively).
4.1. A visualization attempt
In we present a first visualization attempt of the network.Footnote9 This picture is not a random one since a spring embedding algorithm was used: closely connected nodes are drawn together in the same area (they are retracted by an imaginary spring) and vice-versa.
Figure 2. A first visualization of the ministers’ network
Some preliminary observations emerge from . Globally, the network seems to be divided in three major areas, left, middle and right, with some nodes in the middle areas. A bow-tie configuration is present, a resemblance that has been found in other networks visualizations, such as certain biological networks or even the world-wide-web (Friedlander et al., Citation2015). Different neighbourhoods within these broad areas are clearly present, shown as closely connected chunks of nodes. The middle area connects the two others, so it must be somehow more important. Some nodes lie in the local centres of these chunks; intuitively these nodes are more “important” than others. Some nodes lie in the periphery, implying that they are not highly connected to all others. Finally, some nodes (depicted as larger, bold dots) seem to connect different areas of the network and this is an important quality. A more thorough discussion on these preliminary observations will follow later, after the presentation of some calculated metrics over the network.
4.2. The macroscopic level quantitative analysis and network classification
In we summarize some basic quantitative characteristics of the ministers’ network. Column “short description” gives an intuitive meaning for each value.
Table 1. A quantitative macroscopic view of the ministers’ network
Density, as measured in , is a metric over the total network. The actual value of 0.026 represents a rather sparse network; however, such values are common in real-life networks formed by humans (Kydros & Anastasiadis, Citation2017). Being a global metric, density cannot describe what happens in different “neighborhoods” of the network, already seen in , since some of them might be denser or sparser. The same observation applies also to average clustering coefficient, but this metric will be used in out microscopic analysis, calculated for each node in a next subsection, since it incorporates a sense of “local density” or “ego density”.
However, average clustering coefficient combined with the next metric (average shortest path) can be used as an indicator to check whether this network belongs to a special class of networks, called small-worlds (Watts & Strogatz, Citation1998). A network is a small world when the average shortest path is relatively small (as is in our case), whilst the average clustering coefficient is relatively large (also the case in our network). Generally, small-worlds have special properties, such as the cliquish behavior which is of course present in our network since members of the same cabinet are completely connected to each other. Another property is the existence of a number of hubs (highly connected nodes) that serve as connectors-intermediaries between different neighborhoods. Yet another property is that in general, most pairs of nodes are connected by a path, which can also be seen (although not yet proven) even from . In order to verify this hypothesis, we calculated the small-world coefficient (sigma) of our network, since networks with sigma larger than 1 are usually small-worlds (Humphries & Gurney Citation2008). In our case, sigma was calculated to be 5.37, which is a very strong proof that the ministers’ network is a small-world.
To its extremity, a small-world whose nodes’ degree distribution follows the power-law is called a scale-free network (Barabási & Réka, Citation1999). Power-laws are present in a various number of situations in contrast to other, common distributions such as the gaussian one (the very well-known bell-shaped curve). In scale-free networks, power-law means that major hubs are only a few, but smaller and smaller hubs exist in a logarithmic manner, meaning that a large number of nodes have very few neighbors. This hierarchical structure is the reason why these networks are robust (or resilient), in the sense that the removal of some will not severely affect the connectivity of the whole network. In we plot the degree distribution of the ministers’ network in a logarithmic scale. As seen on the right panel, the network is clearly a scale-free one especially for degrees larger than (about) 25, being an almost straight line with high slope.
Figure 3. Degree distribution
In , a value for the assortativity coefficient was also calculated to be very close to 0, meaning that this network is non-assortative. It is very interesting to note that many scale-free small-worlds, especially those representing social networks of well-known people tend to be assortative, since a type of preferential attachment exists over the evolution of such networks as time passes by (newcomers tend to connect with already existing hubs). However, in our case the network is not assortative, which in turn resembles situations most commonly found in technological or biological networks (Barabasi & Oltvai, Citation2004). Of course, the formations of cabinets over time is not a standard social procedure, since it is highly regulated and restricted by choices made by the heads of the governments (Kings in the past, prime-ministers in present times), who do not usually appoint their ministers based on the number of cabinets they served in the past. This is a first answer to our RQ1: the studied network seems to be evolving in a regular manner, preserving a continuity that is not considered to be normal in modern democracies, where a normal change of persons in the authoritative sector should be a standard procedure.
The diameter of the network (the “longest shortest path”) was calculated to be 9 which is an expected value, given the long period of time this network represents. The actual meaning is that between any two nodes there exists a path which, although in average is close to 4, at most it can be 9. The most distant ministers have exactly eight intermediaries between them.
4.3. The medium level: connectivity and communities
An important result emanates from regarding connectivity: the ministers’ network is comprised of only two connected components. Actually, there exists a small component with only 7 nodes and a “giant” component comprising of all others. The small component’s nodes were members of a short-term, stillborn cabinet formed in 1892 (Κωνσταντίνος Κωνσταντόπουλος, Γεώργιος Φιλάρετος, Λεωνίδας Μελετόπουλος, Σπυρίδων Δεϊμέζης, Χρήστος Μαστραπάς, Κωνσταντίνος Παπαμιχαλόπουλος and Κωνσταντίνος Σαχτούρης).Footnote10 These persons served as ministers in the specific government for the first time of their life and never again. This component can be seen in at the bottom left area of (after zooming). Such briefly living governments were common, especially in turbulent political times; their duration was either a few days or a few months and could not usually achieve a vote of confidence from the Parliament. But it is exactly the fact that only one such component was found that makes this result not only important but striking: turbulent political times, wars, dictatorships, even dual governments (1824, 1916, during the 2nd World War, 1944 and 1947) are common in the Greek political history. Given this fact, it would be expected that short-living cabinets would result in many more small components; however, it is shown that in our case ministers are recycled in the vast majority of all government formations—a confirmation of the term “ministerial elite” as described in the literature (Sotiropoulos & Bourikos, Citation2002).
Connectivity and the detection of connected components is a first step towards a general goal in SNA which is the meaningful clustering of nodes in smaller groups. A number of different procedures and definitions have been introduced over time, including cliques, cores, clans etc. (Wasserman & Faust, Citation1994, pp. 249–290). For example, in our network, the presence of cliques is certain (there should be at least 386), since each cabinet is actually a clique (all nodes/ministers are connected to all other nodes within the same clique/cabinet). Recently, a broader definition of groups was introduced, regarding communities. The last metric of —modularity, measured to be 0.585—is an indication that this network is clusterable in communities (Newman, Citation2006). A (rather loose) definition of a community is that it is a group of nodes with more connections between them than to the outside rest area of the network. Again, our RQ1 is answered here: this type of connectivity should not be present. Ministers should be appointed in an alternating manner and not coming from a pool.
In the ministers’ network, exactly 10 communities were detected and are shown in , sorted in descending order by their nodes’ cardinality together with a short description.Footnote11
Table 2. The 10 different communities of ministers
Results in are both expected and surprising. The algorithmic clustering does, in fact, locates some of the government formations of most turbulent political times. Actually, all groups from G5 to G10 correspond to major historical events in modern Greek political history that had a profound effect on governments formed. Both dictatorships, the Minor-Asia catastrophe of 1922, the national division of 1916, the beginning of WWII, etc. are present. Ministers during these periods have little interaction with ministers of other periods. In the two dictatorships (1936: G5 and 1967: G3), an obvious explanation would be that these ministers were considered to be “forbidden” or “burned”, after their collaboration in such schemas and this is a legitimate hypothesis. A similar explanation applies also for intermediary periods, where transitional cabinets are formed with specific agendas, which are the cases of groups G7, G8 and G9. In such periods, members of the judicial authority or well-known bankers are usually appointed as ministers. However, not all transitional government schemas were detected in , meaning that in some cases these “outsiders” are utilized again in subsequent cabinets. is repeated as in the Appendix, including names of important representatives of ministers in Greek.
Communities G2 and G4, are very interesting ones. Both coincide with major political events of metapolitefsi. In 1981, it was the year that PASOK came into its government period, while in 2015 a coalition under SYRIZA also came into authority. In both these periods, the “ministerial pool” was profoundly changed, with a large number of new persons entering the political life. G4 seems to be more consistent, with respect to political position (mainly left-sided); however, G2 is not at all consistent since it is not only comprised of members of PASOK (of socialist side) but also from Nea Dimokratia (conservatives). A probable explanation for this merging comes mainly from the 1989–1991 and 2012–2015 periods, when (again), otherwise completely competitive parties joined in coalition or “ecumenical” governments in order to address special problems. Actually, the existence of this community G2 is a proof that in recent times political polarization has been rather smoothed out, at least in the “central” spectrum of the political life. All members of the present cabinet (2020) belong to G2.
The existence of G1, the largest community, is a surprising result. It is comprised of the vast majority of all ministers (excluding G3 and G5 to G10), served from 1823 until (about) 1980. The algorithmic clustering has found that more co-occurrences are found between ministers within this community than ministers from this community to its outside area. In other words, it seems that for this very large time period, an intense sense of continuity (in normal political periods) seems to prevail and ministers seem to connect to each other in a very stable way. This result is rather difficult to explain. One possible interpretation might relate to the alleged polarization of the Greek political life in the broad sense: it has been said that (of course with small intervals) the central-conservative part of the political spectrum has been in charge from the beginning of the Greek State and that this predominance stopped with the arrival of PASOK in 1981.
Indeed, such an explanation fails to incorporate the fact that polarization has been constantly present in the political life. It seems, however, that when time passes by, this alleged polarization is again smoothed out: ministers from one political party do move to opponent parties, thus serving as “bridges” between different areas.Footnote12 Hence, regarding RQ2, the fact that everybody is connected to everybody shows that the alleged polarization in Greek political life is rather smoothed out.
In an attempt to further investigate the underlying reasons for this peculiar clustering behavior, a pictorial representation of the clustered network would be useful. In , a visualization of the discussed community structure is provided.Footnote13 Each community is drawn in its own rectangle area and is named according to . The size of each node corresponds to its degree (the number of its neighbors). Different node colors also have a special meaning which will be explained later on.
Figure 4. The community structure of the ministers’ network
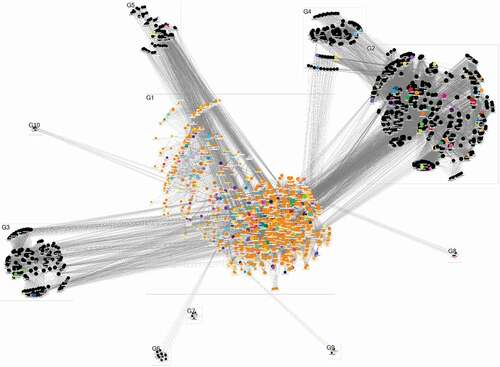
Another important observation emanates from : All different communities have edges connecting them to G1 which serves like a central hub. Most communities do not have links to each other (a reasonable result given the large time gaps between them), with the exception of communities G4 and G2 that do have a number of edges connecting them. Again, G1 prevails, since it connects all different groups through paths: it is possible for any minister in any community to reach any other minister through a mediator that resides in G1. In the next subsection, yet another possibility will be presented and discussed. Hence, regarding RQ2, the fact that everybody is connected to everybody (and especially through G1) shows that the alleged polarization in Greek political life is rather smoothed out.
4.4. A note on nepotism
In we used a particular type of nodes colouring. A node is coloured black if the corresponding minister does not belong to a political family, otherwise the node is coloured red, green, blue, etc. Actually, different colours correspond to different political families, although at this point it is the presence or not of colouring that is interesting. Having the above in mind, it is quite easy to observe that community G1 is almost completely comprised of coloured nodes (of any colour); whereas, all other communities have only scattered coloured nodes, with the majority of them being plain black. This is a strong indication that a main reason for the stability, the central position and the size of G1 has to do with the overwhelming presence of members of different political families.Footnote14
Nepotism in politics, also referred to as dynastic politics, has been a well-understood field of research in many different countries such as Sweden, Japan, Philippines, Italy and in other countries (Folke, Perrson & Rickne Citation2018; Asako et al. Citation2015; Querubin Citation2016; Geys & Smith Citation2017, respectively). In the Greek case, an already mentioned study regarding ministerial elites from 1843 to 2001 gave very important insights in nepotism, some verified in the present paper (Sotiropoulos & Bourikos, Citation2002). In the general sense, nepotism is the situation where descendants or other family members of politicians, also become politicians themselves. A number of explanations for the existence of this phenomenon have been proposed in the above-mentioned literature, such as easier access to the “proper” channels, better targeted education, a distorted idea of tradition or legacy etc. It should be noted, however, that nepotism in politics is rather rare in Western, robust democracies, such as the U.S.A., the United Kingdom, Germany or France.
In our model, it is self-evident that political nepotism has been a prevailing situation for an extremely large time period, ranging from 1823 to (about) 1980. Furthermore, since these nodes/ministers are clustered in one community, it seems that nepotism is paired with strong ties between ministers, even if they do not belong in the same political family or in the same political parties. A sense of “behind the peoples backs” agreement is somehow found here: “no matter the party and the period, our families will continue to rule the country”. A very well-known urban legend in Greece says that ’a bunch of families have been in charge from the beginning’ and it is somehow verified here. Actually, despite the probable small errors or the difficulty in identifying a political family especially after marriages between them, we have counted about 150 different families.
Community G1 does have a profound effect to all other communities. In an attempt to find out whether there exist political families in communities G2 to G10 that do not have older members in G1, a number of 14 was calculated.Footnote15 These families can be considered as new ones. Out of these fourteen new families, only one belongs to community G4,Footnote16 while all others belong to G2. RQ4 is clearly present and answered in this discussion.
From and the previous discussion, it is evident that after 1980 this situation has been diminishing to a large extend. This is actually true, despite the fact that it holds generally for ministers but not for prime-ministers, where indeed political families with quite long political ancestry lines are the rule and not the exception. Some more data relative to nepotism will be presented in the next subsection, focusing on specific nodes.
4.5. Microscopic level: the importance of specific ministers
It has already been noted that nodes are not the same. Some are more “important” or more “central” or more “influential”, than others. This is the well-studied field of centrality in networks, where a relevant metric is calculated for each node (Wasserman & Faust, Citation1994, pp. 169–219). Over the years, a rather large number of different centrality metrics have been proposed, each addressing a particular position that a node may have in a network, giving to this node a special advantage over other nodes.Footnote17 In this paper, we will deal with two different relevant metrics, namely degree and betweenness centralities, in order to address our RQ3.
Degree centrality coincides with the degree of a node, that is, the number of its neighbors. It is reasonable to suppose that if a node has more neighbors, then that node is more important against another (poorer in neighbors) node. In , large nodes are nodes with higher centralities. However, degree centrality fails to recognize another quality, which is the importance of a node as a mediator. Betweenness centrality for a node is a metric calculated as the proportion of the number of shortest paths between all nodes that pass through the examined node over the total number of all shortest paths in the network. Nodes with high betweenness centrality act as mediators or brokers over the whole information circulation. In some cases, a removal of those nodes could break the connectivity of the network, or enlarge the average shortest path. In we used betweenness centrality for node sizing. In , we list the 20 top nodes,Footnote18 ranked in descending order, according to their degree and betweenness centrality results respectively.Footnote19 is repeated in the Appendix as and as , including the names of ministers in Greek. We also include their community label, the presence (or not) of their political family and the year of their first appointment as ministers.Footnote20
Table 3. Degree centrality ranking
Table 4. Betweenness centrality rankingFootnote22
From it is obvious that very important politicians are located. Actually, this ranking includes a large number of post-war prime ministers, although some are missing. Most of these politicians have played an extremely important role in modern Greek political history; however, some surprises do exist, including either ministers who have been moving between political parties or having served in many different cabinets, surviving from many reconstructions or reformations of cabinets.Footnote21 The existence of important political families is also present here (50%), as is the prevailing of communities G1 and G2. But, as it turns, includes ministers mainly from the second half of the previous century (some of them still active), but none from the eighteenth century. A reasoning for this inequality (and actually an answer on why degree centrality is not such a representative metric) is shown in , where we calculated the average degree of all ministers over the year of their first appointment.
Figure 5. Chart of average degree over year of first appointment
From it can be easily seen that up until (about) 1920, degrees of ministers were rather low, meaning in turn that cabinets were indeed limited in total number of members. Hence, no matter how long-lived and active a minister was, his degree could not reach levels that might include him in . The absolute maximum average degree was found to be 125 in year 1983, meaning that ministers firstly appointed in 1983 were members of a substantial number of abundant cabinets.
It is obvious that betweenness centrality includes ministers with a better distribution over time. As already noted, ministers in are located in better positions with respect to information circulation, since they have a gatekeeper’s (or a broker’s) position among other ministers. Again, political families are also present, but in a larger proportion than in degree centrality (70% compared to 50%). It is quite interesting to point out that being a member of a political family does give a fathomable advantage in this metric. Finally, again communities G1 and G2 are widely present, while only one representative of G4 is found for the first time in both rankings.
In , all 7 nodes found in both rankings are listed, in order of appearance. Some nodes are expected to be in this Table, mainly great politicians that have marked political periods, but some (marked with a star) are unexpected. Again, here is a discussion that can focus on these specific names; however, such an elaboration is outside of the targets of this paper. can be seen in the Appendix as , with the actual names in Greek.
Table 5. Common nodes in both centralities
4.6. Conclusions and further research
In this paper, techniques from Social Network Analysis (SNA) were used in order to study the collaboration network of all ministers served in all Greek government formations (cabinets) over the complete period of modern Greek State, spanning two centuries (1822–2020). Data were collected from a large number of different sources, with a special care for correctness (although this seems like a vain effort, at least when investigating family kinships). A network of ministers was created from a simple linear algebra transformation and was subsequently studied in three different levels: macroscopically, in the average level and microscopically. Such an analysis is used for the first time in this context, at least to the author’s knowledge.
One main, very interesting result, is that the examined network is very tightly connected. With the exception of only seven persons (in 1892), each minister can reach every other minister in a small average number of hops. Furthermore, the network overall is clearly classified as a small-world, scale-free network, a rather surprising result, with the actual meaning that instead of a normal, proper or natural persons’ recycling, a long-living ministerial pool has been in charge for a large portion of the examined time-period, with strong, resilient connections (RQ1).
A clustering in communities, although different algorithms may result in slightly different results, calculated four main groups (out of ten in total). The presence of these cohesive groups and their systasis do confirm that power has been a privilege of very few people, but also show renewal efforts in the latest and current period. Furthermore, family kinships also prevail in the most populated and longstanding of these groups, a result that is a clear confirmation of the extensive presence of nepotism (RQ2 and RQ4).
In the microlevel (RQ3), rankings of important nodes are presented with respect to the scores in well-established metrics. Although over time the formation of cabinets has changed, regarding their cardinality, this approach does identify actors that are well-known politicians but also signalizes some other, unexpected nodes as being important. At this level, however, further elaboration should be continued through a political science, or—better, a political history perspective.
This study may continue producing interesting results by using different threads. One main possible thread is the creation of a network of cabinets, instead of ministers (as already discussed). For this purpose, data regarding different cabinet formations of the same electoral period, should be merged in order to identify which cabinets have connections (common ministers). A similar SNA analysis can then be applied in this network. Others, possible future continuations of this study could emerge by slicing the network over specific time periods that could be of special interest. For example, the period of metapolitefsi or the interwar period might be extracted and analyzed. Slicing can also be made in the communities already found in this study by extracting a subgraph containing group G1 or G2.
The studied network can also be enriched if other members of authority, different from cabinet members, are added. For example, general secretaries of ministries, heads of governmental organizations, CEOs of state-owned companies or public hospitals could be used in order to create a broader set of actors in power.Footnote23 Such an analysis could actually be very interesting. Yet another data enrichment could be made by a very careful investigation of family kinships of any kind. As already noted, such information may be obscured, especially in modern times (where it may be considered as a disadvantage) but was almost advertised in past periods.
A final, quite important remark, will conclude our study. This research created and analyzed the ministers’ in a static manner with respect to time. It is thus supposed that nodes and edges are continuously present, although at some points some time-relevant discussion was held (as in ). Temporal networks and their analysis require different procedures and different tools (Holme & Saramäki, Citation2012). Such an analysis on the investigated network is also included in possible future research threads. However, it must be noted that in the context of politics and relations of politicians, wide time-windows should be considered as active: a minister’s grandfather may have served with another minister’s uncle who in turn may have been married to another minister’s daughter who lived in late 1800s. Such a linkage is described by a path in this study and can be considered as still active, since although actors may have passed away, their legacies (both political but also personal) survive for long time periods.Footnote24
Declaration of conflicting interests
The author(s) declared no potential conflicts of interest with respect to the research, authorship, and/or publication of this article.
Acknowledgements
The author(s) would like to thank vouliwatch.gr and its representative, Mr Loukopoulos Stefanos, for the kind sharing of important data regarding kinship relations among member of the Greek Parliament during Metapolitefsi.
Additional information
Funding
Notes on contributors
Dimitrios Kydros
Dimitrios Kydros is a Computers and Informatics Engineer from the Polytechnic School of Patras, Greece and holds a Ph.D. degree in Applied Informatics from the University of Macedonia, Greece. His research interests include social network analysis, political analysis, text mining, distant learning and other relevant areas. He is currently an Associate Professor at the School of Economics and Management, Department of Economic Sciences, International Hellenic University, Serres, Greece. This paper follows a number of research on the greek political life through the use of Social Network Analysis techniques.
Notes
1. We will use the term “ministers” henceforth, for each and every member of the authoritative bodies (including prime ministers, associate ministers (αναπληρωτές) and undersecretary ministers (υφυπουργοί). We will also use terms “cabinets” or “governments” interchangeably, although “government” is a rather broader term.
2. The General Secretariat of Legal and Parliamentary Issues—Hellenic Government, available online at: https://gslegal.gov.gr/?page_id=776.
3. A special effort was made to scrutinize these data. Errors occurred in different stages of the analysis and were corrected. The author welcomes any data corrections from anyone.
4. Vouliwatch.gr, data kindly offered by representative Mr. Loukopoulos.
5. It would be a vain effort to actually present all the different unofficial sources used to actually discover family ties between ministers. Official data are extremely difficult or even illegal to access. It seems that even in the personal webpages of modern politicians, their family ties to older ones are rather obscured. Furthermore, family ties are difficult to locate for spouses (different names) or even impossible to locate, such as relations of the type Godfather-Godson.
6. Nodes and edges are also referred to as vertices and links, respectively.
7. Yet another definition is: affiliation network.
8. In this paper, a special effort is made to avoid strict mathematical notation and instead use descriptive language, however this goal may not always be completely achieved.
9. Obviously, it not possible to examine node names in the printed version, however the online version of the paper includes this Figure in an easily magnified form, in tiff and png formats.
10. Some Greek names are included in this paper, only for reasons of integration.
11. A copy of , including representative nodes with high degrees is included in the Appendix.
12. It must be noted that the clustering procedure examines the network as a whole, so it is reasonable to expect that older periods are expected to exhibit such a behavior. Actually, in an attempt to further investigate G1, it was extracted (as a whole subgraph) from the original network and a new attempt to find communities within G1 was executed, resulting in 4 different, maybe more meaningful, groups. However, such a procedure is left for future work, since this a recursive iteration has no simple ending.
13. As before, this figure can be easily magnified and is provided in tiff and png formats.
14. In the field of data science, proper visualizations of data are of utmost importance, since it is easier for any human being to detect patterns or trends by simply looking at a picture instead of studying statistical tables.
15. These families are: Αλιβιζάτου, Αραμπατζή-Μαγκριώτη, Αρσένη-Κατσέλη, Γεννημερά, Δαμιανού, Δήμα, Δρίστα-Χριστοδουλοπούλου, Καραγκούνη, Κατριβάνου, Κατσιφάρα, Κεδίκογλου, Λιάνη, Ραγκούση-Νταλάρα, and Σκυλακάκη.
16. Δρίτσα-Χριστοδουλοπούλου.
17. Note that “position” does not mean “geographical” but rather “relative importance” position.
18. The selection of twenty (20) nodes to include in those rankings mostly has to do with limited space in this paper.
19. A large number of different centrality metrics can be calculated, according to the centrality quality one wants to discuss. In this study, mainly due to space, it is impossible to elaborate more in this subject.
20. A more extensive view of is included in the Appendix, showing full names of politicians and families in Greek
21. More elaboration on specific roles would be circumstantial and should be done by a political scientific point of view.
22. Seen in the Appendix with full Greek names.
23. “We have the government but we do not have the power”, a former prime-minister’s spouse once said.
24. After all, it has been said that time is relative.
References
- Ahmed, W., & Lugovic, S. (2019). Social media analytics: Analysis and visualisation of news diffusion using NodeXL. Online Information Review, 43(1), 149–23. https://doi.org/10.1108/OIR-03-2018-0093
- Asako, Y., Iida, T., Matsubayashi, T., & Ueda, M., (2015). Dynastic politicians: Theory and evidence from japan. Japanese Journal of Political Science, 16(1), 5–32. https://doi.org/10.1017/S146810991400036X
- Barabasi, A. L., & Oltvai, Z. N. (2004). Network biology: Understanding the cell’s functional organization. Nature Reviews Genetics, 5(2), 101–113. https://doi.org/10.1038/nrg1272
- Barabási, A. L., & Réka, A. (1999). Emergence of scaling in random networks. Science, 286(5439), 509–512. https://doi.org/10.1126/science.286.5439.509
- Batagelj, V., & Mrvar, A. (2003). Pajek - analysis and visualization of large networks. In M. Juenger & P. Mutzel (Eds.), Graph drawing software (series mathematics and visualization) (pp. 77–103). Springer.
- Borgatti, S. P., & Everett, M. G. (1997). Network analysis of 2-mode data. Social Networks, 19(3), 243–269. https://doi.org/10.1016/S0378-8733(96)00301-2
- Borgatti, S. P., Everett, M. G., & Freeman, L. C. (2002). Ucinet for windows: Software for social network analysis. Analytic Technologies.
- Cadena, J., Korkmaz, G., Kuhlman, C. J., Marathe, A., Ramakrishnan, N., Vullikanti, A., & Preis, T. (2015). Forecasting social unrest using activity cascades. PLOS ONE, 10(6), e0128879. https://doi.org/10.1371/journal.pone.0128879
- Cartwright, D., & Harary, F. (1956). Structural balance: A generalization of Heider’s theory. Psychological Review, 63(5), 277–292. https://doi.org/10.1037/h0046049
- Chase Dunn, R. (2019). You sir are a hypocrite: Responses to Pence’s MLK Day tweets as attention intervention. Atlantic Journal of Communication, 27(5), 354–365. https://doi.org/10.1080/15456870.2019.1647206
- Confessore, N. (2018, April 4). Cambridge analytica and Facebook: The scandal and the fallout so far. The New York Times.
- Csardi, G., & Nepusz, T. (2006). The igraph software package for complex network research. InterJournal, Complex Systems, 1695(5), 1–9. https://igraph.org/
- Easly, D., & Kleinberg, J. (2010). Network, crowds and markets: Reasoning about a highly connected world. Cambridge University Press.
- Feathersone, K., & Papadimitriou, D. (2012). The Emperor has no clothes! Power and resources within the Greek core executive. Governance, 26(3), 523–545. https://doi.org/10.1111/j.1468-0491.2012.01610.x
- Folke, O., Persson, T., & Rickne, J. (2018). Dynastic political rents? Economic benefits to relatives of top politicians. The Economic Journal, 127(605), F495–F617. https://doi.org/10.1111/ecoj.12494
- Freeman, L. C. (2004). The development of social network analysis: A study in the sociology of science. Empirical Press, Vancouver.
- Friedlander, T., Mayo, A. E., Tlusty, T., Alon, U., & Rzhetsky, A. (2015). Evolution of Bow-Tie architectures in biology. PLOS Computational Biology, 11(3), e1004055. https://doi.org/10.1371/journal.pcbi.1004055
- Geys, B., & Smith, D. (2017). Political dynasties in democracies: Causes, consequences and remaining puzzles. The Economic Journal, 127(605), F446–F454. https://doi.org/10.1111/ecoj.12442
- Granovetter, M. (1985). Economic action and social structure: The problem of embeddedness. American Journal of Sociology, 91(3), 481–510. https://doi.org/10.1086/228311
- Gruzd, A., & Tsyganova, K. (2015). Information wars and online activism during the 2013/2014 Crisis in Ukraine: Examining the social structures of Pro‐ and Anti‐Maidan groups. Policy & Internet, 7(2), 121–158. https://doi.org/10.1002/poi3.91
- Hagberg, A. A., Schult, D. A., & Swart, P. J. 2008. Exploring network structure, dynamics, and function using NetworkX, Proceedings of the 7th Python in Science Conference (SciPy2008), eds. G. Varoquaux, T. Vaught, & J. Millman, Pasadena, CA USA, pp. 11–15.
- Hage, P., & Harary, F. (1983). Structural models in anthropology. Cambridge University Press.
- Heaney, M. T., & MacClurg, S. D. (2009). Social networks and American politics. American Politics Research, 37(5), 727–741. https://doi.org/10.1177/1532673X09337771
- Holme, P., & Saramäki, J. (2012). Temporal networks. Physics Reports, 519(3), 97–125. https://doi.org/10.1016/j.physrep.2012.03.001
- Humphries, M. D., & Gurney, K. (2008). Network small-world-ness: A quantitative method for determining canonical network equivalence. PLOS ONE, 3(4). https://doi.org/10.1371/journal.pone.0002051
- JafariAsbagh, M., Ferrara, E., Varol, O., Menczer, F., & Flammini, A. (2014). Clustering memes in social media streams. Social Network Analysis and Mining, 4(237), 1–13. https://doi.org/10.1007/s13278-014-0237-x
- Jungherr, A. (2016). Twitter use in election campaigns: A systematic literature review. Journal of Information Technology & Politics, 13(1), 72–91. https://doi.org/10.1080/19331681.2015.1132401
- Karakatsanis, N. M. (2017). Review of the book Prime Ministers in Greece: The Paradox of Power by K. Featherstone and D. Papadimitriou (review). Journal of Modern Greek Studies, 35(2), 580–583. https://doi.org/10.1353/mgs.2017.0037
- Katz, E., & Lazarsfeld, P. F. (1955). Personal influence: The part played by people in the flow of mass communication. Routledge
- Keller, T. R., & Ulrike Klinger, U. (2019). Social bots in election campaigns: Theoretical, empirical, and methodological implications. Political Communication, 36(1), 171–189. https://doi.org/10.1080/10584609.2018.1526238
- Kydros, D., & Anastasiadis, A. (2017). Greek political language during the economic Crisis—A network analytic approach. Social Networking, 6(2), 164–180. https://doi.org/10.4236/sn.2017.62010
- Kydros, D., & Trevlakis, N. (2012). A network analysis of the Greek parliament and some socio-economic issues. MIBES Transactions International Journal, 6(1), 27–38. http://mibes.uth.gr/vol6_2012/Kydros-Magoulios-Trevlakis.pdf
- Misruchi, M. S. (1996). What do interlocks do? An analysis, critique, and assessment of research on interlocking directorates. Annual Review of Sociology, 22(1), 271–298. https://doi.org/10.1146/annurev.soc.22.1.271
- Morales, A. J., Borondo, J., Losada, J. C., & Benito, R. M. (2014). Efficiency of human activity on information spreading on Twitter. Social Networks, 39, 1–11. https://doi.org/10.1016/j.socnet.2014.03.007
- Newman, M., Barabási, A. L., & Watts, D. (2006). The structure and dynamics of networks. Princeton University Press.
- Newman, M. E. J. (2001). The structure of scientific collaboration networks. Proceedings of the National Academy of Sciences, 98(2), 404–409. https://doi.org/10.1073/pnas.98.2.404
- Newman, M. E. J. (2006). Modularity and community structure in networks. Proceedings of the National Academy of Sciences of the United States of America, 103(23), 8577–8696. https://doi.org/10.1073/pnas.0601602103
- Patrikios, S., & Chatzikonstantinou, M. (2015). Dynastic politics: Family ties in the Greek Parliament, 2000–12. South European Society and Politics, 20(1), 93–111. https://doi.org/10.1080/13608746.2014.942989
- Querubin, P. (2016). Family and politics: Dynastic persistence in the Philippines, quarterly. Journal of Political Science, 11(2), 151–181. https://doi.org/10.1561/100.00014182
- Smith, M., Ceni, A., Milic-Frayling, N., Shneiderman, B., Mendes Rodrigues, E., Leskovec, J., & Dunne, C. (2010). NodeXL: A free and open network overview, discovery and exploration add-in for Excel 2007/2010/2013/2016, from the Social Media Research Foundation: https://www.smrfoundation.org
- Sotiropoulos, D. A., & Bourikos, D. (2002). Ministerial elites in Greece, 1843-2001: A synthesis of old sources and new data. South European Society and Politics, 7(2), 153–204. https://doi.org/10.1080/13608740708539628
- Ward, M. D., Stovel, M. D., & Sacks, A. (2011). Network analysis and political science. Annual Review of Political Science, 14(1), 254–264. https://doi.org/10.1146/annurev.polisci.12.040907.115949
- Wasserman, S., & Faust, K. (1994). Social network analysis: Methods and applications. (Structural Analysis in the Social Sciences, Series Number 8). Cambridge University Press.
- Watts, D. J., & Strogatz, S. H. (1998). Collective dynamics of ‘small-world’ networks. Nature, 393(6684), 440–442. https://doi.org/10.1038/30918
- Wellman, B. (1988). Thinking structurally. In B. Wellman & S. D. Berkowitz (Eds.), Social structure: A network approach (pp. 1–15). Cambridge University Press.
- Yaqub, U., Chun, S. A., Atluri, V., & Vaidya, J. (2017). Analysis of political discourse on twitter in the context of the 2016 US presidential elections. Government Information Quarterly, 34(4), 613–626. https://doi.org/10.1016/j.giq.2017.11.001
- Zafiropoulos, K. (2012). Connectivity practices and activity of Greek political blogs. Future Internet, 4(3), 719–736. https://doi.org/10.3390/fi4030719
- Zeri, P. (2014). Political blogosphere meets off-line public sphere: Framing the public discourse on the Greek Crisis. International Journal of Communication, 8, 1579–1595. https://ijoc.org/index.php/ijoc/article/view/2012/1152
- Żukiewicz, P., Zieliński, M., & Domagała, K. (2018). Social network analysis as a research method in political science. An attempt to use it in coalition research. Przegląd Politologiczny, 4, 39–50. https://doi.org/10.14746/pp.2018.23.4.3
APPENDIX
Table A1. The ten different communities of ministers, including representative nodes
Table A2. Degree centrality ranking including full names in Greek
Table A3. Betweenness centrality ranking including full name in Greek
Table A4. Common nodes in both centralities including full names in Greek