
 ?Mathematical formulae have been encoded as MathML and are displayed in this HTML version using MathJax in order to improve their display. Uncheck the box to turn MathJax off. This feature requires Javascript. Click on a formula to zoom.
Abstract
The foundation of the Organization of Turkic States was established through the creation of the Turkic Speaking Countries Summits, which aimed to strengthen relations among the Turkic states that gained independence after the collapse of the Soviet Union. Today, the Organization (formerly the Turkic Council) strives to foster cooperation in various fields. One crucial aspect of this cooperation is the development of trade between member countries. This study aims to analyze the Organization’s impact on its members’ foreign trade by examining pre- and post-foundation years’ trade data to assess the cooperative entity’s effectiveness in enhancing trade cooperation among its members. A gravity model was employed to evaluate the significance of other factors influencing bilateral trade among six Turkic states and Tajikistan, such as proximity, income levels, population size, shared borders, and cultural similarity. The results indicate that membership in the Organization positively affects the estimated model. This study discusses the effect of integration on trade relations from a different perspective and provides interpretations. Therefore, the annual foreign trade data of the founding members (Turkey, Azerbaijan, Kyrgyzstan, and Kazakhstan) from 2000 to 2019, sourced from the World Bank, were analyzed using the TOPSIS method. In this context, the impact on commercial relations before and after the establishment of the Organization was evaluated based on multiple criteria. Before its establishment, Kazakhstan held the first place in terms of overall trade performance with member countries; however, Turkey replaced it after the creation of this cooperative entity, followed by Azerbaijan and Kyrgyzstan.
1. Introduction
After World War II, countries began to focus on regional and global integration as a development means. Through these integrative efforts, States began collaborating on technical, economic, political, and cultural activities. Integrations provide mutual benefits by increasing cooperation among member countries and lead to market growth, investment development, and economic growth by removing trade barriers. As the tariff rates applied by importing states decrease, patent protection rates also decrease, while increased tariffs result in higher patent protection rates (Hatemi-J, Citation2002). This situation can harm social welfare due to increased costs and patent protections. Therefore, international organizations and agreements are often structured to benefit member countries reciprocally. An example of regional economic integration is the European Economic Community (EEC), founded in 1957 and became a Union by signing the Maastricht Agreement in 1992. Another example is the North American Free Trade Agreement (NAFTA), which began in 1992 between the U.S. and Canada and included Mexico in 1994, aiming to gain advantages through reorganizing trade among member countries. A third economic group is the economic integration movement between Japan and the surrounding Southeast Asian countries (Şanlı, Citation2004).
In addition to these formations, which constitute a significant part of world trade, other integrations exist in different parts of the world. The Turkic-speaking countries of the former USSR, namely Turkmenistan, Uzbekistan, Kazakhstan, Kyrgyzstan, and Azerbaijan, share strong cultural and historical ties, leading to the establishment of the Organization of Turkic States (OTS) (Akilli, Citation2019). These former Soviet republics have a shared history, having come under Tsarist Russian rule in 1880 and gained independence in 1989 with the dissolution of the USSR. During the Soviet period, these states faced developmental delays in various sectors, such as the economy, industry, education, culture, and healthcare. The relations between the Turkic-speaking states were not at the desired level during this time. However, this situation changed after 1989 when Turkey became the first state to recognize their independence in 1991 and made the development of relations with the newly independent Central Asian states a state policy. Since then, cooperation activities in the political, cultural, and economic realms have been initiated to strengthen these relations. The first step was the establishment of the Summit of Heads of State of Turkic-speaking Countries in 1992. This organization and its frequent assemblies laid the foundation for the OTS (Amirbek et al., Citation2017). The Turkic Council, later renamed the Organization of Turkic States, officially came into existence in 2009 when Turkey, Azerbaijan, Kazakhstan, and Kyrgyzstan signed the Nakhchivan Agreement (Citation2009). Initially, Uzbekistan joined as an observer country but later became a full member. Since 2010, the organization has held regular annual meetings to discuss political, economic, military, cultural, and linguistic issues (Baki, Citation2014). In recent years, joint military exercises have also been a focal point. The organization is not a fully integrative structure but rather a regional cooperation organization aimed at expanding cooperation in various areas in the future.
With a clear goal for the next 20 years, the OTS exhibits all the characteristics of a fully-fledged international organization representing the entire Turkic world. The OTS is approximately one-fourth the size of Russia and half the size of China, accounting for around three percent of the world’s total land mass (Demir et al., Citation2022). Together with Turkmenistan and Uzbekistan, the member states of the OTS will have a total area and demographic potential ranking seventh in the world, with 4.8 million square kilometers and ninth with 155 million people, and their GDP is projected to exceed 1.3 trillion US dollars in 2023. Consequently, the OTS plays a significant role in the global economy (Mustofaev, Citation2022). Given the region’s strategic location between Russia, China, and Iran, as well as its abundant natural resources, transportation and transit options, and proximity to conflict zones such as Afghanistan and Pakistan, which have a substantial impact on global security (Sapiyev, Citation2017), it is crucial to address the structure of the organization, relationships among member states, and collaborations and activities following its establishment. Additionally, through the membership of its nations in various international organizations, the OTS has evolved into an organization that interacts with numerous global and regional entities.
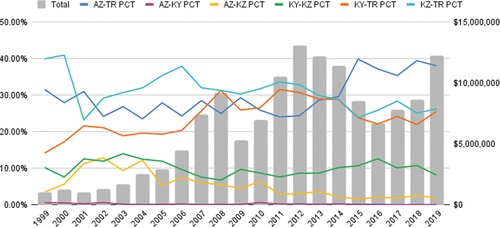
The bilateral total trade volumes among the four Turkic countries are depicted in Figure . The data illustrates an upward trajectory in trade volume from 1999 to 2019, indicating the growing economic relations between these states, even though there are fluctuations in trade volume proportions over the years which suggests possible trade patterns or economic dynamics shifts. Beginning in 2014, trade between Azerbaijan and Turkey (AZ-TR) surpassed trade between Kazakhstan and Turkey (KZ-TR), becoming the largest component of overall trade. Turkey plays a significant role as a trading partner for all three countries. The trade volumes between Azerbaijan and Kazakhstan (AZ-KZ) and Azerbaijan and Kyrgyzstan (AZ-KY) remain relatively modest compared to other bilateral trade relationships. Notably, the proportion of trade volume between Azerbaijan and Kazakhstan (AZ-KZ) has consistently declined since 2004. However, the proportion of trade volume between Kazakhstan and Kyrgyzstan (KY-KZ) has experienced a substantial increase, indicating strengthened economic ties between these two countries. These observations suggest a trend towards enhanced trade integration and economic cooperation among the Turkic countries, with Turkey assuming a central position. Although integrations formed through the collaboration of different countries are expected to bring mutual benefits, the varying development levels of these countries result in differing expectations, challenges, and benefits from such formations. Therefore, it is crucial to analyze the effects of integrations on the benefits for member countries. This analysis is significant for policy development, particularly in forming new agreements and making membership decisions for countries.
Figure 1. Proportional representation of intra-organizational bilateral trade as a percentage of the overall trade volume and total trade volume measured in thousand dollars among member countries.
In this study, we analyzed the effect of the OTS on the foreign trade of its member countries using two different methodologies to explore the question of “how” from two distinct perspectives. The first methodology employed is the gravity model, a widely used analytical framework in international economics. It serves as a fundamental tool for understanding and quantifying the patterns and determinants of international trade flows. This model has demonstrated its reliability and robustness in examining the effects of various factors on trade flows, allowing researchers to assess the impact of trade agreement organizations, such as regional trade agreements or customs unions, on international trade patterns (Jadhav & Ghosh, Citation2023). By investigating the effect of trade agreement organizations through the lens of the gravity model, this research aims to provide insights into the mechanisms by which attributes influence trade dynamics and contribute to a broader understanding of international economic integration.
The second methodology employed in this study is the multi-criteria decision making (MCDM) method, which has been widely applied to various types of problems in the literature. It provides a valuable tool for decision-makers operating in complex environments with numerous criteria to consider. MCDM aims to identify the best alternative by considering multiple factors, offering a range of tools and techniques applicable across different fields, from supplier selection to performance evaluation. In this research, the Technique for Order of Preference by Similarity to Ideal Solution (TOPSIS), the most favored MCDM method after the Analytic Hierarchy Process (AHP), was utilized to evaluate the performances of member countries’ foreign trade over the years (Çelikbilek & Tüysüz, Citation2020). The 10-year foreign trade data of member countries before and after joining the organization were analyzed using the TOPSIS method. As Uzbekistan joined the organization in 2019, there is insufficient data available specifically for this country, and therefore, it was excluded from the analysis. The analysis results were interpreted and compared, and subsequent sections provide recommendations based on these findings. While numerous econometric analyses on different integrations worldwide are extensively discussed in the literature, a research gap exists concerning studies investigating the effects of the OTS on its member countries. Moreover, to the best of the authors’ knowledge, this study represents the first attempt to analyze and interpret the impact of economic integrations on member countries’ foreign trade using a combination of two methods within the proposed framework.
The paper’s organization is as follows: Section 2 evaluates the relations among the Turkic Republics from the past to the present and explains other states’ approaches towards this organization. This is followed by a description of the structure of the OTS, its goals and objectives, and an evaluation of its economic arrangements and related foreign trade data. Section 3 reviews studies analyzing the impacts of economic integrations, focusing on the literature on OTS. Multi-criteria decision making (MCDM) methods applied to different types of problems, especially TOPSIS, are also presented in this section. In Section 3, the gravity model and the TOPSIS method are explained along with the details of the dataset. Section 4 presents the empirical findings of the analysis. Lastly, Section 5 concludes the study with a discussion and provides recommendations aligned with the results.
2. Background
This section explains the relations between the Turkic states and the structure of the OTS. Additionally, the trade data of the member countries and the organization will be interpreted. This background information will be instrumental in the interpretation of the analysis results.
2.1. Relations between Turkic states
The Turkic-speaking republics gained independence in 1991 following the dissolution of the USSR, with Turkey being the first country to recognize them officially (Aktürk, Citation2006). Turkey has strong historical ties with these states in the realms of language, religion, culture, and kinship. It has sought to collaborate with them in the military, political, economic, and cultural fields. To this end, the Community of Turkic Speaking States (CTSS) was established in 1992 under Turkey’s leadership. This community, which included Turkey, Azerbaijan, Kyrgyzstan, Kazakhstan, Uzbekistan, and Turkmenistan, aimed to increase cooperation and resolve potential conflicts, with Turkey playing a leading role.
The Turkic states have long been a subject of interest for many countries due to their abundant natural resources and fertile lands. Among these countries, Russia has actively sought to maintain its influence in the region. In 1991, Russia established the Commonwealth of Independent States (CIS), intending to bring together the newly independent states under a single umbrella. In 2000, Russia further solidified its presence in the region by signing an agreement to establish the Eurasian Trade Community and supporting the creation of the Caspian Pipeline Consortium (Şanlı, Citation2008).
Until 2001, the CTSS could not take significant organizational steps and remained passive, mainly due to the internal issues faced by its member states. The 2006 summit in Antalya aimed to revive relations. During this time, Turkmenistan and Uzbekistan remained in the background, primarily relying on Russia for income from their main exports of oil, natural gas, and precious metals.
To act more concretely and organizationally, a secretariat was established with the signing of the Nakhchivan Agreement on 3 October 2009. The CTSS became the Turkic Council and thus gained organizational credibility. Since then, the organization has become an essential entity with its increased institutional structure and the development of bilateral relations. Later, the organization would be instrumental in determining common strategies between governments in many economic, political, military, cultural, and linguistic fields. Turkey, Azerbaijan, Kyrgyzstan, and Kazakhstan are the founding members, while Turkmenistan initially did not participate due to its policy of neutrality. Uzbekistan also did not participate in the summit but held observer member status. Later, on 3 October 2019, it was accepted as a full member after submitting a request to join. In the same year, Turkmenistan and Hungary joined the community as observer countries (Sobirov, Citation2020).
2.2. Structure of the organization
The Nakhchivan Agreement (Citation2009) established the organization’s structure and determined its goals, including ensuring the sustainability of Baku-Tbilisi-Ceyhan and Baku-Tbilisi-Erzurum pipelines, developing transportation and communication, promoting social activities, facilitating peace in Afghanistan, resolving the Karabakh conflict, and supporting economic cooperation.
The organization’s mission includes building political trust, promoting a common foreign policy, supporting peace, enabling free trade, promoting balanced development, and prioritizing business management and human rights protection. The OTS comprises several committees, including the Council of Heads of State, the Council of Foreign Ministers, the Senior Officials Committee, the Aksakallılar (Whitebeard’s) Council, and the Secretariat. The Aksakallılar Council functions as an advisory body composed of experienced individuals from the Turkic world. Most activities and related details are approved by the Council of Foreign Ministers and presented to the Council of Heads of State for final approval. The Secretariat is responsible for preparing documents for submission to the Presidential Summits and the Council of Foreign Ministers. The Senior Officials Committee reviews reports and draft documents prepared by the Secretariat and submits them to the Council of Foreign Ministers for approval. All of these committees collaborate to support and carry out the legal activities of the OTS (Erol & Çelik, Citation2017; Mert, Citation2015).
The official language of the OTS is English, in addition to the official languages of each member state. The Organization is the primary coordinating institution for several other organizations, including the Parliamentary Assembly, Turkic Cultural Heritage Foundation, Turkic Academy, and Turkish Business Council. These organizations operate under the guidance of the OTS, promoting cooperation and common culture within the Turkic world.
2.3. General economic structure of the Turkic states after independence
The Turkic-speaking countries are rich in natural resources, including raw materials and energy reserves, extensive agricultural lands, and a well-developed transportation infrastructure. However, during the Soviet era, their dependence on the centralized decision making structure in Moscow made them reliant on the Russian Soviet Republic. Upon gaining independence, these countries faced challenges in developing their industries and securing medium- to long-term financing for technological advancement and skilled personnel training. The transition from a centrally planned economy to a market-oriented system made them more vulnerable to international crises and economic fluctuations. Consequently, they had to undertake comprehensive restructuring across various domains, including social, cultural, religious, political, economic, and military spheres (Humbatov & Sari, Citation2017).
Following Azerbaijan’s independence, the country experienced an economic decline in the first five years, primarily attributed to the occupation of Karabakh by Armenia. This occupation resulted in losing 20 percent of Azerbaijan’s territory, including valuable resources such as oil, natural gas, and fertile land. It also led to an increase in immigration and unemployment. Azerbaijan’s economy relies heavily on oil, natural gas, and agriculture, with approximately 90 percent of its exports comprising these resources or related products (Cornell, Citation1997). In 2000, exports amounted to $1.7 billion and imports to $11.7 billion. By 2009, exports had risen to $14.6 billion and imports to $61.1 billion, but the share of trade with Turkic states decreased despite the overall increase in foreign trade volume. In 2019, exports reached $19.6 billion and imports $136 billion, with 14.7 percent of exports and 13.3 percent of imports traded with other Turkic states. Notably, the share of trade with Turkic states significantly increased in 2019 compared to previous years, alongside the improvement in foreign trade volume. In 2020, 25 percent of the previously occupied territories in Karabakh gained independence. Article 9 of the ceasefire agreement between Azerbaijan and Armenia states that the Zangezur corridor is set to open, providing land and railway connectivity to Turkey and the Nakhchivan Autonomous Republic. This development will facilitate a significant economic breakthrough in the region (Muradov et al., Citation2021).
Following its independence from the USSR, Kyrgyzstan’s economy faced significant challenges, leading to a decline in its economic indicators by half (Abazov, Citation1999). However, the country has undergone reforms contributing to positive economic developments. Petroleum, natural gas, and industrial materials constitute the largest share of Kyrgyzstan’s imports (Temurshoev, Citation2004). In 2000, the country’s exports amounted to $505 million, with imports totaling $554 million. In 2009, exports increased to $1.1 billion, while imports reached $2.9 billion. In 2019, exports further rose to $1.9 billion, and imports amounted to $4.9 billion, with 22.1 percent of exports and 17.5 percent of imports involving other Turkic states. Parallel to the general growth in foreign trade volume, the share of trade with other Turkic states also increased.
Despite experiencing a decline in economic indicators following its independence, Kazakhstan’s recovery was relatively swift, primarily attributed to its abundant hydrocarbon resources and significant energy producer role. Half of the country’s industrial sector relies on petroleum production and its derived products. Kazakhstan’s exports primarily revolve around oil and other precious metals, garnering attention from numerous nations (Batsaikhan & Dabrowski, Citation2017). The country’s imports mainly include machinery and equipment, electronic devices, and textile products. In 2000, Kazakhstan’s exports amounted to $8.6 billion, with imports totaling $5 billion. By 2009, exports reached $43.1 billion, and imports amounted to $28.4 billion. Despite the increase in exports during this period, imports experienced a decrease, and trade with other Turkic states remained relatively low, considering the overall growth in foreign trade volume. In 2019, Kazakhstan’s exports rose to $57.7 billion, while imports amounted to $38.3 billion. Of these figures, 5.3 percent of exports and 2.8 percent of imports involved trade with other Turkic states.
Kyrgyzstan has capitalized on the opportunities presented by the OTS more than any other member state, with its exports to other member states increasing from 13 percent in 2009 to 30 percent in 2014. However, Kyrgyzstan still exhibits the lowest trade volume among the member countries. Similarly, Azerbaijan’s trade volume accounted for 20 percent in 2007, mainly due to a decline in other export items. Despite experiencing minimal changes in exports since 2008, the rate of exports to other member states dropped to 2 percent. As depicted in Figure , although Azerbaijan’s exports to other member states hover around $900 million, its annual imports averaged around $1.6 billion after 2009. On the other hand, Turkey’s imports from other member states amount to $1.8 billion, representing merely 1 percent of its total imports.
Figure 2. Share of total exports and imports of the four-member Turkic states between 1999–2019.
After gaining independence, Uzbekistan did not prioritize transitioning to a free market economy (Djanibekov et al., Citation2010). Consequently, its development lagged behind that of other Turkic states. Instead of focusing on agriculture, Uzbekistan placed greater emphasis on industrial development, resulting in a slower privatization pace than other Turkic states. In 2020, Uzbekistan’s exports amounted to $12.4 billion, while imports totaled $15 billion. In the same year, Uzbekistan’s total foreign trade volume with Kazakhstan reached $2.52 billion; with Turkey, it was $1.8 billion; and with Kyrgyzstan, it amounted to $637 million.
Following its independence, the country was able to attract foreign capital for investment in the agricultural and energy sectors. Turkmenistan’s economy relies heavily on the oil, natural gas, mining, cotton, and energy industries. Its key exports include natural gas, oil, and electricity, with Ukraine, Iran, and Italy being its primary trading partners. Turkmenistan is Turkey’s fourth-largest export partner and relies significantly on imports from Turkey. In total, Turkmenistan’s exports in 2019 amounted to $10.3 billion, with imports valued at $2.6 billion.
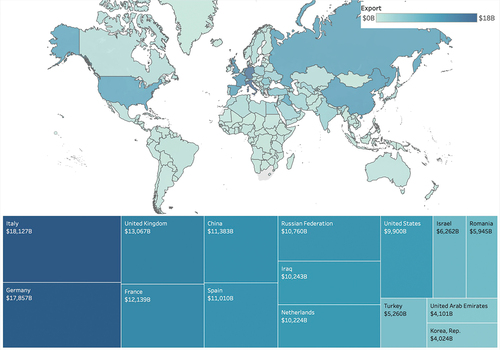
As illustrated in Figure , Turkey emerged as the leading exporter among the OTS member countries in 2019. During that year, Germany stood as Turkey’s top importing partner, with a trade value of $16 billion, followed by the UK ($11 billion) and Iraq ($10 billion). Kazakhstan’s export performance in 2019 was comparable to that of Turkey within the OTS. Italy and China emerged as Kazakhstan’s major clients, importing goods worth $8.5 billion and $7.8 billion, respectively. The significant trade volume between Russia and Kazakhstan, with a total export value of approximately $5.6 billion, indicates the presence of strong bilateral relations. Italy claimed the top spot as Azerbaijan’s largest trading partner in 2019, with exports amounting to $5.6 billion. When considering the overall organization, Italy, Germany, the UK, and France were the countries that imported the most from OTS members. Turkey ranked 11th in terms of imports, as it heavily relies on its fellow member states to meet its energy demands.
Figure 3. Total exports from organization of Turkic states members in 2019 and top partners with shares of more than $4B.
3. Literature
Liberalization of goods, services, and capital among countries is crucial for enhancing the development level of participating states, and this can be achieved through agreements and economic integration. The formation of such agreements often relies on cultural, economic, political, and historical factors (Şimşek & Şimşek, Citation2017). Economic ties are further strengthened through tangible economic activities and shared productivity (Kawasaki & Sato, Citation2021). A study by Yamarik and Ghosh (Citation2015) found that regional integration brings more benefits than broader trade. The literature contains numerous studies investigating economic integration’s impact at both global and regional levels. For instance, Udeagha and Muchapondwa (Citation2023) examined the combined effects of green finance and financial technology in achieving carbon neutrality goals for the BRICS nations from 1990 to 2020. Ngepah and Udeagha (Citation2018), Ngepah and Udeagha (Citation2019) employed a gravity model approach using panel data from 1995 to 2014 to analyze regional trade agreements in Africa. Karakaş et al. (Citation2019) conducted an analysis comparing the trade data of six EU and Shanghai Cooperation Organisation (SCO) countries with Turkey’s highest trade volume between 2000 and 2017 to demonstrate the benefits of EU and SCO for Turkey’s economic development. Aynagöz Çakmak et al. (Citation2015) proposed a gravity model approach based on panel data from 2007 to 2013 to evaluate the potential effects and gains of the Trade Facilitation Agreement (TFA) on the Black Sea Economic Cooperation (BSEC) in terms of the relationship between bilateral trade flows and trade facilitation. The gravity model has gained popularity in academic literature as it allows for considering economic and non-economic factors that influence global trade, such as population, distance, and language (Metin & Tepe, Citation2021). In another study (Udeagha & Ngepah, Citation2021), the authors investigated the relationship between trade openness and economic growth in South Africa from 1960 to 2016 using a non-linear methodology. It is common to come across articles in publications that utilize the gravity model as an analytical tool in the field of economic integration. For example, Ekanayake et al. (Citation2010) analyzed the trade creation and trade diversion effects of regional trade agreements in Asia and their impact on intra-regional trade flows using data from 1980 to 2009, while Alleyne et al. (Citation2014) examined trade flows in commodities for CARICOM countries. Furthermore, Irshad et al. (Citation2017) employed the gravity approach to investigate China’s trade patterns with OPEC member countries from 1990 to 2016. For a more comprehensive review of the literature in this field, readers can refer to recent review articles such as the bibliometric analysis conducted by Metin and Tepe (Citation2021), which identifies studies related to gravity models published between 1980 and 2020. Another bibliometric analysis focusing on the subject of international trade from 1987 to 2021, including various extensions of gravity models, was performed by Sharma et al. (Citation2022).
The growing prevalence of research on the OTS reflects an increasing focus on the cooperative dynamics within the organization. Studies such as that of Baghirov (Citation2022) have explored the economic potential of the OTS and found substantial untapped opportunities for economic cooperation despite the organization’s current level of engagement. Meanwhile, Demir et al. (Citation2022) employed the SWOT analysis method to identify the strengths, weaknesses, opportunities, and threats of the OTS, aiming to analyze the implications of the organization’s emergence as an international actor on the regional balance of power in Eurasia. Additionally, Keser et al. (Citation2021) examined the relationship between national development and country-level governance using data from the founding countries of the OTS. Another study by Sapiyev (Citation2017) investigated the activities of the OTS and the role of Kazakhstan in strengthening cooperation and promoting this international organization within the context of regional cooperation and security challenges in Central Asia. Considering Turkey’s geographical proximity to the Turkic states and its strong historical and cultural ties, efforts have been made to enhance relations and increase economic efficiency. Geybullayev and Kurubaş (Citation2002) analyzed the overall economic structure of the Turkic-speaking states, discussed their resources, and addressed political and economic crises experienced by these states, as well as the positions of countries with interests in the region, such as Russia, China, the EU, and the US. Eygü (Citation2022) conducted a panel co-integration test to examine the relationship between selected macroeconomic variables and the economic growth of Turkic states between 2000 and 2018. Çalışır (Citation2019) investigated cooperation initiatives among the Turkic-speaking countries and emphasized the need for economic integration, highlighting the potential for the structure to evolve into an alternative to the European Union. Meanwhile, Kaygusuz (Citation2021) evaluated the activities of the OTS on its 10th anniversary. They specifically addressed Turkey’s membership in the customs union, the geographic distance between member countries, and challenges related to customs tariffs and underdeveloped industries as primary factors that have influenced foreign trade among member countries over the past decade and hindered its desired level of growth.
Lavallée and Lochard (Citation2015) conducted a study on the effects of independence on trade between former French colonies and their colonizers. The findings revealed that these countries were more inclined to trade with third-party nations after gaining independence. This result is significant, particularly when considering the Turkic states, except for Turkey, previously under Soviet rule. Comparatively, the level of trade between former French colonies after independence ranged from 0.5 percent to 2 percent. In contrast, since their independence, trade between the Turkic states has reached levels ranging from 5 percent to 22 percent.
The purpose of the study conducted by Akilli (Citation2019) is to analyze the utilization of cultural diplomacy in Central Asia, specifically among Turkic republics and throughout the Turkic World, with a focus on TURKSOY and the OTS. Karl Deutch’s “transactionalist” theory is employed to examine this process. In another study, Şimşek and Destebaşi (Citation2020) employed panel data from Turkic states from 1995 to 2017 to investigate the relationship between corruption and human capital investment within the context of global economic integration. The impact of economic growth on income distribution was examined by Mercan and Azer (Citation2013) using panel data from Central Asian and Caucasian countries, as well as Turkish economies, between 1995 and 2009. Maharramov (Citation2021) explored Azerbaijan’s logistics capabilities concerning its connections with Turkic-speaking states. The significance of Turkic World integration was emphasized by Sobirov (Citation2020). Mustofaev (Citation2022) examined the OTS from the perspective of Samuel P. Huntington’s civilizational approach. Gharleghi and Popov (Citation2018) compared actual trade flows in Central Asia between 1989 and 2016 with predictions from gravity models, revealing changes in Turkey’s regional trade structure attributed to an increase in trade with Asian nations and a decrease in trade with other parts of the global economy. The collapse of trade within the USSR also contributed to shifts in the regional trade structure of former Soviet republics. Tahir et al. (Citation2021) conducted a geographical analysis to assess the capabilities of the Turkic world, emphasizing the importance of economic development, cooperation, favorable demographic trends, and geopolitical influence as critical interests for the region.
On the other hand, Multi-Criteria Decision Making (MCDM) methods are widely used in various contexts to address complex decision making challenges by providing a range of solutions. These methods assist in analyzing complex decisions and offer a precise decision making process by incorporating multiple participants, thus addressing the inherent complexity of many issues and promoting understanding (De Brito & Evers, Citation2016). MCDM encompasses a variety of methods applicable across different fields, with more than 50 methods available for multi-attribute decision making (Watrobski et al., Citation2019). Each method follows its own procedure and is selected based on the characteristics of the complex environment (Yalcin et al., Citation2022). While no universally superior approach exists, researchers often compare different methods to validate a proposed approach (Kilic et al., Citation2020). The Technique for Order Preference by Similarity to Ideal Solution (TOPSIS) method is primarily used for ranking, while the entropy method is employed for weighting, and both approaches are considered advantageous due to their convenience and objectivity (Aktaş & Demirel, Citation2021).
Several recent studies that have employed various MCDM methods in different fields are presented in Table and Table . MCDM methods have garnered significant attention from researchers as they provide a valuable approach to examining and utilizing complex decision making processes. The literature contains numerous review articles that explore their utilization in specific domains. For instance, Yalcin et al. (Citation2022) examined the use of different MCDM methods in the field of business analytics practices; Ağaç and Birdoğan (Citation2016) in healthcare systems; Zopounidis and Doumpos (Citation2002) in financial systems; Zare et al. (Citation2016) e-learning; De Almeida et al. (Citation2017) risk evaluation; and, lastly Govindan et al. (Citation2015) took into account “green concerns” as did Ho et al. (Citation2010).
Table 1. Sample studies using TOPSIS in different decision making processes between 2015 and 2023
Table 2. Sample studies using TOPSIS continues
Given the relatively recent establishment of the OTS, limited research in the literature employs scientific methods to qualitatively and quantitatively analyze the organization. Therefore, this study aims to quantitatively analyze the impact of the OTS on its member countries’ foreign trade relations using econometric analysis and the MCDM methodology. The econometric analysis employs the gravity model, utilizing panel data of Turkic states from 2000 to 2019. This approach allows for examining the empirical relationship between trade flows and various factors. Moreover, TOPSIS is utilized to evaluate the foreign trade performance of the member states over time. According to Shih et al. (Citation2007), TOPSIS offers four primary advantages: (i) it follows a sound logic that reflects human decision making rationale; (ii) it generates a scalar value that considers both the best and worst alternatives simultaneously; (iii) it involves a simple computational process that can be easily implemented in a spreadsheet; and (iv) the performance measures of all alternatives on attributes can be visualized on a polyhedron, at least for any two dimensions (Aktaş & Demirel, Citation2021).
4. Data and methodology
This study employs two distinct approaches to analyze the foreign trade flows among countries involved in economic integration, and the findings are subsequently interpreted. Firstly, a gravity model approach is proposed to assess the overall bilateral trade flows between Turkic countries, both OTS members and non-members. Additionally, TOPSIS is utilized to rank the trading performance of member states and assess the organization’s contribution to their economic development. Notably, to the best of our knowledge, no prior research has employed any MCDM method to analyze the foreign trade performance of OTS member states. Therefore, this study aims to comprehensively examine the foreign trade performance of these states both before and after their membership, providing valuable insights and recommendations regarding the organization’s current and future status and well-being.
4.1. Data set
The paper utilizes annual data from 2000 to 2019 for six Turkic states and Tajikistan to construct a gravity model. The inclusion of Tajikistan within the dataset is motivated by its geographical proximity to the Turkic states and its emergence as an independent entity following the dissolution of the USSR, a development analogous to that experienced by the other Turkic states. The dependent variable in the model is the export value. The independent variables include the gross domestic product (GDP), population, land area, geographical distance, linguistic dissimilarity, membership status, and border proximity. By including data from both OTS member states and non-member states among the six Turkic states and Tajikistan, the study aims to address temporal growth bias. Descriptive statistics of the data are presented in Table . Our data set constitutes an unbalanced panel, encompassing a total of 720 data points, as the export information of Uzbekistan, Tajikistan, and Turkmenistan was found to be absent from the World Bank database (World Bank, Citation2014).
Table 3. Descriptive statistics of trade data from six Turkic states and Tajikistan used in gravity analysis
To assess the effectiveness of the OTS, export and import data from 2000 to 2019 for the founding members (Turkey, Azerbaijan, Kyrgyzstan, and Kazakhstan) were analyzed. The analysis aimed to evaluate the benefits derived by the member states from their participation in the organization. Export data, measured in thousands of dollars, was employed. Figure illustrates the trade volumes among the four Turkic states.
Figure 4. Trade volumes within the four members of OTS with a display of the exponential regression trend line.
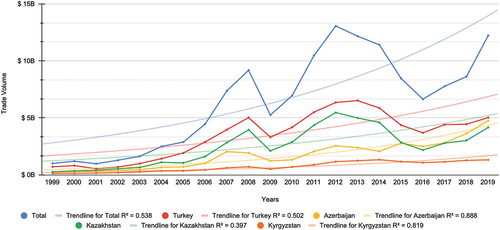
The four countries under analysis experienced the highest trade volume in 2012. Trade between Kazakhstan and Turkey significantly decreased in 2016 but recovered to 2019 levels by the same year. On the other hand, Azerbaijan and Kyrgyzstan exhibited a gradual and consistent increase in trade within the organization throughout the period. By 2019, Azerbaijan surpassed Kazakhstan and emerged as the country with the highest trade volume within the organization after Turkey. Figure suggests that Turkey and Kazakhstan are more susceptible to fluctuations, and it illustrates an exponential growth trend since 1999, prompting the inclusion of an exponential regression trend line on the graph. The values for the trend lines of Kyrgyzstan and Azerbaijan exceed 0.8.
Table provides an analysis of various variables related to international trade, including the monetary value of exported goods (EX), GDP value (GDP), population size (POP), land area (AREA), distance (DIST), and language distance (LAND) between exporter and importer countries. The mean and median values for the variable “EX” are 274,501.60 and 89,719.73, respectively. The substantial standard deviation indicates significant variability in the monetary worth of exported goods. The distribution is positively skewed with a skewness value of 3.00, indicating the presence of a few extremely high values. The high kurtosis value of 13.65 suggests heavy tails. Moving to the variable “GDP”, the mean and median are 145.13 and 344.27, respectively. The standard deviation of 254.46 indicates considerable variability. The distribution is positively skewed with a skewness value of 2.09, exhibiting a long tail on the right side. The kurtosis value of 5.98 suggests heavy tails. Regarding population size “POP”, the mean and median are 21,991,160 and 9,416,801, respectively. The large standard deviation of 24,220,187 indicates significant variability. The distribution is positively skewed with a skewness value of 1.53, presenting a longer tail on the right side. The kurtosis value of 3.78 suggests heavy tails. For land area “AREA”, the mean and median are 748.19 and 447.40, respectively. The standard deviation of 904.20 indicates substantial variability. The distribution is positively skewed with a skewness value of 1.54, exhibiting a longer tail on the right side. The kurtosis value of 3.72 suggests heavy tails. Moving on to the great circle distance between exporter and importer countries “DIST”, the mean and median are 1,802.88 and 1,624.28, respectively. The standard deviation of 876.36 suggests moderate variability. The distribution is slightly positively skewed, with a value of 0.46 and a longer tail on the right side. The kurtosis value of −0.83 indicates lighter tails. Finally, the variable “LAND” represents language distance, with a mean and median of 27.54 and 16.75, respectively. The standard deviation of 26.81 signifies notable variability. The distribution is positively skewed with a skewness value of 1.10, presenting a longer tail on the right side. The kurtosis value of 2.57 suggests heavy tails.
Table presents the correlation coefficients that reveal the relationships between various variables. There is a strong positive correlation between the logarithm of the monetary worth of exported goods () and the logarithm of the GDP value of the exporting country (
), indicating that countries with higher GDP tend to have more significant exports. Similarly, the positive correlation between
and the logarithm of the GDP value of the importing country (
) suggests that countries with larger import-oriented economies tend to receive higher exports. The correlation between
and the logarithm of the population of the exporting country (
) and the importing country (
) indicates a positive relationship, implying that larger populations may contribute to increased export activities. Similarly, there is a positive correlation between
and the logarithm of the land area of both the exporting (
) and importing (
) countries, suggesting that larger land areas may be associated with more significant export volumes. Moreover, the correlation between
and the logarithm of the great circle distance between exporter and importer countries (
) is relatively weak, indicating a limited influence of geographical distance on export levels. Conversely, the negative correlation between
and the distance between languages spoken in exporter and importer countries (
) suggests that more remarkable linguistic similarity may facilitate higher export volumes. It is also worth noting the positive correlations between
,
,
, and
, implying that countries with larger GDPs and populations tend to engage in more substantial economic interactions.
Table 4. Pearson correlation coefficients representing the trade data analysis of six Turkic states and Tajikistan for gravity analysis. Statistical significance is indicated by and
, denoting significance levels of 1% and 5% respectively
In the research conducted by Udeagha and Breitenbach (Citation2021), our investigation incorporated conventional unit root tests as well as cross-sectional dependence tests (Pesaran, Citation2021). Our findings reveal that all variables within the dataset exhibit stationarity at their initial level, except for the variable . However, upon differencing at the first order, the variable
demonstrates stationarity with a significance level of 1%.
4.2. Gravity model
The gravity model, derived from the Law of Universal Mass Gravity formulated by Isaac Newton in the 17th century, is widely used in international economics to analyze bilateral trade flows between countries. It is considered a workhorse in applied international trade. It has gained popularity among policymakers and researchers due to its ability to assess the impact of policies on actual trade (Soloaga & Wintersb, Citation2001).
The specifications of the gravity model were initially described by Linder (Citation1961), Tinbergen (Citation1962), and Pöyhönen (Citation1963). Over time, empirical studies utilizing the gravity model in international trade analysis have increased, incorporating a more significant number of explanatory variables and estimation techniques. The model’s power to explain bilateral trade between countries has remained robust despite changes in independent variables and estimation methods.
The basic representation of the gravity model equation for international trade is presented as Equation 1. It shows that the trade volume between two countries, , depends on the economic size of each country,
,
, and the distance between them,
. The equation includes a constant term,
, to account for other factors influencing trade.
To linearize the equation, we take the logarithms of both sides, resulting in Equation 2, which represents the simplest form of the gravity model. In this form, the trade volume is the dependent variable, while GDP and the distance between countries are independent variables. The countries’ sizes are expected to positively affect trade, as an increase in GDP leads to better production and export capacity. Conversely, distance is expected to act as a cost factor, negatively impacting trade. Therefore, the gravity model captures the positive relationship between GDP and trade volume while considering the negative influence of distance.
The basic gravity model can be expanded to include additional economic and physical characteristics of countries, such as population, land area, and transaction costs, including factors like adjacency and cultural similarities. The equation can also account for other factors like land borders, island status, cultural affinities (such as language similarity), and membership in the same trade organizations. The theoretical framework utilized in this study, represented by Equation 3, aligns with the gravity model.
where;
represents the exports from country
to country
in year
,
is the constant term, which captures the specific effects associated with each bilateral trade flow. It serves as a control for all the unobserved factors that are unique to each trade flow and remain constant over time,
are the coefficients to be estimated,
denote the GDP of country
and country
in year
, respectively,
represent the population of country
and country
in year
, respectively,
indicate the land area of country
and country
, respectively,
represents the great circle distance between country
and country
,
denotes the distance between the languages talked in country
and country
,
is a dummy variable equal to 1 if there is a border between country
and country
, and 0 otherwise,
is a dummy variable equal to 1 if both country
and country
are members of the OTS in year
, and 0 otherwise.
Beaufils and Tomin (Citation2020) presents an innovative approach to automated language classification by leveraging computational linguistics, aiming to overcome the limitations associated with traditional methods. The research demonstrates the effectiveness of this distance-based technique in accurately categorizing languages and confirms hypotheses regarding the distant connections among languages, such as Eurasiatic and Austric. Furthermore, the study provides empirical evidence supporting the internal classifications within established language families. Since the countries under analysis speak Turkic languages with a common origin, the study adopts a continuous numerical representation instead of a binary variable. The proposed methodology assigns a numerical distance ranging from 0 to 100 to measure language similarity, with a value of 0 indicating identical languages.
To estimate the coefficients, denoted as , within the gravity model framework, we initially employed the Ordinary Least Squares (OLS) method. However, heteroscedasticity in the residuals poses a significant challenge in cross-sectional data with high variance. Heteroscedasticity violates one of the OLS method’s fundamental assumptions, namely homoscedasticity, which assumes a consistent variance of errors across all observations. We utilized the Poisson Pseudo Maximum Likelihood (PPML) approach as an alternative estimation method to robustness check. The PPML method is particularly suitable for count data models, such as the gravity model, where the dependent variable represents the magnitude of trade flows between countries. This method accounts for the dependent variable’s discrete nature and allows for heteroscedasticity within the error term.
4.3. TOPSIS
The TOPSIS method facilitates the identification of positive (closest) and negative (furthest) solution approaches by evaluating multiple alternatives based on predetermined criteria. It is utilized to determine the optimal solution to problems in various domains, including accounting and finance, product design, market selection, risk analysis, and facility location selection. The process begins with creating a decision matrix, which ranks the alternatives based on their superiority concerning the criteria and provides the necessary values for decision making. In the decision matrix, the index represents the alternatives decision makers can choose from, while the index
represents the criteria used to measure performance (denoted as
).
The matrix is normalized per column to achieve a standardized scale across criteria. Subsequently, it is multiplied by weights that are determined either through a survey or based on the prior knowledge of a domain expert. These weights are assigned so that they sum up to 1.
Using the weighted and normalized decision matrix, the positive ideal solution () and the negative ideal solution (
) are determined. The positive ideal solution optimizes the solution by maximizing the benefit criteria, while the negative ideal solution minimizes it. The formation of the ideal solutions is carried out as follows:
where stands for the benefit and
for the cost criteria.
Separation measurements are calculated to quantify the deviations in the positive ideal and negative ideal solution sets. These measurements utilize the Euclidean Distance; however, alternative distance metrics can also be utilized. The deviation values at the decision points are defined as the positive ideal separation () and the negative ideal separation (
) as follows:
Ideal and negative ideal separation criteria are utilized to compute the relative closeness of the decision points to the ideal solution. The following formula is employed to calculate the closeness of alternative to the ideal solution:
The value of ranges between 0 and 1, where a higher value indicates a closer proximity to the ideal solution, while a lower value suggests a closer proximity to the negative ideal solution. The alternatives are then ranked in descending order based on the calculated value
which represents their performance.
5. Empirical results
5.1. Gravity model results
The OLS results for the gravity model, which aims to explain the export behavior between six Turkic countries and Tajikistan, are presented in Table . The dependent variable is the natural logarithm of exports (). The coefficients of the explanatory variables provide insights into the determinants of exports within this specific context. The model’s goodness-of-fit is assessed by examining the R-squared statistic, which measures the proportion of the export variation explained by the model. The R-squared value is 0.732, indicating that the model accounts for a substantial portion of the variation in exports, where the adjusted R-squared value is 0.728.
Table 5. OLS results for the gravity model where the dependent variable is lnEX
The coefficient estimates reveal several findings. The logarithm of the GDP of the exporting country () has a positive and statistically significant impact on exports (
), which suggests that an increase in the exporting country’s GDP leads to a rise in exports, indicating the presence of a strong economic relationship.
Similarly, the logarithm of the GDP of the importing country () positively influences exports (
). This result implies that higher economic activity in the importing country stimulates exports, indicating the presence of market opportunities.
Population size also plays a significant role in driving exports. Both the exporting country’s population () and the importing country’s population (
) have positive coefficients (
and
, respectively). Larger populations in either the exporting or importing country contribute to increased export volumes, potentially due to greater demand or production capacity.
Moreover, the size of the land area of the exporting country () and the importing country (
) has positive effects on exports (
and
, respectively). This implies that larger land areas provide more opportunities for trade and economic integration, promoting exports.
The distance between the exporting and importing countries () has a negative coefficient (
), indicating that more geographical distance hampers trade as expected by the literature. This outcome suggests that trade costs and logistical barriers, such as transportation and communication costs, may hinder the export flow between these Turkic countries.
Furthermore, the coefficient of the logarithm of linguistic distance () is negative and statistically significant (
). This finding suggests that linguistic similarity between countries fosters trade cooperation and reduces trade barriers, increasing exports.
Regarding the variable representing whether the exporting and importing countries share a border (), the coefficient is negative but statistically insignificant (
), implying that the presence of a border does not significantly affect export levels in this context.
The membership variable, which is the focus of this research, has a positive and significant impact on exports (,
). This suggests that being a member of OTS enhances trade integration and cooperation among Turkic countries, resulting in increased exports.
The constant term () has a negative coefficient (
), indicating that when all the explanatory variables are zero, there is a negative baseline level of exports. This could be attributed to unobserved factors or omitted variables that affect exports but are not captured by the included variables in the model.
As anticipated, the data utilized in our analysis exhibits heteroscedasticity due to variations across time and cross-sectional units. To ensure the robustness of our findings, we employ the Eicker-White covariance Poisson Pseudo-Maximum Likelihood (PPML) method, which has been widely employed in previous research to address this issue (Eicker, Citation1963), (White, Citation1980). The PPML method is considered a superior approach for mitigating the impact of heteroscedasticity and is preferred over the conventional Ordinary Least Squares (OLS) method (Udeagha & Breitenbach, Citation2021).
The PPML results, as presented in Table , are compared to the OLS results to assess the consistency and reliability of the findings. The coefficient estimates for most variables exhibit consistent direction and statistical significance. This consistency indicates that the relationships identified in the OLS analysis are robust and not solely driven by heteroscedasticity.
Table 6. PPML result for the gravity model where dependent variable is integer EX
Regarding magnitude, the PPML estimates show slightly higher coefficients for most variables than the OLS estimates. For instance, the coefficients of ,
,
,
, and
are all higher in the PPML results. This suggests that the impact of these variables on exports may be even more substantial when considering the Poisson framework.
Regarding the variables and
, there are slight differences in the PPML estimation. While the
coefficient remains positive, indicating a positive relationship between the importing country’s land area and exports, its statistical significance decreases slightly. On the other hand, the coefficient of
remains positive and significant, reaffirming the positive effect of OTS membership on exports.
The PPML results enhance the robustness of the OLS findings, as most coefficient estimates exhibit consistent direction and statistical significance. These findings reinforce the reliability and robustness of the identified determinants of exports in the gravity model analysis and instill confidence in the validity of the study’s conclusions.
5.2. Gain per state after establishment
The organization’s member states were ranked based on their trade with each other during the periods of 2000–2009 and 2010–2019 to compare their performance before and after the establishment of the organization. The countries were considered as alternatives, and the criteria were defined as follows: exports to Turkic states (A1), imports from Turkic states (A2), the percentage share of exports to Turkic states in total exports (A3), and the percentage share of imports from Turkic states in total imports (A4). These values were aggregated as sums for the respective years. In this analysis, an increase in the share of members in imports was regarded as a positive indicator, given the organization’s activities. However, total imports were still considered a negative indicator. Table illustrates the steps of the TOPSIS algorithm for 2000–2009 and 2010–2019.
Table 7. The steps of the TOPSIS algorithm for the years 2000–2009 and 2010–2019 where the criteria were determined as exports to Turkic states (A1), imports from Turkic states (A2), the percentage share of exports to Turkic states in all exports (A3), and the percentage share of imports from Turkic states in all imports (A4)
After obtaining the normalized and equally weighted decision matrix, the positive ideal () and negative ideal (
) values were calculated. To obtain
, the largest value for the criteria that should be maximized and the smallest values for the criteria that should be minimized were selected among the criteria values. For
, the process was reversed. The smallest value was chosen for the criteria that should be maximized, and the largest value was selected for the criteria that should be minimized among the criteria values.
The rankings were determined based on trade between all four states from 2000 to 2009, before the OTS was established, using the TOPSIS method. According to the performance values, Kazakhstan (0.656) ranked first, Turkey (0.631) second, Azerbaijan (0.565) third, and Kyrgyzstan (0.368) fourth. These results are a basis for evaluating the organization’s benefits to its member countries by comparing them to the performance values after its establishment. In the second part of the analysis, the trade data of the member states from 2010 to 2019 was aggregated without any changes in the criteria and weight values. The same procedures were sequentially applied. Kazakhstan (0.612), which had the highest trade performance with other countries before the organization’s establishment, surpassed Turkey (0.642) after the organization’s establishment. Azerbaijan (0.553) and Kyrgyzstan (0.357) followed Kazakhstan as presented in Table .
The results indicate that Turkey has benefited the most in trade with member states within the OTS—however, more than these results are needed to evaluate the organization’s effectiveness fully. Therefore, an analysis of the trade among the founding member states from 2000 to 2019 was conducted. This analysis aimed to rank the trade performance of the member states on a yearly basis. The ranking allowed for a comparison of the trade volume of member states before and after the organization’s establishment, thus determining the extent to which the organization has benefited its members in terms of trade.
5.3. Yearly performance comparison per state
In this analysis, various criteria were considered: total exports (B1), total imports (B2), total exports to Turkic states (B3), total imports from Turkic states (B4), the share of Turkic states in total exports (B5), and the share of Turkic states in total imports (B6). It was expected that total imports and imports from Turkic states would be minimized to maximize the benefit for the country. Conversely, the share of Turkic states in total imports was expected to be at the highest level, as importing from member states instead of other countries contributes to the organization’s development and serves the member states’ common interests. The analysis was conducted based on individual years. For clarity and conciseness, Table provides the analysis details for Turkey’s yearly comparison.
Table 8. The steps of the TOPSIS algorithm for the yearly comparison between 2000–2019 for Turkey
The evaluation of Turkey’s trade with the member states over the years is presented in Table . Overall, the years 2014, 2013, and 2012 ranked highest in terms of trade performance. When considering the first 10 years as a performance criterion, 2007 ranked 8th, and 2008 ranked 10th. While there was a significant level of activity during these years, trade with the Turkic states experienced a decline in 2017, 2016, and 2018, with a recovery observed in 2019.
Table 9. Relative closeness for alternative years for Turkey
According to the performance evaluation presented in Table , 2019 ranked first in terms of Azerbaijan’s trade performance with the member states of the OTS. However, it is noteworthy that five of the top 10 performing years occurred before Azerbaijan joined the OTS (2007, 2008, 2000, 2002, and 2001). This indicates that establishing the OTS had a neutral effect on Azerbaijan’s trade performance. This observation can be attributed to oil and natural gas dominance in Azerbaijan’s exports, with raw material exports accounting for approximately 90 percent of its total exports.
Table 10. Relative closeness for alternative years for Azerbaijan
Kazakhstan’s yearly performance evaluation by years is shown in Table . The analysis of Kazakhstan’s foreign trade performance with other member states of the OTS indicates a generally positive trend in the years following the organization’s establishment. This is evident from the fact that these post-establishment years occupy the top six positions in the performance evaluation. While 2008 and 2002 exhibited slightly better performance than 2017 and 2016, the period following the establishment of the OTS demonstrates a more robust trade performance for Kazakhstan. It is worth noting that Turkey, being the largest economy among the OTS member states, has recently encountered economic and political crises, which might have also impacted the trade performance of other countries. However, the swift recovery in performance observed after 2018 suggests that the OTS has positively influenced Kazakhstan’s foreign trade.
Table 11. Relative closeness for alternative years for Kazakhstan
In the evaluation of Kyrgyzstan’s yearly trade performance, as shown in Table , the top 10 positions are occupied by the years 2014, 2012, 2011, and 2017, all of which are after the establishment of the OTS. However, it is noteworthy that years when Kyrgyzstan was not a member of the OTS also appear in the top 10, albeit with performance values relatively close to those of the post-establishment years. Kyrgyzstan has the smallest economy among the member states of the OTS, and since gaining independence, it has encountered economic and technological development challenges. Therefore, it is difficult to draw a definitive conclusion regarding the positive impact of OTS membership on Kyrgyzstan’s trade performance.
Table 12. Relative closeness for alternative years for Kyrgyzstan
6. Conclusion and policy suggestions
This study aimed to assess the impact of the OTS on the foreign trade of its member countries by utilizing the gravity model and the TOPSIS method. The OTS was established in 2009 and commenced operations in 2010 to enhance economic, political, cultural, military, and technological ties among its member states. The gravity model employed panel data from six Turkic countries and Tajikistan, four of which became co-members after 2009. Six TOPSIS analyses were conducted using export and import data from 2000 to 2019 to evaluate the organization’s contribution to its member countries. The analysis aimed to compare the foreign trade performance of member countries before and after the establishment of the OTS and assess the organization’s impact on trade between member countries over the years.
The first analysis, employing the gravity model, involved estimating coefficients using ordinary least squares (OLS) and verifying their robustness using the Poisson Pseudo Maximum Likelihood (PPML) method. Empirical findings indicate that the GDP values of both exporting and importing countries positively influence trade. Conversely, physical distance has a statistically significant negative impact, consistent with existing literature. Furthermore, language dissimilarity exhibits a statistically significant negative effect as an indicator of cultural divergence. The coefficient associated with the dummy variable representing OTS membership positively affects exports to other Turkic countries over time. However, despite lacking statistical significance, the negative coefficient value observed for the border dummy variable challenges initial expectations. This may be attributed to the significant trade volume between Kazakhstan and Turkey driven by their economic significance within the group, outweighing other factors, such as the absence of a shared border. Additionally, attributes such as population and land area, reflecting country size, positively affect trade, as expected.
The second analysis calculated the total trade volume between member states from 2000 to 2009 and its ratio to their total trade since the organization’s establishment. The aim was to measure the trade performance of member states with each other before and after the OTS’s founding. According to the performance values, Kazakhstan ranked first, Turkey second, Azerbaijan third, and Kyrgyzstan fourth before the organization’s establishment. Evaluating trading data between 2010 and 2020 using the same criteria revealed the following rankings: Turkey surpassed Kazakhstan in trade performance, while Azerbaijan and Kyrgyzstan followed. Only Turkey experienced an increase, suggesting that it derived more economic benefits from its membership than other members.
The trade performance of founding members from 2000 to 2019 was analyzed to further assess the organization’s functionality. The analysis aimed to rank countries’ trade performances by year, comparing periods before and after the OTS’s establishment. Turkey consistently demonstrated strong performances in trade with other member states, particularly in 2014, 2013, and 2012, and ranked within the top 10 in 2007 and 2008. Azerbaijan’s trade performance showed a neutral effect from OTS membership, with 2019 ranking first and five years outside the organization also ranking within the top 10. Kazakhstan experienced positive effects from membership, with its trade performance evaluation occupying the first six places in the years following the establishment of the OTS. Kyrgyzstan, the smallest member in economic volume, had mixed results, with 2014, 2012, 2011, and 2017 ranking within the top 10. However, years outside of OTS membership performed similarly regarding performance values. Overall, the results indicate that OTS membership positively impacted the economic well-being of Turkey and Kazakhstan, while the effects on Azerbaijan and Kyrgyzstan varied.
The results obtained from the TOPSIS method support the findings of the gravity model analysis. The gravity model confirmed that the GDP values of exporting and importing countries have a positive impact on trade, consistent with economic theory. This suggests that countries with larger economies are more likely to engage in higher levels of trade. Similarly, the TOPSIS method analysis demonstrated that Turkey and Kazakhstan, with relatively larger economies among OTS member states, experienced positive effects from their membership in terms of trade performance. This aligns with the gravity model’s findings that GDP significantly influences trade. Additionally, the negative impact of physical distance and language dissimilarity on trade, as identified in the gravity model, supports the TOPSIS results, indicating that these factors are considered in evaluating the trade performance of member states. Therefore, the alignment between the results obtained from the gravity model and the TOPSIS method enhances the validity and robustness of the empirical analysis conducted in the econometric field.
Based on these findings, the policy implication suggests that current OTS member countries should prioritize enhancing their membership’s attractiveness to other Turkic countries. This prioritization stems from the recognition that OTS membership highlights the favorable impact of regional integration initiatives on trade flows, benefiting all stakeholders. To achieve this objective, governments should actively strengthen collaboration within the OTS and explore opportunities for deeper economic integration. Measures to reduce trade barriers, harmonize regulations, and establish preferential trade agreements should be pursued to facilitate intra-regional trade. The organization’s initiatives, projects in the trade sector, and agreements and partnerships with other regional and international organizations likely contributed to increased trade among member states by enhancing the organization’s visibility. The absence of a significant effect on trade between Turkic states based on the presence of borders indicates that prospective members need not share borders with existing members to derive benefits from the organization. Instead, policymakers should focus on implementing measures that stimulate economic growth within each country, considering GDP’s positive and substantial impact on exports. Such measures entail promoting investment, innovation, and the development of productive sectors to enhance overall economic activity and create a conducive environment for exports, maximizing the benefits gained from OTS membership. The negative coefficient associated with distance underscores the importance of improving infrastructure and logistics networks to reduce trade costs. Policymakers should prioritize investments in transportation, communication, and trade facilitation infrastructure.
The negative coefficient of linguistic distance suggests that fostering cultural cooperation among Turkic countries can facilitate trade. Governments could allocate resources to language programs, cultural exchanges, and initiatives that encourage communication and understanding between trading partners. Policymakers should also consider establishing or reinforcing existing regional cooperation mechanisms to promote collaboration in trade facilitation, customs cooperation, and information sharing. This may involve the creation of joint committees, working groups, and regular meetings to address trade-related challenges and promote dialogue and cooperation among Turkic countries. OTS membership should provide opportunities for enhanced cooperation in education and human capital development. Non-member Turkic nations can enhance the quality and skills of their workforce by aligning their education systems, vocational training programs, and research and development initiatives with the standards and practices of other Turkic states. This alignment will contribute to increased productivity, innovation, and competitiveness, establishing a solid foundation for sustained economic growth.
While these findings provide valuable insights into the effectiveness of the OTS in promoting trade among its member countries, several limitations should be acknowledged. For instance, the study only analyzed the foreign trade of Turkic countries and did not consider other areas of cooperation within the organization, such as culture, education, and security. Future studies could investigate the extent to which the OTS has impacted other areas of cooperation and consider additional factors that may have influenced the trade performance of member countries. Similarly, this study primarily investigates the relative trade comparison within the Turkic world. To provide a more comprehensive understanding of the trade relations of these countries on a global scale, the panel data could be expanded to include other regions and countries. By incorporating a broader perspective, researchers can gain insights into the positioning of OTS member countries in the global trade landscape. It might also be useful to include a Rest of the World or some other pseudo-instrument so as to calibrate the findings relating to the Turkic Republics. Additionally, it would be beneficial to examine the specific mechanisms through which the OTS has influenced trade, such as trade agreements or joint projects. Comparing the performance of the OTS with that of the Commonwealth of Independent States (CIS), another organization with a similar purpose, scope, and membership, by analyzing economic and foreign trade data could provide further insights into the overall contribution of each organization to its member countries.
Disclosure statement
No potential conflict of interest was reported by the author(s).
Supplementary material
Supplemental data for this article can be accessed online at https://doi.org/10.1080/23311886.2023.2288370
Additional information
Notes on contributors

Ahmet Faruk Çetinkaya
Ahmet Faruk Çetinkaya is an accomplished researcher with a robust academic background in international trade and logistics. Graduating from Gazi University with a bachelor’s degree in International Trade and later earning a master’s degree in International Trade and Logistics from Kayseri University, his primary research expertise lies in multi-criteria decision making methodologies, crucial in addressing complex problems across various domains. Beyond his core research interests, Ahmet Faruk Çetinkaya maintains a broader curiosity about the Turkic world, encompassing topics in trade, defense, and regional integrations.
Neslihan Demirel
Dr. Neslihan Demirel completed her undergraduate, graduate, and doctoral studies in the field of Industrial Engineering. She has been working as a faculty member at various universities in Türkiye for 18 years. She is currently working as an associate professor at Kayseri University, Department of Industrial Engineering. Her research interests include optimization, logistics and supply chain management, network design and modeling, and multi-criteria decision-making.
References
- Abazov, R. (1999). Policy of economic transition in Kyrgyzstan. Central Asian Survey, 18(2), 197–35. https://doi.org/10.1080/02634939995687
- Ağaç, G., & Birdoğan, B. (2016). Sağlık alanında çok kriterli karar verme teknikleri kullanımı: Literatür incelemesi. Hacettepe Sağlık İ daresi Dergisi, 19(3), 343–363.
- Akilli, E. (2019). Türksoy, Türk Keneşi ve Kültürel Diplomasi: İşlevselciliğin Yeniden Tahayyülü. Bilig, 91(91), 1–25. https://doi.org/10.12995/bilig.9101
- Aktaş, N., & Demirel, N. (2021). A hybrid framework for evaluating corporate sustainability using multi-criteria decision-making. Environment Development and Sustainability, 23(10), 15591–15618. https://doi.org/10.1007/s10668-021-01311-5
- Aktürk, Ş. (2006). Turkish–Russian relations after the cold war (1992–2002). Turkish Studies, 7(3), 337–364. https://doi.org/10.1080/14683840600891034
- Alleyne, A., & Lorde, T. (2014). A gravity model approach to analyzing the trade performance of caricom members states. Applied Econometrics and International Development, 14(2), 145–160.
- Amirbek, A., Anuarbekuly, A., & Makhanov, K. (2017). Türk dili konuşan ülkeler entegrasy- onu: Tarihsel geçmişi ve kurumsallaşması. Bölgesel Araştırmalar Dergisi, 1(3), 164–204.
- Avikal, S., Singh, A. K., Kumar, K. N., & Badhotiya, G. K. (2021). A fuzzy-ahp and topsis based approach for selection of metal matrix composite used in design and structural applications. Materials Today: Proceedings, 46, 11050–11053. https://doi.org/10.1016/j.matpr.2021.02.161
- Aynagöz Çakmak, Ö., Eralp, A., & Tunçay, C. M. (2015). Trade facilitation and black sea economic cooperation organization: Analysis of turkey with the gravity model approach. The Macrotheme Review, 8(4), 99–108.
- Baghirov, O. (2022). The organization of Turkic States’ economic potential and cooperation prospects among its members. Perceptions: Journal of International Affairs, 27(1), 53–73.
- Baki, P. M. (2014). From a cooperation process to a cooperation mechanism in Eurasia: Turkic council. Bilge Strateji, 6(11), 133–162.
- Batsaikhan, U., & Dabrowski, M. (2017). Central Asia—twenty-five years after the breakup of the USSR. Russian Journal of Economics, 3(3), 296–320. https://doi.org/10.1016/j.ruje.2017.09.005
- Beaufils, V., & Tomin, J. (2020). Stochastic approach to worldwide language classification: The signals and the noise towards long-range exploration.
- Bulut, E., & Şimşek, A. İ. (n.d.). Evaluation of financial performance of some technology companies traded in borsa Istanbul by topsis method. Fırat Üniversitesi Uluslararası İktisadi ve İdari Bilimler Dergisi, 6(2), 103–130.
- Çalışır, A. (2019). The cooperation council of Turkic speaking states: Regional cooperation and integration in central Asia [ Master’s thesis, Anadolu Üniversitesi-Sosyal Bilimler Enstitüsü].
- Çelikbilek, Y., & Tüysüz, F. (2020). An in-depth review of theory of the topsis method: An experimental analysis. Journal of Management Analytics, 7(2), 281–300. https://doi.org/10.1080/23270012.2020.1748528
- Cornell, S. E. (1997). Undeclared war: The Nagorno-Karabakh conflict reconsidered. Journal of South Asian and Middle Eastern Studies, 20, 1–23.
- De Almeida, A. T., Alencar, M. H., Garcez, T. V., & Ferreira, R. J. P. (2017). A systematic literature review of multicriteria and multi-objective models applied in risk management. IMA Journal of Management Mathematics, 28(2), 153–184. https://doi.org/10.1093/imaman/dpw021
- De Brito, M. M., & Evers, M. (2016). Multi-criteria decision-making for flood risk management: A survey of the current state of the art. Natural Hazards and Earth System Sciences, 16(4), 1019–1033. https://doi.org/10.5194/nhess-16-1019-2016
- Demir, C. (2022). The organization of Turkic states: Implications for the regional balance of power. Güvenlik Stratejileri Dergisi, 39–71. (Spec. Issu). https://doi.org/10.17752/guvenlikstrtj.1104776
- Djanibekov, N., Rudenko, I., Lamers, J., & Bobojonov, I. (2010). Pros and cons of cotton production in Uzbekistan.
- Eicker, F. (1963). Asymptotic normality and consistency of the least squares estimators for families of linear regressions. Annals of Mathematical Statistics, 34(2), 447–456. https://doi.org/10.1214/aoms/1177704156
- Ekanayake, E., Mukherjee, A., & Veeramacheneni, B. (2010). Trade blocks and the gravity model: A study of economic integration among asian developing countries. Journal of Economic Integration, 25(4), 627–643. https://doi.org/10.11130/jei.2010.25.4.627
- Erol, M. S., & Çelik, K. E. (2017). Dil ve Güvenlik: Avrupa Güvenlik ve İşbirliği Teşkilatı’nın Azınlık Dili Politikası. Çanakkale Araştırmaları Türk Yıllığı, 15(23), 297–316. https://doi.org/10.17518/canakkalearastirmalari.348268
- Eygü, H. (2022). Panel data analysis in investigation the economic growth of Turkic states. Uluslararası Sosyal Bilgilerde Yeni Yaklaşımlar Dergisi (IJONASS), 6(1), 36–46. https://doi.org/10.38015/sbyy.1075022
- Geybullayev, G., & Kurubaş, E. (2002). Türk cumhuriyetlerinin entegrasyonu: Fırsatlar, sorunlar ve çözüm önerileri. Süleyman Demirel Üniversitesi İktisadi ve İdari Bilimler Fakültesi Dergisi, 7(1), 19–45.
- Gharleghi, B., & Popov, V. (2018). Changes in the geographical structure of trade in central Asia: Real flows in the 1989-2016 period versus gravity model predictions. SSRN Electronic Journal. Available at SSRN 3250746. https://doi.org/10.2139/ssrn.3250746
- Govindan, K., Rajendran, S., Sarkis, J., & Murugesan, P. (2015). Multi criteria decision making approaches for green supplier evaluation and selection: A literature review. Journal of Cleaner Production, 98, 66–83. https://doi.org/10.1016/j.jclepro.2013.06.046
- Hatemi-J, A. (2002). Export performance and economic growth nexus in Japan: A bootstrap approach. Japan and the World Economy, 14(1), 25–33. https://doi.org/10.1016/S0922-1425(01)00071-8
- Hezer, S., Gelmez, E., & Özceylan, E. (2021). Comparative analysis of topsis, vikor and copras methods for the COVID-19 regional safety assessment. Journal of Infection and Public Health, 14(6), 775–786. https://doi.org/10.1016/j.jiph.2021.03.003
- Ho, W., Xu, X., & Dey, P. K. (2010). Multi-criteria decision making approaches for supplier evaluation and selection: A literature review. European Journal of Operational Research, 202(1), 16–24. https://doi.org/10.1016/j.ejor.2009.05.009
- Humbatov, M., & Sari, K. (2017). Turkic Council countries: Infrastructure, trade, logistics and transportation. Mahir Humbatov.
- Irshad, M. S., Xin, Q., Shahriar, S., & Arshad, H. (2017). A panel data analysis of china’s trade pattern with OPEC members: Gravity model approach. Asian Economic and Financial Review, 8(1), 103–116. https://doi.org/10.18488/journal.aefr.2018.81.103.116
- Jadhav, S., & Ghosh, I. (2023). Future prospects of the gravity model of trade: A bibliometric review (1993–2021). Foreign Trade Review, 00157325221140154. https://doi.org/10.1177/00157325221140154
- Karakaş, Ü. Ç., Karakaş, A., & Topal, S. (2019). Economic growth effects of economic integration: An economic analysis on Turkish economy in the context of the European Union and shanghai cooperation organization. Alphanumeric Journal, 7(2), 185–204. https://doi.org/10.17093/alphanumeric.604525
- Kawasaki, K., & Sato, K. (2021). A new assessment of economic integration in east asia: Application of an industry-specific g-ppp model. Japan and the World Economy, 60, 101105. https://doi.org/10.1016/j.japwor.2021.101105
- Kaygusuz, Y. (2021). Kuruluşunun 10. yılında türk konseyi’nin türkiye ile diğer üye ülkeler arasındaki ticarette etkileri. TESAM Akademi Dergisi, 8(1), 199–236. https://doi.org/10.30626/tesamakademi.748658
- Keser, A., Çütcü, İ., & Eren, V. M. (2021). Does country-level governance matter for national development? An analysis on the founding states of Turkic Council. Applied Economics, 54(5), 522–535. https://doi.org/10.1080/00036846.2021.1966373
- Kilic, H. S., Demirci, A. E., & Delen, D. (2020). An integrated decision analysis methodology based on if-dematel and if-electre for personnel selection. Decision Support Systems, 137, 113360. https://doi.org/10.1016/j.dss.2020.113360
- Kilic, H. S., & Yalcin, A. S. (2021). Comparison of municipalities considering environmental sustainability via neutrosophic dematel based topsis. Socio-Economic Planning Sciences, 75, 100827. https://doi.org/10.1016/j.seps.2020.100827
- Lavallée, E., & Lochard, J. (2015). The comparative effects of independence on trade. Journal of Comparative Economics, 43(3), 613–632. https://doi.org/10.1016/j.jce.2014.11.001
- Linder, S. B. (1961). An essay on trade and transformation. Almqvist & Wiksell Stockholm.
- Lupo, T., & Bellomo, E. (2019). Dineserv along with fuzzy hierarchical topsis to support the best practices observation and service quality improvement in the restaurant context. Computers & Industrial Engineering, 137, 106046. https://doi.org/10.1016/j.cie.2019.106046
- Maharramov, S. (2021). Econometric assessment of azerbaijan’s logistics capabilities in terms of relations with Turkic-speaking states. Economic Herald of Donbass. https://doi.org/10.12958/1817-3772-2021-4(66)-45-52
- Masca, M. (2017). Economic performance evaluation of European Union countries by topsis method. North Economic Review, 1(1), 83–94.
- Memari, A., Dargi, A., Jokar, M. R. A., Ahmad, R., & Rahim, A. R. A. (2019). Sustainable supplier selection: A multi-criteria intuitionistic fuzzy topsis method. Journal of Manufacturing Systems, 50, 9–24. https://doi.org/10.1016/j.jmsy.2018.11.002
- Mercan, M., & Azer, O. A. (2013). The relationship between economic growth and income distribution in turkey and the Turkish republics of central Asia and Caucasia: Dynamic panel data analysis with structural breaks. Eurasian Economic Review, 3, 165–182. https://doi.org/10.14208/eer.2013.03.02.004
- Mert, O. (2015). Türk konseyi (keneşi) türk üniversiteler birliği ve türk üniversiteler birliği i. genel kurulu. Atatürk Üniversitesi Türkiyat Araştırmaları Enstitüsü Dergisi, 53(53), 273–273. https://doi.org/10.14222/Turkiyat1335
- Metin, I., & Tepe, G. (2021). Gravity model: A bibliometric analysis and detailed overview. International Journal of Business and Society, 22(1), 365–381. https://doi.org/10.33736/ijbs.3183.2021
- Micale, R., La Fata, C. M., & La Scalia, G. (2019). A combined interval-valued electre tri and topsis approach for solving the storage location assignment problem. Computers & Industrial Engineering, 135, 199–210. https://doi.org/10.1016/j.cie.2019.06.011
- Muradov, M. (2021). The Zangezur corridor. an Azerbaijani perspective. New Eastern Europe, 06(49), 32–36.
- Mustofaev, M. (2022). The organization of Turkic states: A new approach to global and regional challenges. Perceptions: Journal of International Affairs, 27(1), 105–120. https://doi.org/10.37547/ot/vol-01issue-02-17
- Nakhchivan Agreement. (2009). https://www.turkkon.org/assets/pdf/temel belgeler/nakhchivan-agreement-on-the-establishment-of-the-copperation-council-of-turkic-speaking-states-1-en.pdf
- Ngepah, N., & Udeagha, M. C. (2018). African regional trade agreements and intra-African trade. Journal of Economic Integration, 33(1), 1176–1199. https://doi.org/10.11130/jei.2018.33.1.1176
- Ngepah, N., & Udeagha, M. C. (2019). Supplementary trade benefits of multi-memberships in African regional trade agreements. Journal of African Business, 20(4), 505–524. https://doi.org/10.1080/15228916.2019.1584719
- Pesaran, M. H. (2021). General diagnostic tests for cross-sectional dependence in panels. Empirical Economics, 60(1), 13–50. https://doi.org/10.1007/s00181-020-01875-7
- Pöyhönen, P. (1963). A tentative model for the volume of trade between countries. The Review of Economics and Statistics, 67(3), 93–100.
- Sakthivel, G., Ilangkumaran, M., & Gaikwad, A. (2015). A hybrid multi-criteria decision modeling approach for the best biodiesel blend selection based on anp-topsis analysis. Ain Shams Engineering Journal, 6(1), 239–256. https://doi.org/10.1016/j.asej.2014.08.003
- Şanlı, B. (2008). Ekonomik entegrasyon teorisi çerçevesinde avrasya birliği’nin olabilirliği. Atatürk Üniversitesi İktisadi ve İdari Bilimler Dergisi, 22(1), 13–30.
- Şanlı, F. B. (2004). Küreselleşme ve ekonomik entegrasyonlar. Fırat Üniversitesi Doğu Araştırmaları Dergisi, 2(3), 160–166.
- Sapiyev, Y. (2017). Kazakhstan’s role in strengthening the Turkic council and regional cooperation in central asia [ Doctoral dissertation, ISTANBUL AYDIN UNIVERSITY INSTITUTE OF SOCIAL SCIENCES].
- Sarkar, A., Ghosh, A., Karmakar, B., Shaikh, A., & Mondal, S. P. (2020). Application of fuzzy topsis algorithm for selecting best family car. 2020 International Conference on Decision Aid Sciences and Application (DASA) (pp. 59–63).
- Sharma, P., Rohatgi, S., & Jasuja, D. (2022). Scientific mapping of gravity model of international trade literature: A bibliometric analysis. Journal of Scientometric Research, 11(3), 447–457. https://doi.org/10.5530/jscires.11.3.48
- Shih, H.-S., Shyur, H.-J., & Lee, E. S. (2007). An extension of topsis for group decision making. Mathematical and Computer Modelling, 45(7–8), 801–813. https://doi.org/10.1016/j.mcm.2006.03.023
- Şimşek, T., & Destebaşi, E. (2020). The relationship between global economic integration, human capital investments and corruption in Turkic states. Third Sector Social Economic Review, 55(2), 808–827.
- Şimşek, H. A., & Şimşek, N. (2017). Regional integrations in globalization process: Lessons for Turkic speaking countries. Sosyoekonomi, 25, 161–172. https://doi.org/10.17233/sosyoekonomi.345493
- Sobirov, J. (2020). Participation of Uzbekistan in the cooperation Council of Turkic speaking states 8th International Scientific and Practical Conference December 26, 2020 3 (InterConf)726–729 , Online.
- Soloaga, I., & Wintersb, L. A. (2001). Regionalism in the nineties: What effect on trade? The North American Journal of Economics & Finance, 12(1), 1–29. https://doi.org/10.1016/S1062-9408(01)00042-0
- Sonmez, F., Baysal, G., Baysal, I. A., & Bademcioglu, M. (2023). Determining the financial performances of BIST100 energy companies by topsis method. PressAcademia Procedia, 16. https://doi.org/10.17261/Pressacademia.2023.1680
- Tahir, I. Z., Ramazan, M. M., & Shamistan, O. P. (2021). The geopolitical position of the Turkic world and the geography of transport and economic relationships. Scientific journal Vestnik NAS RK, 1(1), 104–110. https://doi.org/10.32014/2021.2518-1467.14
- Temurshoev, U. (2004). Key sectors in the Kyrgyzstan economy. Cerge-Ei Discussion Paper Series, 135.
- Tinbergen, J. (1962). Shaping the world economy; suggestions for an international economic policy. The Economic Journal, 79, 301.
- Udeagha, M. C., & Breitenbach, M. C. (2021). Estimating the trade-environmental quality relationship in SADC with a dynamic heterogeneous panel model. African Review of Economics and Finance, 13(1), 113–165.
- Udeagha, M. C., & Muchapondwa, E. (2023). Green finance, fintech, and environmental sustainability: Fresh policy insights from the brics nations. International Journal of Sustainable Development & World Ecology, 30(6), 633–649. https://doi.org/10.1080/13504509.2023.2183526
- Udeagha, M. C., & Ngepah, N. (2021). The asymmetric effect of trade openness on economic growth in South Africa: A nonlinear ardl approach. Economic Change and Restructuring, 54(2), 491–540. https://doi.org/10.1007/s10644-020-09285-6
- Watrobski, J., Baczkiewicz, A., Ziemba, E., & Salabun, W. (2022). Sustainable cities and communities assessment using the daria-topsis method. Sustainable Cities and Society, 83, 103926. https://doi.org/10.1016/j.scs.2022.103926
- Watrobski, J., Jankowski, J., Ziemba, P., Karczmarczyk, A., & Ziolo, M. (2019). Generalised framework for multi-criteria method selection. Omega, 86, 107–124. https://doi.org/10.1016/j.omega.2018.07.004
- White, H. (1980). A heteroskedasticity-consistent covariance matrix estimator and a direct test for heteroskedasticity. Econometrica: Journal of the Econometric Society, 48(4), 817–838. https://doi.org/10.2307/1912934
- World Bank. (2014). World integrated trade solution. https://wits.worldbank.org
- Yalcin, A. S., Kilic, H. S., & Delen, D. (2022). The use of multi-criteria decision-making methods in business analytics: A comprehensive literature review. Technological Forecasting and Social Change, 174, 121193. https://doi.org/10.1016/j.techfore.2021.121193
- Yamarik, S., & Ghosh, S. (2015). Broad versus regional integration: What matters more for economic development? The Journal of International Trade & Economic Development, 24(1), 43–75. https://doi.org/10.1080/09638199.2013.868024
- Yanık, L., & Eren, T. (2017). Borsa istanbul’da işlem gören otomotiv imalat sektörü fir- malarının finansal performanslarının ahp, topsis, electre ve vikor yöntemleri ile analizi. Yalova Sosyal Bilimler Dergisi, 7(13), 165–188. https://doi.org/10.17828/yalovasosbil.333899
- Zare, M., Pahl, C., Rahnama, H., Nilashi, M., Mardani, A., Ibrahim, O., & Ahmadi, H. (2016). Multi-criteria decision making approach in e-learning: A systematic review and classification. Applied Soft Computing, 45, 108–128. https://doi.org/10.1016/j.asoc.2016.04.020
- Zopounidis, C., & Doumpos, M. (2002). Multi-criteria decision aid in financial decision making: Methodologies and literature review. Journal of Multi-Criteria Decision Analysis, 11(4–5), 167–186. https://doi.org/10.1002/mcda.333