
 ?Mathematical formulae have been encoded as MathML and are displayed in this HTML version using MathJax in order to improve their display. Uncheck the box to turn MathJax off. This feature requires Javascript. Click on a formula to zoom.
Abstract
Linking farmers to high-value markets continue to be a viable option for breaking the food insecurity. Many studies have emphasized on factors determining smallholders’ participation in high-value markets. Previous studies have methodological limitations since they neglected the associated effects on food security. Therefore, the purpose this study was to fill a knowledge gap by investigating the factors influencing smallholder avocado farmers’ participation in high-value markets and how it impacts households’ food security in the Aleta chuko district, Ethiopia. The primary data was collected from randomly selected 389 avocado producers using a semi-structured questionnaire. Descriptive statistics, inferential statistics, and propensity score matching model were used to analyze the data. The result of the binary logit model revealed that the participation of avocado producers in a high-value market was influenced by age, educational status, the quantity of avocados sold, and price of avocado and market information. The ATT estimation of PSM model indicated that Avocado producers who participated in high-value market channels have higher food security status (by 4.3–4.8%) compared to those who were not. Thus, this study suggested that concerned bodies in Ethiopia should encourage more households to participate in the high-value markets.
IMPACT STATEMENT
High value markets are an emerging opportunity in Ethiopia to improve households income and ‘food security. This research focuses on impact of high value markets on households’ food security and addresses some questions unanswered by most studies: what are the factors determining avocado producers’ participation in high value markets? And secondly, does the participation in high value markets ensure food security. The finding of this study showed that those who participated in high-value markets are more food secured than those who participated in traditional markets. Therefore, the results of this study give relevant information to concerned bodies to formulate policies that motivate more households to engage in high-value markets.
1. Introduction
Food security is an important matter of concern for countries across the globe. According to the level of focus (i.e. global, regional, national, community, house-hold and individual), the term food security has different aspects. The importance of assuring food security at household-level received more attention of national governments as well as international communities in the last few decades (Zoungrana, Citation2022). In 1996, the World Food Summit stated that ‘when household food security exists, all people in a household have access to sufficient, safe, nutritious food at all times to maintain their active and healthy life’ (FAO, Citation2020). This definition integrate our dimensions of food security include: access to food, availability of food, the biological utilization of food, and stability in all times (Zoungrana Citation2022).
The situation of food security in developing countries has become terrible. An analysis by FAO et al. (Citation2019) indicated that, in 2018, about 272 million undernourished people lived across countries in sub-Saharan Africa, accounts more than 35% of world undernourished people in 2018. From 272 million undernourished people, about 65% lived in East, followed by southern Africa (54%), West Africa (48%), and North Africa (30%) (FAO et al., Citation2019). This implies that most of the East African population does not have regular access to nutritious and sufficient food for a healthy and productive life (Gebre & Rahut, Citation2021; Gebre et al., Citation2023a, Citation2023b). The problem of access to adequate and sufficient food for the population is a major concern in Ethiopia. Among the African countries, Ethiopia has the highest prevalence of undernourishment (32.1 million people) from Sub-Saharan Africa followed by Tanzania (15.7 million), Nigeria (12.1 million), Kenya (11 million) and Uganda (10.7 million) (Africa Food Security & Hunger, Citation2014; Africa Development Bank, Citation2014). The main cause of food shortage in Ethiopia is natural disaster, severe drought, flooding, insecurity, and conflict.
In the sub-Saharan Africa, smallholder agriculture has long dominated the economy and will continue to play a crucial role for the foreseeable future (Gollin, Citation2014). Despite agriculture being the main source of income in Africa, it is inadequate to feed the continent’s expanding population (African Union, Citation2013). The sector’s limited market integration and subsistence status, however, continue to be significant obstacles.
The agricultural sector also dominates the Ethiopian economy, contributing 34.1% of GDP, 79% of export revenues, 79% of the labor force, and 70% of the raw materials used in industries (Asrat et al., Citation2022; Endalew et al., Citation2022; Gebremariam & Ying, Citation2022; Wordofa et al., Citation2021; Zegeye et al., Citation2022). Agriculture in the country is mostly dependent on rainfall, carried out on a small scale, and has limited access to technology, extension assistance, market information, and financial access, all of which have lowered agricultural productivity (Kifle et al., Citation2022; Nakawuka et al., Citation2018). Indeed, the country’s agricultural production growth has lagged behind the pace of population expansion (Regasa et al., Citation2021).
Horticulture farming has been identified as one of the agricultural sub-sectors that is expanding quickly and a potential driver of poverty reduction for low-income smallholder households (Barrett et al., Citation2012; Mkindi, Citation2011). Horticultural crops refer to fruits, vegetables, ornamental and medicinal plants (Amao, Citation2019). Avocado is one of the horticultural crops with high economic value.
Avocado (Persea Americana Mill.) is originated in Mexico (Muhammad, 2015). After pineapple, avocado is the fruit that is traded the most, it makes up around 25% of all tropical fruits. Avocado has nutritional benefits such as potassium, unsaturated fatty acids, proteins, and fat-soluble vitamins that are uncommon in other fruits (Cervantes-Paz & Yahia, Citation2021). The fruit is also utilized as a raw ingredient in the pharmaceutical and cosmetic industries. Africa has a strong interest in avocado cultivation and marketing. South Africa, Ethiopia, Cameroon, Rwanda, and Kenya continue to be the continent’s top producers of avocados (FAO, 2019).
In Ethiopia, avocado is grown on a total of 20,908.00 hectares, with a production of 104,492 tonnes. The output of avocados in Ethiopia has historically ranged from 13,888 tonnes in 2001 to 104,492 tonnes in 2019 (FAOSTAT, Citation2020). Approximately 36% of the nation’s annual avocado production comes from the Sidama region (Central Statistical Agency, Citation2021).
Market participation is the ability of an individual to participate in a market efficiently and effectively. In the context of this study, it is the transition of farmers from traditional to high-value market participation mode where inputs are increasingly purchased, and outputs are sold to supermarkets and integrated agroprocesing industry. The transition from traditional market to high-value market participation is determined by the ability of farmers to produce products that meet market expectations in terms of quality standards, supply consistency, and ability to deliver products on time for sale at a sustainable price (Belay, Citation2018; De Janvry et al., Citation2010; Hussein & Suttie, Citation2016; Kilelu et al., Citation2017; Poole, Citation2017).
Linking Smallholder farmers to high-value markets may offer the opportunity to produce and sell high-value products, translating their vertically-coordinated relationships into premium prices and letting them capture a bigger share of the price paid by final consumers (De Janvry et al., Citation2010; Hussein & Suttie, Citation2016; Kilelu et al., Citation2017). Indeed, there is evidence in that participation of small-scale farmers in high-value markets presents opportunities to improve their productivity, income, food security, and reduce poverty (Barrett et al., Citation2012; Belay, Citation2018; Mmbando et al., Citation2015; Sharp et al., Citation2008).
In current days, Small holder farmers have more options to participate in high-value markets due to the booming supermarkets and agro-processing industries, which may help them earn more money and have more reliable access to food (Hernández et al., Citation2007). However, for the majority of smallholders in developing regions, sustained participation in high-value markets remains difficult. Recent empirical evidences shows that smallholders frequently quit high-value markets upon entry due to substantial post-entry transaction risks (Andersson et al., Citation2015; Michelson, Citation2017; Lambrecht & Ragasa, Citation2018; Romero Granja & Wollni, Citation2018). According to Mossie et al. (Citation2020) some issues such as poor infrastructure, grading systems, insufficient market information and communication between farmers, traders and consumers pose a significant hindrance to high-value markets accessibility.
Ethiopia has been implementing agricultural development lead industrialization (ADLI) policy since the early 1990s. In order to attain such a development goal, there should be a market oriented production, which ensures marketable surplus as well as efficient and effective marketing system that will enable farmers to gain the actual profit from what they produce. Given reliable market, an increase in market participation in turn makes it easy for farmers to shift into commercial farming, increasing economic growth (Jari & Fraser, Citation2009).
The marketing channels used by farmers to sell their avocados in the study area can be split into two groups: high-value markets and traditional market. Traditional market represented by Village markets, whilst, the high-value markets represented by processor (agro-processing industry, Juice houses and supermarkets).
There are few research on the impact of smallholder farmers’ participation in high-value markets on food security in Ethiopia. Many studies have emphasized on factors determining smallholders participation in high-value markets (Abate et al., Citation2019; Biggeri et al., Citation2018; Gebremedhn et al., Citation2019; Getahun et al., Citation2018; Girmalem et al., Citation2019; Habtewold et al., Citation2017; Kassa et al., Citation2017; Kyaw et al., Citation2018; Mengesha et al., Citation2019; Tamirat & Muluken, Citation2018; Tarekegn et al., Citation2020; Warsanga & Evans, Citation2018). Despite their undeniable importance, these studies have methodological limitations since they only look at the factors that influence smallholders’ participation in the high-value market, neglecting the importance of this for food security. Thus, this study aimed to fill a knowledge gap in the area by investigating the factors influencing smallholder avocado farmers’ participation in a high-value markets and how it impacts households’ food security in Aleta Chuko district, Sidama Region of Ethiopia.
2. Material and methods
2.1. Description of the study area
This study was conducted in Aleta Chuko district, Sidama Region, Ethiopia. It is situated in the Sidama region, 62 kilometers south of Hawassa, the Sidama region’s capital, and 330 kilometers south of Addis Ababa. Its precise location ranges from 38004’E to 38024’E and 6046’N to 7001’N. The district is divided administratively into 26 rural and 5 urban Kebeles. The Aleta Chuko district has a total population of 209,886, of which 102,215 (48.7%) are men and 107,671 (51.3%) (CSA, Citation2021). A rough estimate of the district’s land area is 32.2 square kilometers. The area has lowland agro ecological zones and varies in altitude from 1,400 to 2,000 meters above sea level (CSA, Citation2021).
2.2. Data source and methods of collection
Primary data was collected from avocado producers who are participated in traditional and high-value markets. Primary data was collected through checklists, semi-structured questionnaires, and field observations. Prior to the survey, the questionnaire was pre-tested on 14 farmers (7 traditional and 7 high-value markets participants) to evaluate the appropriateness of the design and clarity of the questions, relevance of the questions and to estimate the time required for an interview. Three enumerators who completed a first degree and have knowledge of the local culture, and language of the community were recruited to conduct the interview. They were given appropriate training including field practices, in order to make them understand the objectives of the study, the contents of the interview schedule, how to approach the respondents and conduct interview.
2.3. Sampling techniques
The purpose of this study was to analyze factors affecting smallholder farmers’ participation in high-value markets and its impact on food security. So, smallholder avocado producer farmers in Aleta chuko were the target population of this study. Multi-stage sampling techniques were used to draw representative sample. In the first stage, Aleta chuko district was purposefully chosen from 36 districts in the Sidama region for its significant potential for avocado production and its proximity to Yirgalem agro processing industry. In the second stage, four Kebeles from 12 avocado producing Kebeles were chosen randomly with the help of district’s agriculture and natural resource office experts. In the third stage, 389 sample avocado producers were drawn from the 14,748 total avocado producers of the chosen Kebeles using Yemane’s (1967) formula at 5%level of error. We applied this formula to determine sample size because it is the most appropriate formula when the study population size is known (Seng, Citation2016). Consequently, it has been widely used by many recent studies (Ngema et al., Citation2018; Smale et al., Citation2012; Wooldridge, Citation2010) in determining the sample size for their studies. Finally, the sample size was distributed using the probability proportional to the sample size.
(1)
(1)
Where n = sample size, N = total avocado producer households, and e = is level of precision (0.05).
(2)
(2)
2.4. Method of data analysis
The food security measure/cut-off point was calculated using the Household Food Insecurity Access Prevalence indicators (Coates et al., Citation2007; Headey & Ecker, Citation2012). For each farm household, the Household Food Insecurity Access category variable was calculated using the assigned codes of the degree of food security into which it fell (see Appendix A). Accordingly, based on their severe responses, four sequential categories of food security states were created: food-secure, mildly food-insecure, moderately food-insecure, and severely food-insecure. Each category was calculated by dividing the number of farm households in one category by the total number of farm households in the four categories. Due to the small sample size, all three food-insecure statuses (mildly, moderately, and severely) were merged into ‘food-insecure’ and the rest into ‘food-secure’ categories. Thus, the dependent variable (outcome variable) was binary, with ‘one’ assigned to a food-secure household and ‘zero’ to a food-insecure household.
Second, a propensity score matching (PSM) method was employed to estimate the effect of high-value markets participation on farm households’ food security status in the study area.
The logit model was employed in this study to ascertain the households’ propensity scores. Participation in avocado high-value market is the dependent variable for estimating the logit model; it takes a value of 1 if the household participated in avocado high-value markets and 0 otherwise (Gujarati & Porter, Citation2009). Hence, the logit model is defined mathematically as follows:
(3)
(3)
Where is the probability of participation in Avocado high-value markets,
(4)
(4)
Where = 1, 2, 3, … , n,
= intercept,
= regression coefficients to be estimated,
= a disturbance term, and
= variables
The probability that a household belongs to the non-participant group of avocado high-value markets is:
(5)
(5)
Then the odds ratio can be written as
(6)
(6)
The left-hand side of EquationEquation (6) (9)
(9)
is simply the odds ratio in favor of participation in Avocado high-value markets. It is the ratio of the probability that the household would participate in the Avocado high-value markets to the probability that it would not participate in the Avocado high-value markets. Lastly, by taking the natural log of EquationEquation (8)
(8)
(8) the log of odds ratio can be written as:
(7)
(7)
(8)
(8)
Where is the log of the odds ratio in favor of participation in the Avocado high-value markets, which is not only linear in
, but also linear in the parameters. Matching theory in the propensity score generated through the logit model should include predictor variables that influence the selection procedure or participation in Avocado high-value markets and the outcome of interest (Bryson et al., Citation2002; Jalan & Ravallion, Citation2003). Based on this suggestion, eleven independent variables were hypothesized and used for the model. These variables were identified these are assumed to determine households’ participation in high-value markets
The expected treatment effect for the treated population is of primary significance, and it is given as:
(9)
(9)
Where ATT represents the average treatment effect for the treated, Y1 represents the value of the outcome for high-value markets participants, and Y0 denotes the value of the same explanatory variable x for non-participant of high-value markets. As noted above, the major problem with this procedure is that the counterfactual E (Y0|x, D = 1) is not based on empirical observation. Although the value of ATT (the difference between E (Y1|x, D = 1) − E (Y0|x, D = 0)) can be estimated, it is potentially a biased estimator (coefficient). In the absence of experimental data, the PSM can be applied to account for this sample selection bias due to counterfactual effects (Dehejia & Wahba, Citation2002). To create the condition of a randomized experiment, the PSM applies the conditional independence assumption, which implies that once Z is controlled for, high-value markets participation is random and uncorrelated with the outcome variables (food security in the case of this study). That is, in short, the outcomes are independent of treatment. The PSM can be expressed as:
(10)
(10)
Where D is the indicator for participation in high-value markets and Z is the vector of pre-participation characteristics (Abara & Singh, Citation1993). The conditional distribution of Z given P (Z) is similar between the participant and non-participant groups. After estimating the propensity scores, the average treatment effect for the treated (ATT) can be estimated as:
(11)
(11)
Several techniques have been developed to match non-participants with participants of similar propensity scores. The PSM depends on the conditional independence (see, Caliendo & Kopeinig, Citation2008) and the common support condition (see, Bryson et al., Citation2002) assumptions. The most important variable of interest for the PSM is ATT. In our study’s context, ATT is the difference in the outcome of farm households having participated in high-value markets and similar farm households not participated in traditional markets. In PSM estimation, it is important to determine the region of common support to check the overlap in the propensity score distribution between the participant and non-participant groups. Applying matching algorithms helps us to choose and determine the region of common support in a PSM analysis. Therefore, we employed two types of PSM algorithms commonly used in PSM analysis to check the level of diversity in the obtained results. The nearest neighbor matching (NNM) and kernel based matching (KBM) algorithms were used. After matching for NNM and KBM, several balancing tests were employed to assess the matching quality, such as checking a reduction in the median absolute bias, the value of R2, and the p-value of joint significance of covariates before and after matchings (Ali & Erenstein, Citation2017; Becker & Ichino, Citation2002; Caliendo & Kopeinig, Citation2008; Gebre et al., Citation2023a; Rahut & Ali, Citation2018).
2.5. Hypothesis, variable description and expected sign
Finding the factors that influence avocado producers to participate in high-value markets and how this affects their food security is important. It is also necessary to investigate the relationships between these factors and the dependent variables to determine which factors have a significant impact. In light of this, the following dependent, independent, and outcome variables were identified and hypothesized for this investigation ().
Table 1. Variable description and their expected signs.
2.5.1. Dependent variable
Participation in the high-value markets, which has a value of 1 for high-value markets participants and 0 for the traditional markets participants, is the study’s dependent variable.
2.5.2. Outcome variable
Food security, as evaluated by household food intake in calories, is the study’s outcome variable.
2.5.3. Independent variables
The independent variables which are expected to influence avocado households’ participation in high-value markets are presented below.
2.5.3.1. Sex of the household head
This is a dummy variable which takes a value 1 if the household head is male and 0 otherwise). Male household heads have been reported to have a better tendency in searching market alternative for the sale of avocado than female household heads. Male households are participated in the vegetable market more than females and females are disadvantaged in marketing because of unequal distribution of resources as well as cultural barriers (Banchamlak & Akalu, Citation2022). Thus, sex of household head was hypothesized to influence farmers’ participation in high-value markets positively.
2.5.3.2. Age of the household head
This is a continuous variable and defined as the number of year of household head age. In this study, age of household’s head is expected to be negatively affect high-value markets participation since the older farmers are more likely to participate in village market. Previous study by Edosa (Citation2018) found that age has negative effect in market participation decision. Thus it was expected to be negatively correlated with high markets participation.
2.5.3.3. Education level of household head
Educational level of the household head is continuous variable measured in a number of years spent in formal school. Household heads with more years of formal education expected to have a higher ability to accept new ideas and innovations, and therefore would be more willing to sale avocado to high-value markets. Better educated farmers tend to be more innovative and are therefore more likely to participate in modern market channels (Banchamlak & Akalu, Citation2022; Habtamu, Citation2014) Thus, education level of household head was hypothesized to influence farmers’ participation in high-value markets positively.
2.5.3.4. Family size
This variable is a continuous explanatory variable and measured in adult equivalent ratio of the household members. It is assumed that household with more adult household members produce large amount of avocado with expected quality and supply to the high-value markets. The involvement of smallholders in in the value chain markets influenced by family size of the household (Kassa et al., Citation2017). Therefore, this variable was hypothesized to have positive influence on high-value markets participation.
2.5.3.5. Quantity of avocado produced
It is a continuous variable measured in quintals. High avocado production was hypothesized to have a positive effect on high-value markets participation. Farmers producing small quantities are likely to sell their products to traditional market within a village rather than selling to modern market. According to Chalwe (Citation2011) an increase in output is a motivation to produce and sell more and produce more that ultimately increases income Therefore, it was hypothesized that quantity of avocado produced would have positively relationship with high-value markets participation.
2.5.3.6. Price of avocado
This is a continuous variable measured in price of avocado in the current price in birr per quintal. When the price of the product is promising, farmers are motivated to sell their product to a particular market chains. This makes the supply to be directly related with a price offer. For example, Warsanga and Evans (Citation2018) found that supermarkets paid horticultural suppliers higher than what they got in traditional market. Therefore, this variable was hypothesized to have positive relationships with high-value markets participation.
2.5.3.7. Market information
It is dummy variable that takes a value of 1 if the farmer’s obtained market information and zero otherwise. According to Jari and Fraser (Citation2009) as a result access to market information is a positively correlate with the market participation of farmer. A more access to market information could contribute to an increase in smallholder farmers’ participation in modern high-value markets. Therefore, access to market information was hypothesized to influence the high-value markets participation positively.
2.5.3.8. Avocado marketing experience
This is a continuous variable measured in number of years. A household with better experience in avocado marketing is expected to participate more in high-value markets than the one with the less experienced. Oduniyi et al. (Citation2022) found beef farmers market experience positively determined farmers participation in high-value markets. Therefore, higher avocado marketing experience was anticipated to have a positive relationship with high-value markets participation.
2.5.3.9. Frequency of extension contact
This refers to the number of contacts that the respondent made with extension agents. Here, the frequency of contact between the extension agent and the farmers is hypothesized to be the potential force, which accelerates the effective dissemination of adequate agricultural and market information to the farmers. Previous study by Tarekegn et al. (Citation2020) found that access to extension service has positive and significant role on the farmers’ participation in high value chain markets. As per this study, it was hypothesized that frequency of extension contact influence farmers participation in high-value markets positively.
2.5.3.10. Access to credit service
It is measured in terms of whether respondent farmers accessed or not credit service. It is Dummy variable which takes value of 1 if the farmer had access to credit in terms of availability of credit sources and possibility of getting credit and 0 otherwise. Farmers who had access to credit may overcome their financial constraints and therefore buy inputs (Hagos et al., Citation2020). Farmers without cash and no access to credit will find it very difficult to attain and adopt new technologies. Thus, in this study, it was expected that access to credit increase the probability of participation in high-value markets positively.
2.5.3.11. Distance to the high-value market
This variable was measured by kilometers from the production area to the high-value market. The closer they are to the high-value markets; the more likely it is that, the farmer will receive valuable information and choose the channel to supply avocado. On the other hand, if the distance to the high-value markets increases, the transportation cost will also increase and the farmers obligated to sell their avocado to traditional village markets. The studies by Girmalem et al. (Citation2019); Mengesha et al. (Citation2019) found that the distance to the market has the negative influence on the farmer’s participation in market. Therefore, it was hypothesized that the modern market is far from the farm the farmer more selling to traditional market chain and then the income of farmer become low. Thus, distance to the high-value markets was expected to have negative relationships with high-value markets participation.
3. Results and discussion
3.1. Characteristics of sample households
presents a summary of descriptive statistics by high-value markets and traditional markets participants. Regarding the food security status of the surveyed households, it is noticed that high-value markets participants were more food-secure (69.6%) compared to traditional market participants (12.7%), with a significant difference at 1% level. Traditional market participants were more food-insecure (87.3%) i.e. sum of mildly (26.2%), moderately (29.0%), and severely (32.1%)) compared to the high-value markets participants (30.8% i.e. sum of mildly (16.1%), moderately (9.5%), and severely (4.8%)). The differences in all food-insecure categories were statistically significant.
Table 2. Characteristics of sample respondents.
The mean ages of the sampled respondents who participated in the high-value markets and the traditional markets were 35.53 and 42.23 years, respectively (). The t-test (4.393) result shows that there was a statistically significant mean age difference between farmers participating in the high-value markets and those in the traditional markets at a 1% level of significance. Study’s finding revealed that the typical family sizes of high-value markets and traditional markets participants were 5.0 and 6.42, respectively. The t-test (3.605) demonstrates that, at the 1% level of significance, there was a statistically significant difference in the mean family size between high-value markets participants and traditional markets participants.
Regarding the level of education in the households, farmers who participated in the high-value markets had a greater mean number of school years (7.95) than farmers who participated in the traditional markets, who had a mean of 2.55 school years. The t-test score (23.283) demonstrate that there was statistically significant mean year schooling difference between high value and traditional markets participants. High-value markets participants paid 685ETB for each quintal of avocado, while traditional markets participants paid 380.96ETB. T-test result (14.68) confirms that there was a statistically significant mean price difference between high-value markets and traditional markets.
Furthermore, the average market supply of avocados by the high-value markets and traditional markets participants were 9 and 2.6 quintals, respectively. The t-test value (19.57) reveals that at the 1% level of significance, there was a statistically significant mean quantity of avocado supply difference between high-value markets participants and those in the traditional markets participants. high-value markets participants and traditional markets participants had mean marketing experience of 7.28 and 7.77 years, respectively (). The t-test result shows that the market experience of the household head was statistically insignificant, indicating that the participants in the traditional and high-value markets had comparable distributions of market experience.
The average distance from the homes of traditional markets participants to the high-value markets was 27.57 kilometers, compared to 17.6 kilometers for high-value markets participants. The t-test result (6.89) reveals that There was statistically significant difference in distance between traditional markets participants and high-value market participants home to the high-value markets at 1% significance level. The t-test result revealed that there was no statistically significant difference between traditional and high-value markets participants in terms of mean extension contact.
The result of the survey showed that out of the high-value markets participants 157 (93.4%) were male while only 11(6.6%) of them were female. Out of the traditional markets participants 183 (82.8%) were male while 38 (17.1%) were female. Chi-square test (χ2 = 4.783) indicates that, sex was statistically significant at 1% shows that male headed households were more participating in high-value markets (). Regarding to the market information, 54.1% of the traditional markets participants did not access any market information while 45.9% of the respondents accessed market information.
The result of the survey revealed that about 98.2% of sampled high-value markets participant farmers accessed market related information. The chi-square test (χ2 = 13.902) showed that, there was significant market information difference between the high-value and traditional markets participants. According to the survey results, only 7.2% of participants in the traditional markets used credit access, whereas 92.8% of them unutilized. Furthermore, the survey’s result shows that among respondents from the high-value markets, 80.4% did not use credit while 19.6% did (). The chi-square test (10.145) reveals a statistically significant difference between high-value market and traditional markets participant farmers in terms of access to credit.
3.2. Econometric results
3.2.1. Factors determining participation in high-value markets
The logistic regression model was used to determine the factors determining Avocado households’ participation in high-value markets (). The logistic regression model is applied when the choice variable is dichotomous. For this study, the dependent variable was the participation of the household in high-value markets which takes a value of 1 if the household participated in high-value markets and 0 otherwise.
Table 3. Determinants of avocado farmers’ participation in high-value markets.
After matching, the distribution of covariates across the two groups should not differ in a systematic way, therefore the pseudo R2 should be quite low (Aku et al., Citation2018). In this study, the pseudo-R2 value is 0.2354 which is fairly low and it indicates high-value markets participants and traditional markets participants do not have much distinct in overall characteristics and hence the matching between them becomes easier. Eleven explanatory variables were used to estimate the determinants of household participation in high-value markets. Of these variables age of household head, education level of the household head, quantity of avocado sold, price of avocado, market information and distance to the high-value markets were the factors that influence household’s participation in high markets.
3.2.1.1. Age of household head
The age of the household has a considerable impact on households’ participation in high-value market channels at a 1% probability level, as expected (). As farmers get one year older, the likelihood that they will participate in a high-value markets falls by a factor of 0.263, holding all other factors equal. This finding supported by Hernández et al. (Citation2007) that demonstrated a negative link between farmer age and the decision to participate in high-value markets.
3.2.1.2. Education level of household head
The result in shows that at a 5% level of significance, the educational level of the household head positively and significantly influenced the households’ participation in high-value market channels. Keeping all other factors equal, the likelihood that farmers will participate in the high-value markets increases by a factor of 1.473 as their educational level rises by one school year. From the study’s finding, it may be inferred that farmers with greater education are more likely to sell through high-value markets. In other words, if the farmers are less educated, the likelihood of selling via traditional markets increases. This finding is consistent with a prior study by Ismail et al. (Citation2013) who found that farmers who sell through high-value market channels have greater educational levels than farmers who sell through traditional markets.
3.2.1.3. Quantity of avocado supplied to the market
The volume of avocados supplied to the market has a favorable and significant impact on the chance of participating in the high-value markets with a 5% level of relevance (). When producers supply one quintal more of avocados to the market while holding all other factors equal, the probability of participating in the high-value markets rises by a factor of 3.888. Based on this finding, households that supplied a considerable amount of avocados accessed high-value markets more frequently than those that supplied less of fruit. This result is consistent with that of Muthini (2015) who discovered that farmers with more mango trees than those with fewer mango trees were more likely to sell to the export market.
3.2.1.4. Distance to the high-value market
At a 5% significance level, distance to the high-value market had a negative and substantial impact on participation in the high-value avocado markets. As farmers’ distance from residences home to the high-value market increases by one kilometer while holding all other variables constant, the odds in favor of participating in the high-value markets decrease by a factor of 14.808. Farmers who are located far from the high-value markets may decide to sell to the traditional markets, in their villages, rather than selling to high-value markets in far-off markets that increase transaction costs. This finding is in line with Shiimi et al. (Citation2012) who found that participation in high-value markets was negatively impacted by distance to the nearest markets.
3.2.1.5. Price of avocado
The study’s findings demonstrate that at a 5% level of significance, the farmers’ high-value markets participation is significantly and favorably correlated with avocado price. When the price of avocado rises by one birr, the likelihood of participating in the high-value avocado market channel rises by 0.989 factor, keeping other independent variables at their mean levels. The variables’ positive and significant correlation suggests that producers are increasingly choosing high-value markets as the price of avocados grows there. The result is in line with those of Alene et al. (Citation2008), who discovered a beneficial link between price and market activity.
3.2.1.6. Access to market information
At a 5% level of significance, access to market information had a favorable and significant impact on participating high-value markets. When the farmer gained access to market information, the likelihood of participating in the high-value avocado market channels increased by factors of 9.875, keeping other independent variables at their mean levels. This result concurs with studies by Megersa et al. (2020), who discovered that people with access to market information are more likely to shop in the agri-food sector.
3.2.2. Impacts of the high-value markets participation on household food security
presents the impact of high-value markets participation on farm households’ food security based on the PSM analysis. Both nearest neighbor matching and kernel-based matching reveals that farm households that participated in high-value markets have a higher food security status (4.3–4.8%) compared to those who have not participated. The finding of this study is consistent with earlier studies that discovered participation in high-value markets has potential for raising food security (Mmbando et al., Citation2015; Reardon, Citation2015; Wiggins, Citation2014).
Table 4. Impacts of the high-value market participation on household food security.
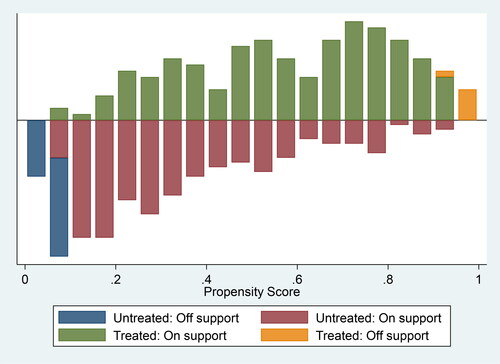
shows the distribution of propensity score for all households. As shown in the table, the propensity scores vary between 0.0104 - 0.9985 for all households with mean score of 0.4318. Whereas the score vary between 0.0826 and 0.9985 for high-value markets participants with mean score of 0.5946. The common support then lies between 0.0826 and 0.9364. This means that household whose propensity score less than minimum (0.0826) and larger than maximum (0.9364) are not considered for matching purpose. Based on this procedure, 39 households (6 household from high-value markets participant group and 33 households from traditional markets participant group were discarded from the study in impact assessment.
Table 5. Distribution of estimated propensity scores.
below shows the calculated propensity scores for both traditional and high-value markets participants. The bottom half of the graph pertains to participants in the traditional markets, while the top half of the graph shows the distribution of propensity scores for high-value markets participants. On the y-axis are the score densities. The expected output, a trustworthy indicator of this, falls solely between the range of 0 and 1. It demonstrates that the distribution of the anticipated likelihood of participation has an acceptable amount of overlap.
Figure 1. Common support region for propensity score estimation and propensity score distribution.
presents the balancing tests for the PSM. Before matching, the bias was very high (25.23%–26.03%), but it was reduced to 7.13%–8.28% after matching. The percentage bias reduction is 65.63–74.96%. The value of R2 was high before matching (0.2354), but it became very low after matching (0.016for NNM and 0.015for KBM), signifying that, after matching, both groups are very similar to each other. The p value of joint significance of covariates indicates that before matching, there were systematic differences between the high-value market participants and non-participants, but after the high-value market participants and non-participants became very similar to each other after matching.
Table 6. Indicators of covariate balancing (before and after matching).
4. Limitation of the study
Geographically this study was limited to Aleta chuko District, Sidama regional state of Ethiopia. The study was covered only four avocado producing kebeles in the study area. More generally, its depth and coverage was limited to participation in high-value markets. The researchers didn’t covered the high-value markets outside of the region. Finally, the researchers suggests that the further study on Avocado value chain analysis would be undertaken in the sidama region by considering other Avocado producing districts in the region in addition to Aleta chuko district.
5. Conclusion and policy implications
This study examined avocado producers’ participation in high-value markets and its impact on food security in the Sidama region of Ethiopia. This study employed a cross-sectional research design. The primary and secondary data were used to gather the necessary data for the study. The primary data was collected from 389 avocado producing households using a semi structured questionnaire. Secondary data were collected from journals, annual reports, websites and different published and unpublished materials. Descriptive statistics, inferential statistics, and propensity score matching model were used to analyze the data. Our survey with 389 farm households in Aleta chuko district in 2023 found that only 43.2% farm households participated in high-value markets. Regarding the food security status of the surveyed households, it is noticed that high-value markets participants were more food-secure (69.6%) compared to traditional markets participants (12.7%), with a significant difference at 1% level. The results of the PSM analysis showed that an increasingly positive relationship between high-value markets participation by the surveyed farm households and their food security status. It was concluded that high-value markets participation has a favorable and considerable impact on the food security of the households. However, the logit result showed that factors such as the household head’s age, level of education, the quantity and price of avocados sold, market information, and distance from the high-value markets all had an impact on rural households’ participation in high-value markets.
Given the substantial contributions farmers’ participation in the high-value avocado markets makes to household food security, concerned bodies in Ethiopia should encourage more households to participate in the high-value markets by raising awareness among other traditional market participant farmers.
Authors contributions
The first author contributed to research proposal writing. The second author contributed to data collection, and supervision. The third author assisted data cleaning and feeding. The fourth author contributed to data analysis. The First, third, fourth and fifth authors contributed to article writing. All authors read and approved final manuscript.
Acknowledgments
The authors would like to thank the experts’ agriculture office of the district for their patience and support to get the required supplementary data. The authors also want to express their gratitude to the participants for their enthusiastic readiness to take part in this study.
Disclosure statement
No potential conflict of interest was reported by the author(s).
Data availability statement
The datasets used and analyzed during this investigation are accessible upon request from the corresponding author.
Additional information
Notes on contributors

Tibebu Legesse
Tibebu Legesse is a lecturer at Hawassa University, Department of Agribusiness and Value Chain Management. He has been working as an lecturer and researcher at Hawassa University. He has published research articles in different international peer-reviewed journals. His research interest areas are value chain analysis, technical efficiency, value chain and economic development, smallholder participation in value chain market, adoption, climate change and food security and gender in agricultural value chain.
Kehabtimer Kebede
Kehabtimer Kebede has BSc Degree in Rural Development and Agricultural Extension from Arbaminch University and MSc. Degree in Agribusiness and Value Chain Management from Hawassa University.
Aneteneh Ashebir
Aneteneh Ashebir is a lecturer at Hawassa University, Department of Agribusiness and Value Chain Management, Hawassa, Ethiopia. He is involved in teaching, research and community service. His research interest areas are impact assessment, foodsecurity, gender, climate change and food security, livelihood and agricultural value chain analysis.
Zerhun Ganewo
Zerhun Ganewo is an assistant professor of Agribusiness and Value Chain Management at Hawassa university, Hawassa, Ethiopia. He has MSc. Degree in Agribusiness and Value Chain Management and BSc. Degree in Rural Development and Agricultural Extension from Hawassa University. His research interest areas are impact assessment, climate change, food security, value chain, development, market chain analysis and efficiency. He is currently attending PhD in Ghana University, Accra, Ghana.
Abera Alemu
Abeara Alemu is an assistant professor of Rural Development and agricultural extension. He received his MSc. Degree in Rural Development and his BSc. Degree in Rural Development and Agricultural Extension from Hawassa University. He has been serving as a lecturer and researcher at the University of Hawassa. His interest areas of research are financial sustainability, poverty reduction, microfinance, gender, agricultural extension, technology adoption and dissemination, livelihood and food security
Andachew Samuel
Andachew Samuel is a lecturer and researcher at Bensa campus, Hawassa University.
References
- Abara, I. O., &Singh, S. (1993). Ethics and biases in technology adoption: The small-firm argument. Technological Forecasting and Social Change, 43(3-4), 1–17. https://doi.org/10.1016/0040-1625(93)90057-E
- Abate, T. M., Mekie, T. M., & Dessie, A. B. (2019). Determinants of market outlet choices by smallholder teff farmers in Dera district, South Gondar Zone, Amhara National Regional State, Ethiopia: A multivariate probit approach. Journal of Economic Structures, 8(1), 39. https://doi.org/10.1186/s40008-019-0167-x
- Africa Development Bank. (2014). Africa food security brief: Special focus on climate change. Africa Food Security Statistics Department, Issue No 5.
- Africa Food Security and Hunger. (2014). Hunger/undernourishment scorecard (pp. 1–5). AFSH.
- African Union. (2013). Agriculture in Africa. Transformation and outlook. https://www.un.org/en/ africa/osaa/pdf/pubs/2013africanagricultures.pdf
- Aku, A., Mshenga, P., Afari-Sefa, V., & Ochieng, J. (2018). Effect of market access provided by farmer organizations on smallholder vegetable farmer’s income in Tanzania. Cogent Food & Agriculture, 4(1), 1560596. https://doi.org/10.1080/23311932.2018.1560596
- Alene, A. D., Manyong, V. M., Omanya, G., Mignouna, H. D., Bokanga, M., & Odhiambo, G. (2008). Smallholder market participation under transaction costs: Maize supply and fertilizer demand in Kenya. Food Policy. 33(4), 318–328. https://doi.org/10.1016/j.foodpol.2007.12.001
- Ali, A., & Erenstein, O. (2017). Assessing farmer use of climate change adaptation practices and impacts on food security and poverty in Pakistan. Climate Risk Management, 16, 183–194. https://doi.org/10.1016/j.crm.2016.12.001
- Amao, I. (2019). Urban horticulture in Sub-Saharan Africa. Intech Open Book Series. https://doi.org/10.5772/intechopen.90722
- Andersson, C. I., Chege, C. G., Rao, E. J., & Qaim, M. (2015). Following up on smallholder farmers and supermarkets in Kenya. American Journal of Agricultural Economics, 97(4), 1247–1266. https://doi.org/10.1093/ajae/aav006
- Asrat, D., Anteneh, A., Adem, M., & Berhane, Z. (2022). Impact of awash irrigation on the welfare of smallholder farmers in Eastern Ethiopia. Cogent Economics & Finance, 10, 2024722. https://doi.org/10.1080/23322039.2021.2024722
- Banchamlak, H., & Akalu, T. (2022). Vegetable market supply by small holder farmers in Ethiopia. Cogent Social Sciences, 8(1), 2057058. https://doi.org/10.1080/23311886.2022.2057058
- Barrett, C. B., Bachke, M. E., Bellemare, M. F., Michelson, H. C., Narayanan, S., & Walker, T. F. (2012). Smallholder participation in contract farming: Comparative evidence from five countries. World Development, 40(4), 715–730. https://doi.org/10.1016/j.worlddev.2011.09.006
- Becker, S. O., & Caliendo, M. (2007). Sensitivity analysis for average treatment effects. Stata Journal, 7(1), 71–83. https://doi.org/10.1177/2F1536867X0700700104.9
- Becker, S., & Ichino, A. (2002). Estimation of average treatment effects based on propensity scores. The Stata Journal: Promoting Communications on Statistics and Stata, 2(4), 358–377. https://doi.org/10.1177/1536867X0200200403
- Belay, C. S. (2018). The effects of crop market participation in improving food security among smallholder crop producer farmers: The case of Central Ethiopia. Adaa Woreda. Journal of Development and Agricultural Economics, 10(9), 298–316. https://doi.org/10.5897/JDAE2018.0953
- Biggeri, M., Burchi, F., Ciani, F., & Herrmann, R. (2018). Linking small-scale farmers to the durum wheat value chain in Ethiopia: Assessing the effects on production and wellbeing. Food Policy. 79, 77–91. https://doi.org/10.1016/j.foodpol.2018.06.001
- Bryson, A., Dorsett, R., & Purdon, S. (2002). The use of propensity score matching in the evaluation of active labour market policies. Department for Work and Pensions Working Paper 4.
- Caliendo, M., & Kopeinig, S. (2008). Some practical guidance for the implementation of propensity score matching. Journal of Economic Surveys, 22(1), 31–72. https://doi.org/10.1111/j.1487-6419.2007.00527.x
- Cervantes-Paz, B., &Yahia, E. M. (2021). Avocado oil: Production and market demand, bioactive components, implications in health, and tendencies and potential uses. Comprehensive Reviews in Food Science and Food Safety, 20(4), 4120–4158. https://doi.org/10.1111/1541-4337.1278434146454
- Central Statistical Agency. (2021). Agricultural sample survey report on area and production of crops. Statistical Bulletin, IV(446). Central Statistical Authority.
- Chalwe, S. (2011). Factors influencing bean producers choice of marketing channels in Zambia. University of Zambia, Zambia.
- Coates, J., Swindale, A., & Bilinsky, P. (2007). Household food insecurity access scale (HFIAS) for measurement of food access: Indicator guide (Vol. 3). Food and Nutrition Technical Assistance Project, Academy for Educational Development.
- De Janvry, A., Dustan, A., & Sadoulet, E. (2010). Recent advances in impact analysis methods for ex-post impact assessments of agricultural technology: Options for the CGIAR. Unpublished Working Paper, University of California-Berkeley.
- Dehejia, R. H., & Wahba, S. (2002). Propensity score-matching methods for non-experimental causal studies. Review of Economics and Statistics, 84(1), 151–161. https://doi.org/10.1162/003465302317331982
- Edosa, T. L. (2018). Determinants of commercialization of teff crop in Abay Chomen District, Horo Guduru wallaga zone, Oromia Regional State, Ethiopia. Journal of Agricultural Extension and Rural Development, 10(12), 251–259. https://doi.org/10.5897/JAERD2018.0970
- Endalew, B., Anteneh, A., & Tasie, K. (2022). Technical efficiency of teff production among smallholder farmers: Beta regression approach. The European Journal of Development Research, 34(2), 1076–1096. https://doi.org/10.1057/s41287-021-00417-w
- FAOSTAT. (2020). Food and Agriculture Organization of the United Nations. http://www.fao.org/faostat/en/#data/QC/.
- FAO, Ethiopian Ministry of Agriculture, FEWSNET & Partners. (2020). Impact of desert locust infestation on household livelihoods and food security in Ethiopia: Joint assessment findings. Knowledge for Policy, European Commission.
- FAO, Ifad, UNICEF, WFP, & WHO. (2019). The state of food security and nutrition in the world 2019: Safeguarding against. https://www.who.int/publications/m/item/state-of-food-security-andnutrition-in-the-world2019.
- Gebre, G. G., &Rahut, D. B. (2021). Prevalence of household food insecurity in East Africa: Linking food access with climate vulnerability. Climate Risk Management, 33, 100333. https://doi.org/10.1016/j.crm.2021.100333
- Gebre, G. G.,Amekawa, Y.,Fikadu, A. A., &Rahut, D. B. (2023a). Do climate change adaptation strategies improve farmers’ food security in Tanzania? Food Security, 15(3), 629–647. https://doi.org/10.1007/s12571-023-01348-6
- Gebre, G. G.,Amekawa, Y.,Fikadu, A. A., &Rahut, D. B. (2023b). Farmers’ use of climate change adaptation strategies and their impacts on food security in Kenya. Climate Risk Management, 40, 100495. https://doi.org/10.1016/j.crm.2023.100495
- Gebremariam, T. K., & Ying, S. (2022). The foreign direct investment-export performance nexus: An ARDL based empirical evidence from Ethiopia. Cogent Economics & Finance, 10(1), 2009089. https://doi.org/10.1080/23322039.2021.2009089
- Gebremedhn, M. B., Tessema, W., Gebre, G. G., Mawcha, K. T., & Assefa, M. K. (2019). Value chain analysis of sesame (Sesamum indicum L.) in Humera district, Tigray, Ethiopia. Cogent Food & Agriculture, 5(1), 1705741. https://doi.org/10.1080/23311932.2019.1705741
- Getahun, W., Agajie, T., Tadele, M., & Setotaw, F. (2018). Apple value chain analysis in the Central Highlands of Ethiopia. International Journal of Agriculture Innovations and Research, 7(1), 2319–1473.
- Girmalem, N., Negussie, S., & Degye, G. (2019). Determinants of mangoes and red peppers market supply in Ahferom and Kola-Tembien Districts of Tigray Region. SocioEconomic Challenges, 3(4), 39–51. https://doi.org/10.21272/sec.3(4).39-51.2019
- Gollin, D. (2014). Smallholder agriculture in Africa: An overview and implications for policy. IIED Working Paper.
- Gujarati, N. D., & Porter, D. C. (2009). Basic econometrics. International Edition McGraw-Hill/Irwin, a Business Unit of the McGraw-Hill Companies, Inc.
- Habtamu, G. (2014). Analysis of potato value chain in Hadiya Zone of Ethiopia (pp. 140). School of Agricultural Economics and Agribusiness, Haramaya University.
- Habtewold, A. B., Challa, T. M., & Latha, D. A. (2017). Determinants of smallholder farmers in teff market supply in Ambo district, West Shoa Zone of Oromia, Ethiopia. International Journal of Advanced Research in Management and Social Sciences, 6(2), 133–140. www.garph.co.uk.
- Hagos, A., Dibaba, R., Bekele, A., & Alemu, D. (2020). Determinants of market participation among smallholder mango producers in Assosa Zone of Benishangul Gumuz Region in Ethiopia. International Journal of Fruit Science, 20(3), 323–349. https://doi.org/10.1080/15538362.2019.1640167
- Headey, D. D., & Ecker, O. (2012). Improving the measurement of food security. IFPRI Discussion Paper No. 01225. https://doi.org/10.2139/ssrn.2185038
- Hernández, R., Reardon, T., & Berdegué, J. (2007). Supermarkets, wholesalers, and tomato growers in Guatemala. Agricultural Economics, 36(3), 281–290.
- Hussein, K., & Suttie, D. (2016). IFAD Research Series 5-Rural-urban linkages and food systems in sub-Saharan Africa: The rural dimension. IFAD Research series.
- Ismail, M., Kavoi, M., & Eric, B. (2013). Factors influencing the choice of supermarket channel by smallholder vegetable farmer suppliers in Nairobi and Kiambu Counties, Kenya. Journal of Agricultural Economics and Development, 2(9), 333–344.
- Jalan, J., & Ravallion, M. (2003). Estimating the benefit incidence of an antipoverty program by propensity-score matching. Journal of Business & Economic Statistics, 21(1), 19–30. https://doi.org/10.1198/073500102288618720
- Jari, B., & Fraser, G. C. G. (2009). Analysis of institutional and technical factors influencing agricultural marketing among smallholder farmers in Kat River Valley. Rhodes University, South Africa. African Journal of Agriculture, 4(11), 1129–1137.
- Kassa, G., Yigezu, E., & Alemayehu, D. (2017). Market chain analysis of highvalue fruits in Bench Maji Zone, Southwest Ethiopia. International Journal of Marketing Studies, 9(3), 124–135. https://doi.org/10.5539/ijms.v9n3p124
- Kifle, T., Ayal, D. Y., & Mulugeta, M. (2022). Factors influencing farmers adoption of climate smart agriculture to respond climate variability in Siyadebrina Wayu District, Central Highland of Ethiopia. Climate Services. 26, 100290. https://doi.org/10.1016/j.cliser.2022.100290
- Kilelu, C., Klerkx, L., Omore, A., Baltenweck, I., Leeuwis, C., & Githinji, J. (2017). Value chain upgrading and the inclusion of smallholders in markets: Reflections on contributions of multi-stakeholder processes in dairy development in Tanzania. The European Journal of Development Research, 29(5), 1102–1121. https://doi.org/10.1057/s41287-016-0074-z
- Kyaw, N. N., Ahn, S., & Lee, S. H. (2018). Analysis of the factors influencing market participation among smallholder rice farmers in Magway Region, Central Dry Zone of Myanmar. Sustainability, 10(12), 4441. https://doi.org/10.3390/su10124441
- Lambrecht, I. B., & Ragasa, C. (2018). Do development projects crowd-out private sector activities? Evidence from contract farming participation in Northern Ghana. Food Policy, 74, 9–22. https://doi.org/10.1016/j.foodpol.2017.11.001
- Mengesha, S., Abate, D., Adamu, C., Zewde, A., & Addis, Y. (2019). Value chain analysis of fruits: The case of mango and avocado producing smallholder farmers in Gurage Zone, Ethiopia. Journal of Development and Agricultural Economics, 11(5), 102–109. https://doi.org/10.5897/JDAE2018.1038
- Michelson, H. C. (2017). Influence of neighbor experience and exit on small farmer market participation. American Journal of Agricultural Economics, 99(4), 952–970. https://doi.org/10.1093/ajae/aaw097
- Mkindi, J. (2011). Horticulture value chain in Tanzania (20th ed.). Tanzania Horticultural Association (TAHA).
- Mmbando, F. E., Wale, E. Z., & Baiyegunhi, L. J. (2015). Welfare impacts of smallholder farmers’ participation in maize and pigeon pea markets in Tanzania. Food Security, 7(6), 1211–1224. https://doi.org/10.1007/s12571-015-0519-9
- Mossie, M., Gerezgiher, A., Ayalew, Z., & Nigussie, Z. (2020). Determinants of smallscale farmers’ participation in Ethiopian fruit sector’s value chain. Cogent Food & Agriculture, 6(1), 1842132. https://doi.org/10.1080/23311932.2020
- Nakawuka, P., Langan, S., Schmitter, P., & Barron, J. (2018). A review of trends, constraints and opportunities of smallholder irrigation in East Africa. Global Food Security, 17, 196–212. https://doi.org/10.1016/j.gfs.2017.10.003
- Ngema, P. Z., Sibanda, M., & Musemwa, L. (2018). Household food security status and its determinants in Maphumulo local municipality, South Africa. Sustainability, 10(9), 3307.
- Oduniyi, O. S., Antwi, M. A., & Mukwevho, A. N. (2022). Assessing emerging beef farmers’ participation in high-value market and its impact on cattle sales in South Africa. International Journal of Agricultural Research, Innovation and Technology, 11(2), 27–36. Ethiopia https://doi.org/10.3329/ijarit.v11i2.57252outhern
- Poole, N. (2017). Smallholder agriculture and market participation. Food and Agriculture Organizations of the United Nations (FAO).
- Rahut, B. R., & Ali, A. (2018). Impact of climate-change risk-coping strategies on livestock productivity and household welfare: Empirical evidence from Pakistan. Heliyon, 4(10), e00797. https://doi.org/10.1016/j.heliyon.2018.e00797
- Reardon, T. (2015). The hidden middle: the quiet revolution in the midstream of agrifood value chains in developing countries. Oxford Review of Economic Policy, 31(1), 45–63. https://doi.org/10.1093/oxrep/grv011
- Regasa, M. S., Nones, M., & Adeba, D. (2021). A review on land use and land cover change in Ethiopian Basins. Land, 10(6), 585. https://doi.org/10.3390/land10060585
- Romero Granja, C., & Wollni, M. (2018). Dynamics of smallholder participation in horticultural export chains: Evidence from Ecuador. Agricultural Economics, 49(2), 225–235. https://doi.org/10.1111/agec.12411
- Rosenbaum, P. R. (2002). Observational studies (2nd ed.). Springer.
- Seng, K. (2016). The effects of market participation on farm households’ food security in Cambodia: An endogenous switching approach [PhD thesis]. University Library of Munich, Munich Personal RePEc Archive.
- Sharp, K., Ludi, E., & Gebreselassie, S. (2008). Commercialization of farming in Ethiopia: Which pathways? Ethiopian Journal of Economics, 16(1), 39–54. https://doi.org/10.4314/eje.v16i1.39823
- Shiimi, T., Taljaard, T. P. R., & Jordaan, H. (2012). Transaction cost and cattle farmers’ choice of marketing channel in North Central Namibia. Agrekon, 51(1), 42–58. https://doi.org/10.1080/03031853.2012.649543
- Smale, M., Diakité, L., & Keita, N. (2012). Millet transactions in market fairs, millet diversity and farmer welfare in Mail. Environment and Development Economics, 17(5), 1–17. https://doi.org/10.1017/S1355770X12000216
- Tamirat, G., & Muluken, P. (2018). Analysis of apple fruit value chain in southern Ethiopia; the Case of Chencha District. Greener Journal of Plant Breeding and Crop Science, 6(3), 26–34. 10.15580/GJPBCS.2018.3.100218043
- Tarekegn, K., Asado, A., Gafaro, T., & Shitaye, Y. (2020). Value chain analysis of banana in Bench Maji and Sheka Zones of Southern Ethiopia. Cogent Food & Agriculture, 6(1), 1785103. https://doi.org/10.1080/23311932.2020.1785103
- Warsanga, W. B., & Evans, E. A. (2018). Welfare impact of wheat farmers’ participation in the value chain in Tanzania. Modern Economy, 09(04), 853–887. https://doi.org/10.4236/me.2018.94055
- Wiggins, S. (2014). African agricultural development: Lessons and challenges. Journal of Agricultural Economics, 65(3), 529–556. https://doi.org/10.1111/1477-9552.12075
- Wooldridge, J. M. (2010). Econometric analysis of cross-section and panel data. MIT Press.
- Wordofa, M. G., Hassen, J. Y., Endris, G. S., Aweke; D, C. S., Moges, K., & Rorisa, D. T. (2021). Adoption of improved agricultural technology and its impact on household income: A propensity score matching estimation in Eastern Ethiopia. Agriculture Food Security, 10, 5. https://doi.org/10.1186/s40066-020-00278-2
- Zegeye, M. B., Fikrie, A. H., & Assefa, A. B. (2022). Impact of agricultural technology adoption on wheat productivity: Evidence from North Shewa Zone. Amhara Region, Ethiopia. Cogent Econ. Finance, 10, 2101223. https://doi.org/10.1080/23322039.2022.2101223
- Zoungrana, A. (2022). Income diversification and food security: Evidence from Burkina Faso. MPRA Paper No. 112337. https://mpra.ub.uni-muenchen.De/112337/
Appendix A
Food security measurement
In this study, the household food security/insecurity were calculated using the Household Food Insecurity Access Prevalence (HFIAP) indicators. Firstly, we coded frequency-of-occurrence as 0 for all cases where the answer to the corresponding occurrence question was “no” (i.e. if the answer to Q1 was “no” then frequency-of-occurrence was coded as Q1 = 0 and so on). If the answer to the occurrence question was “yes”, then a frequency-of-occurrence question was coded as 1 for all cases where the situation occurred rarely, 2 for sometimes, and 3 for often. In short, each occurrence question () was assigned four alternative codes (e.g. Q1 was coded as Q1 = 0 for no occurrence, Q1 = 1 for rare occurrence, Q1 = 2 for occasional occurrence, or Q1 = 3 for frequent occurrence). Secondly, the Household Food Insecurity Access (HFIA) category variable was calculated for each household using the assigned codes of the degree of food security/insecurity in which it fell. Accordingly, four categories of food in/security status were created sequentially, (1 = food secure, 2 = mildly food insecure, 3 = moderately food insecure, and 4 = severely food insecure), to ensure that households were classified according to their most severe response.
Table 1-A. Questions in the food security/insecurity.
Each category of the household food security/insecurity was calculated from the above table as:
Food secure = 1 if [(Q1 = 0 or Q1 = 1) and Q2 = 0 and Q3 = 0 and Q4 = 0 and Q5 = 0 and Q6 = 0 and Q7 = 0 and Q8 = 0 and Q9 = 0]
Mildly food insecure = 2 if [(Q1 = 2 or Q1 = 3 or Q2 = 1 or Q2 = 2 or Q2 = 3 or Q3 = 1 or Q4 = 1)and Q5 = 0 and Q6 = 0 and Q7 = 0 and Q8 = 0 and Q9 = 0]
Moderately food insecure = 3 if [(Q3 = 2 or Q3 = 3 or Q4 = 2 or Q4 = 3 or Q5 = 1 or Q5 = 2 or Q6 = 1 or Q6 = 2) and Q7 = 0 and Q8 = 0 and Q9 = 0]
Severely food insecure = 4 if [Q5 = 3 or Q6 = 3 or Q7 = 1 or Q7 = 2 or Q7 = 3 or Q8 = 1 or Q8 = 2 or Q8 = 3 or Q9 = 1 or Q9 = 2 or Q9 = 3]
Finally, the household food security was calculated by dividing the number of households in one category to the total number of households in the four categories.