
Abstract
The accomplishment of Sustainable Development Goals (SDGs) is intrinsically connected to improving livelihoods in the Rural Global South (RGS). RGS livelihoods are complex, showing multiple dimensions beyond mere economic considerations. However, many related development policies (over)simplify livelihoods to income thresholds, leading to flawed interventions. Adequate strategies to address RGS livelihoods require a much deeper understanding of their various dimensions and complexities. Q methodology (Q) is a powerful participatory research technique that enables the systematic study of different viewpoints on subjective topics. Moreover, it has the potential to identify and reveal previously unheard narratives, thus allowing us to question the traditional understandings of RGS livelihoods. Yet, as a time- and assistance-intensive technique, its implementation faces methodological challenges that are currently overlooked and ought to be considered. We selected and reviewed 50 Q studies applied to different forms of RGS livelihoods. First, we discuss several on-field Q limitations associated with the physical, logistical, social, and cultural constraints. Second, we draw on good practices and strategies to cope with these limitations. Notwithstanding the limitations and strategies, we advocate building Q capacities and the gender-balanced empowerment of local researchers. This may contribute to a better understanding of the nuances and challenges of RGS livelihoods.
Reviewing Editor:
1. Introduction
The accomplishment of several Sustainable Development Goals (SDGs) is intrinsically connected to the generation and improvement of sustainable livelihoods in the Rural Global SouthFootnote1 (RGS) (Tambe, Citation2022). As 84% of the 1.3 billion multidimensionally poor (i.e., deprived of several resources and services) live in the RGS, uplifting their means of living is cornerstone in meeting global development targets (Tambe, Citation2022). RGS livelihoods are varied and complex, showing multiple dimensions far beyond the typically observed economic consideration: capabilities, activities, material resources, and social assets (Nunan et al., Citation2023). In contrast, related development policies still resort to income thresholds [e.g., World Bank’s International Poverty Line (Lang and Lingnau, Citation2015; United Nations, Citation2021)] as the compass to evaluate and benchmark livelihood conditions (Ascher, Citation2021). Such definitions and metrics overshadow the context-dependent diversity and complexity of RGS livelihoods (Chambers, Citation2017; Nunan et al., Citation2023). In addition, facilitators of development programs are usually outsiders who imprint their own priorities, often related to a number of substantial biases (e.g., spatial bias, project bias, person bias, seasonal bias, etc.) (Chambers, Citation2017; Chambers, Citation1983; Datta, Citation2019). These limited approaches have led to a distorted comprehension of the issues that face RGS populations, and therefore to ineffective livelihoods interventions (Ascher, Citation2021).
Smallholder agriculture is a good example of how an inadequate understanding of RGS livelihoods’ dynamics has resulted in many failures (Fan and Rue, Citation2020; Waarts et al., Citation2021). This sector represents the most prominent livelihood in RGS economies. It is the main occupation of 70% of the RGS poor, supplies up to 80% of the food consumed in Asia and sub-Saharan Africa, and is the main activity of approximately 50% of RGS women in several countries (Poole, Citation2017). Investing in smallholder farming is therefore a crucial strategy in boosting RGS economies, securing and increasing incomes (SDG 1), providing decent and inclusive work (SDG 8), and supporting food security (SDG 2) (Fan et al., Citation2013; Giordano et al., Citation2019; Mellor and Malik, Citation2017; Poole, Citation2017). Unfortunately, many policies and interventions have not addressed farmers’ actual needs and expectations (Giordano et al., Citation2019). Contrariwise, those have resulted in failures, such as biases in agricultural mechanization and technology adoption (Devkota et al., Citation2020; Van Loon et al., Citation2020), lack of empowerment of female farmers (Akter et al., Citation2017; Slavchevska et al., Citation2019; Theis et al., Citation2018), and high rates of rural youth disengagement and unemployment (Gc and Hall, Citation2020; Hazell and Rahman, Citation2014).
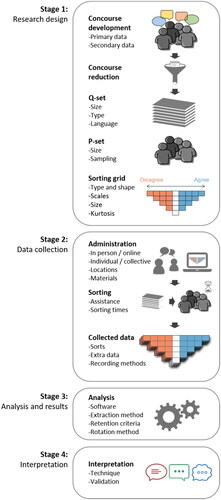
Adequate strategies to address RGS livelihoods require a much deeper understanding of their various dimensions and multifaceted characteristics (Chambers, Citation2017; Lang and Lingnau, Citation2015; Nunan et al., Citation2023). Numerous research approaches and methods to unravel the complexities of RGS livelihoods have arisen in response to this need (Chambers, Citation2017; Nunan et al., Citation2023). These include quantitative approaches, quantitative and qualitative longitudinal studies, ethnographic studies, participatory rural appraisal, participatory video research, among others. Alongside these approaches and methods, Q methodology (henceforth referred to as Q) has emerged as a powerful participatory research technique that enables the study of human subjectivity. It allows researchers to shift from single (and perhaps oversimplified) definitions around a particular topic or phenomenon (e.g., RGS livelihoods) to the systematic analysis of diverse perspectives about it (Previte et al., Citation2007). Simultaneously, Q embraces this diversity while maintaining a reductionist approach. This results in consistently clustered viewpoints that represent the spectrum of individual perceptions. Moreover, by systematically encompassing grassroots voices throughout its four stages (), Q helps identify and reveal previously unheard narratives, hence potentially allowing us to question traditional and/or dominant understandings of RGS livelihoods. Owing to these reasons, we argue that Q holds a strong potential to study the complex nature of and support interventions on RGS livelihoods. More background information on Q can be found in Appendix A of the Data availability statement.
Figure 1. Stages and steps of Q, adapted from (Zabala et al., Citation2018).
The potential of Q has been systematically assessed in review articles focused on psychology and behavioral studies (Dziopa and Ahern, Citation2011), conservation research (Zabala et al., Citation2018), healthcare research (Churruca et al., Citation2021), and even on its methodological choices across a wide range of disciplines (Dieteren et al., Citation2023). Despite this potential and its effective implementation across disciplines (Watts & Stenner, Citation2012; Zabala and Pascual, Citation2016), Q is seldom engaged with a focus on RGS livelihoods. Even in such cases, the on-field methodological choices and points of attention are seemingly underreported. Hardly any study has critically elaborated on the methodological implications of Q in these contexts, let alone in those related to any form of (smallholder) agriculture. Considering the challenges of conducting fieldwork in the RGS (Breman, Citation1985; Casale et al., Citation2013; Chacko, Citation2004; Potnis and Gala, Citation2020; Strijker et al., Citation2020), and as part of a larger Q-led doctoral project conducted at Delft University of Technology (Intriago et al., Citation2018), in this article we aim to analyze and discuss: (1) methodological challenges of implementing Q to study RGS livelihoods; and (2) the best (reported) practices to cope with these challenges, with emphasis on the stages that imply on-field methodological choices (i.e., research design, data collection, and interpretation). Through this study, we expect to make two key contributions: first, to expand the understanding about the methodological implications of Q in RGS settings; and second, to help researchers make informed methodological choices when engaging Q to study RGS livelihoods.
2. Methodology
We employed a semi-systematic approach in this review. As (Snyder, Citation2019) argues, this is an appropriate strategy to review mixed qualitative/quantitative information and identify knowledge gaps in the literature. Our approach enabled us to synthesize state-of-the-art knowledge on the application of Q in RGS settings, its intrinsic methodological issues, and best practices.
2.1. Sources of information
We chose database search as the preferred technique to search for references. Because this review focuses on the application of Q across different fields instead of discipline-specific studies, we opted for two multidisciplinary scientific databases, namely Scopus and Web of Science. Complementarily, we triangulated these databases using Google Scholar to prevent location bias. In addition to the database search, we also used snowball sampling (through bibliographic references and hyperlinks) to identify additional documents that did not appear in the iterative searches.
2.2. Search criteria
To search for the literature in the respective scientific databases, we used the terms “Q methodology” and “Q-methodology”, in combination with any/some of the following terms: “rural”, “farm”, “farmer”, “farming”, “smallholder”, “agriculture”, “irrigation”, “water”, “forest”, “forestry”. We acknowledge the possible biases in the review as a consequence of screening literature using terms exclusively in the English language. We believe that our results provide sufficient details and discussion to accept this language-based restriction in our review.
We searched for references between April and August 2020, and within the publishing period of 2010–2020. Through iterative searches, it became apparent that prior to that period, very few studies fit within the scope of this review.
2.3. Selection criteria
Within the scope of the present study, we employed the following inclusion criteria to determine the relevance of selected documents:
Application of Q as (one of the) main research technique(s);
Addressing topics around RGS livelihoods, with particular emphasis on any form of (smallholder) agriculture;
Direct involvement of RGS dwellers during the methodological cycle of Q, with a specific emphasis on smallholder farmers; and,
Given the incipient and unfamiliar use of Q in RGS settings, a peer-reviewed scientific article, published in a SCImago-indexed journal, with emphasis on Q1/Q2 impact factor quartiles.
Notwithstanding the above inclusion criteria, the final selection of studies was made based on our judgement. In our discussion below, we left aside five studies that, although fulfilled the set of criteria, showed a lack of (Q) methodological clarity (Dingkuhn et al., Citation2020; Leong and Lejano, Citation2016; Nijnik et al., Citation2017), or considered RGS livelihoods from the perspective of non-rural actors (i.e., extension officers) (Bond, Citation2016; Easdale et al., Citation2020).
2.4. Analytical methods and abstracted data
We analyzed the selected documents through a content analysis. Using this technique, we abstracted two types of information: descriptive information and the effects and findings of each study (Snyder, Citation2019). The former comprised general characteristics of studies, that is, subject of study, category of Q study, (non) open access, and geographical foci of both study areas and researchers’ affiliations. This information contributed to revealing possible underlying Q research gaps between Global South and Global North. The latter consisted of Q methodological choices and their consequent findings, in accordance with the four methodological stages of Q pointed out above (), with special emphasis on fieldwork, that is, research design and data collection.
3. Main findings
We selected in total 50 studies based on the above selection criteria. summarizes the data extracted from these studies. The complete dataset with qualitative and quantitative information obtained during the semi-systematic review process can be found in Appendix B of the Data availability statement.
Table 1. Data extracted from the 50 selected studies.
3.1. Characteristics of studies
The selected studies belonged mainly to the subjectsFootnote2 of environmental studies (n = 15), conservation (n = 7), forest and forestry (n = 5), agriculture (n = 4), and international development (n = 4) (). Whereas rural studies have traditionally focused on these subjects (Strijker et al., Citation2020; Wang and Liu, Citation2014), these leave aside other relevant yet still neglected (Q) research themes in the RGS, including subjects such as rural health, women empowerment, food safety, environmental justice, responsible mechanization, and education. Furthermore, we categorized the 50 selected studies according to the Q themes proposed in (Zabala et al., Citation2018). Most of these studies are within the category of management alternatives (n = 36), with two other categories worth mentioning being conflict resolutions (n = 4) and policy appraisals (n = 10) ().
Figure 2. Characteristics of the selected studies. (a) Number of studies across disciplines of agriculture (AG), international development (ID), environmental studies (ES), conservation (CO), forests and forestry (FF), veterinary sciences (VS), and others (OT). (b) Number of studies per category of Q study [as defined by (Zabala et al., Citation2018)] as conflict resolution (CR), management alternatives (MA) and policy appraisal (PA). (c) Number of studies published as (non)open-access documents. (d) Number of studies per geographical region, across Australasia (AA), East Asia (EA), Eastern Europe (EE), Middle East (ME), Central America (CA), South America (SA), South Asia (SAs), Southeast Asia (SEA) and sub-Saharan Africa (SSA); solid dark gray, solid light gray and diagonal-line patterns on each bar represent the proportions of low-, lower-middle- and upper-middle-income countries, respectively.
![Figure 2. Characteristics of the selected studies. (a) Number of studies across disciplines of agriculture (AG), international development (ID), environmental studies (ES), conservation (CO), forests and forestry (FF), veterinary sciences (VS), and others (OT). (b) Number of studies per category of Q study [as defined by (Zabala et al., Citation2018)] as conflict resolution (CR), management alternatives (MA) and policy appraisal (PA). (c) Number of studies published as (non)open-access documents. (d) Number of studies per geographical region, across Australasia (AA), East Asia (EA), Eastern Europe (EE), Middle East (ME), Central America (CA), South America (SA), South Asia (SAs), Southeast Asia (SEA) and sub-Saharan Africa (SSA); solid dark gray, solid light gray and diagonal-line patterns on each bar represent the proportions of low-, lower-middle- and upper-middle-income countries, respectively.](/cms/asset/cec50e90-2790-4c20-88d1-51e78b5a69f4/oass_a_2359018_f0002_b.jpg)
Only 16% (n = 8) of the selected papers were published as open-access (Carmenta et al., Citation2017; Giannichi et al., Citation2018; Mayett-Moreno et al., Citation2017; Rust, Citation2017; Schuman et al., Citation2018; Sumberg et al., Citation2017; Truong et al., Citation2017; Truong et al., Citation2019) (). Given the financial, legal, and technical restrictions faced by low- and middle-income countries, open access to scientific knowledge and data is crucial in the development of their research (Arunachalam, Citation2017; Chan et al., Citation2005; Serwadda et al., Citation2018; Zachariah et al., Citation2014). It seems paradoxical that, to a large extent, the selected studies, which can directly benefit (Q) researchers in Global South countries, are not (easily) accessible to these scholars.
3.2. Geographical foci
Despite their strong focus on RGS populations, only two publications (Schuman et al., Citation2018; Truong et al., Citation2019) were authored by researchers exclusively affiliated with institutions in their respective target countries. As illustrated on the world map in , most studies were conducted by (main) authors exclusively (n = 25) or partially affiliated (n = 6) with organizations located in countries of the Global North. The selected studies showed a strong emphasis on Southeast Asia (n = 15), South America (n = 14), and sub-Saharan Africa (n = 9) ( and ). As represented in , only 10% of the studies (n = 5) (Hamadou et al., Citation2016; Hilhorst et al., Citation2012; Jiren et al., Citation2020; Stoudmann et al., Citation2017; Weldegiorgis and Ali, Citation2016) aimed specifically at low-income countries, which bear the weakest economic category, where the livelihoods of RGS dwellers face more profound subsistence challenges. Moreover, none of the studies that focused on low-income countries were (exclusively) carried out by researchers and institutions within their national boundaries, nor from any other Global South country (). This might reflect the access and equality issues that researchers from these geographical areas have to confrontFootnote3. This clear decoupling between the places where the study has been envisaged and carried out, and where the data have been collected, could pose even further constraints for the (still limited) research capacities in the Global South. According to (ESSENCE on Health Research, Citation2014), research capacity building should be a long-term, explicit process that must go beyond the temporal scope of a single project or grant, whereas (Shucksmith and Brown, Citation2016) advocates the international co-production of knowledge between a number of (non)academic actors whose outputs must be more accessible and understandable for wider audiences. In addition, this detachment, which leads to sporadic, spatially biased contacts, could play against robust relationships and trust between researchers and communities, which are key requirements in rural studies (Chambers, Citation2017; Chambers, Citation1983).
Figure 3. Geographic location of main authors’ affiliations and studies per the theme of Q study [as defined by (Zabala et al., Citation2018)].
![Figure 3. Geographic location of main authors’ affiliations and studies per the theme of Q study [as defined by (Zabala et al., Citation2018)].](/cms/asset/23825b8c-fea4-4660-bdb6-90871eb7bedb/oass_a_2359018_f0003_c.jpg)
3.3. Research design
3.3.1. Concourse development
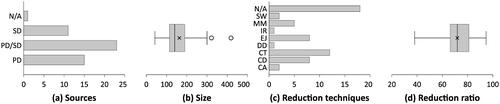
A minority (n = 15) of the selected studies relied purely on primary data for the development of their concourse, either exclusively for their respective studies (Brannstrom, Citation2011; Frate and Brannstrom, Citation2015; Kopytko and Pruneddu, Citation2018; Mayett-Moreno et al., Citation2017; Rodriguez-Piñeros et al., Citation2012; Rodríguez-Piñeros et al., Citation2018; Schuman et al., Citation2018; Stoudmann et al., Citation2017; Truong et al., Citation2017; Truong et al., Citation2019; Vargas et al., Citation2019) or as part of a larger umbrella project (Lairez et al., Citation2020; Nordhagen et al., Citation2017; Pirard et al., Citation2016; Schneider et al., Citation2015). Moreover, only five of these studies relied solely on RGS dwellers (Mayett-Moreno et al., Citation2017; Rodriguez-Piñeros et al., Citation2012; Schuman et al., Citation2018; Stoudmann et al., Citation2017; Truong et al., Citation2017). Approximately half of the studies (n = 23) employed a mixed primary/secondary data approach (Alexander et al., Citation2018; Astari and Lovett, Citation2019; Bumbudsanpharoke et al., Citation2009; Cammelli et al., Citation2019; Carmenta et al., Citation2017; Forouzani et al., Citation2013; Giannichi et al., Citation2018; Hamadou et al., Citation2016; Hilhorst et al., Citation2012; Hugé et al., Citation2016; Jaung et al., Citation2016; Jiren et al., Citation2020; Lansing, Citation2013; Rodríguez-Piñeros and Mayett-Moreno, Citation2015; Rust, Citation2017; Sumberg et al., Citation2017; Taheri et al., Citation2020; Tuokuu et al., Citation2019; Weldegiorgis and Ali, Citation2016; Wijaya and Offermans, Citation2019; Yeboah et al., Citation2017; Zabala et al., Citation2017; Zobeidi et al., Citation2016), whereas 11 studies used only secondary data (Anderson and Jacobson, Citation2018; Barbosa et al., Citation2020; Huaranca et al., Citation2019; Leite et al., Citation2019; Moros et al., Citation2020; Nguyen et al., Citation2018; Nhem and Lee, Citation2020; Nhem and Lee, Citation2019; Pereira et al., Citation2016; Rijneveld and Marhaento, Citation2020; Vela-Almeida et al., Citation2018) (). The concourses varied in size from as small as 42 (Brannstrom, Citation2011) to as large as 419 statements (Bumbudsanpharoke et al., Citation2009) ().
Figure 4. Characteristics of the concourse. (a) Number of studies per source for concourse construction, based on primary data (PD), secondary data (SD) and mixed sources (PD/SD). (b) Size of the constructed concourse in a number of statements across studies. (c) Number of studies per concourse reduction technique, comprising software (SW), matrix method (MM), iterative refinement (IR), expert judgement (EJ), division in discourses (DD), categorization (CT), combination and deletion of similar statements (CD), content analysis (CA). (d) Concourse reduction ratio across studies, expressed as the decreasing percentage between the concourse and the Q-set.
The development of the concourse requires time and rigor to ensure that the eventual Q-set represents an acceptable range of voices involved in the topic under study (Simons, Citation2013; Watts & Stenner, Citation2012). Although the concourse can be built purely from secondary data (Donner, Citation2001), it makes sense to incorporate primary data to guarantee proper representation of the range of discourses (Simons, Citation2013). When addressing understudied topics, geographic areas, and/or human groups, primary data collection for concourse development from RGS dwellers might become the only (or at least main) option. Seven studies (Nordhagen et al., Citation2017; Rodriguez-Piñeros et al., Citation2012; Rodríguez-Piñeros et al., Citation2018; Schuman et al., Citation2018; Stoudmann et al., Citation2017; Truong et al., Citation2017; Truong et al., Citation2019) are remarkable examples of such cases, especially because of their exhaustive primary data sources. In certain cases, however, RGS dwellers may be located in too remote—or ultimately almost unreachable—areas, or their political-cultural values or legal status could hide potential participants (e.g., lower-caste individuals, refugees and displaced groups, women of particular societies, individuals involved in illegal activities). Moreover, purely primary data collection for the concourse is not always applicable nor is perhaps the best approach when (financial) resources are a main limiting factor (Barbosa et al., Citation2020; Schneider et al., Citation2015) or when it is difficult to (re)visit participants (Giannichi et al., Citation2018; Kopytko and Pruneddu, Citation2018; Schneider et al., Citation2015; Truong et al., Citation2019; Yeboah et al., Citation2017).
Considering these possible limitations, three strategies for concourse development should be considered. First, (partially) resort to reliable secondary data, mainly if produced around the same study area or population. Second, reuse primary data from previous fieldwork activities, especially when they were part of a larger research program, as applied by (Alexander et al., Citation2018; Cammelli et al., Citation2019; Schneider et al., Citation2015). Third, as reported in (Astari and Lovett, Citation2019; Hamadou et al., Citation2016; Jiren et al., Citation2020; Kopytko and Pruneddu, Citation2018; Pirard et al., Citation2016; Rust, Citation2017; Taheri et al., Citation2020; Truong et al., Citation2019; Wijaya and Offermans, Citation2019), to build the concourse based on proxies’ discourses (i.e., experts, advisors, scholars, etc.), although researchers must be aware of its potential compromise in the accuracy and representativeness of the viewpoints (Cobb, Citation2018).
3.3.2. Concourse reduction
There is no specific recipe or fixed methodology on how to reduce the collected concourse to statements, let alone the number of statements required by the study. An appropriate approach is to consider the coverage and balance of the statements in such a way that they become as equally representative and balanced as possible across the different discourses (Watts & Stenner, Citation2012; Zabala et al., Citation2018). The reduction process should not eliminate any relevant statement of certain discourse(s), given that it will provoke further biases in the later sorts. Here, it may be good to remind ourselves that the Q set aims to create possible combinations between statements as expressions of diverse perspectives; as such, individual statements should represent sufficient diversity themselves but would not need to cover every possible perspective as such.
Most of the selected studies (Brannstrom, Citation2011; Huaranca et al., Citation2019; Hugé et al., Citation2016; Jiren et al., Citation2020; Lansing, Citation2013; Rodriguez-Piñeros et al., Citation2012; Truong et al., Citation2019; Vargas et al., Citation2019; Weldegiorgis and Ali, Citation2016; Zabala et al., Citation2017) relied on a reductionist technique of categorization, that is, classification into different categories within the found discourses, to filter statements out of the general concourse. Other studies (Barbosa et al., Citation2020; Giannichi et al., Citation2018; Nhem and Lee, Citation2019; Nordhagen et al., Citation2017; Rust, Citation2017; Tuokuu et al., Citation2019) applied a basic method of combining similar statements and deleting duplicates, redundant, and/or unclear ones. Other less frequent methods for selection of statements were purely expert judgement (Alexander et al., Citation2018; Anderson and Jacobson, Citation2018; Frate and Brannstrom, Citation2015; Nhem and Lee, Citation2019; Pirard et al., Citation2016; Rodríguez-Piñeros et al., Citation2018), matrix method (Astari and Lovett, Citation2019; Bumbudsanpharoke et al., Citation2009; Cammelli et al., Citation2019; Forouzani et al., Citation2013; Zobeidi et al., Citation2016), content analysis (Mayett-Moreno et al., Citation2017; Rodríguez-Piñeros and Mayett-Moreno, Citation2015), division of statements according to found discourses (Astari and Lovett, Citation2019), and funnel-like iterative refinement (Carmenta et al., Citation2017). Other authors (Moros et al., Citation2020; Taheri et al., Citation2020; Wijaya and Offermans, Citation2019) have employed combinations of these techniques. Moreover, (Astari and Lovett, Citation2019) and (Rodríguez-Piñeros et al., Citation2018) were the only studies that used specific qualitative data analysis software (Nvivo 11 and ATLAS.ti 7.5.9, respectively) to make a systematic selection of statements ().
Q studies dealing with conflict resolution may produce an unbalanced representation of discourses, typically in favor of the most powerful voices, while reducing the concourse. This could be more exacerbated when involving less-empowered RGS individuals compared to other stronger actors (Vela-Almeida et al., Citation2018; Weldegiorgis and Ali, Citation2016). Here, the matrix method becomes interesting, as it aims to capture several dimensions of both discourses and categories of statements, thereby ensuring representativeness across viewpoints. Three studies (Astari and Lovett, Citation2019; Forouzani et al., Citation2013; Zobeidi et al., Citation2016) enriched this technique using political discourse theory, as explained by (Dryzek and Berejikian, Citation1993).
There is no ideal concourse reduction percentage; it largely depends on the concourse type, number of sources, and amount of information extracted into the initial statements. As such, this percentage has been found to be not uniform across the selected studies. Of the 23 studies that provided sufficient information to calculate this reduction, two (Anderson and Jacobson, Citation2018; Brannstrom, Citation2011), 13 (Forouzani et al., Citation2013; Giannichi et al., Citation2018; Hugé et al., Citation2016; Lansing, Citation2013; Nhem and Lee, Citation2020; Nhem and Lee, Citation2019; Pereira et al., Citation2016; Rust, Citation2017; Taheri et al., Citation2020; Tuokuu et al., Citation2019; Vargas et al., Citation2019; Zabala et al., Citation2017; Zobeidi et al., Citation2016), six (Barbosa et al., Citation2020; Frate and Brannstrom, Citation2015; Moros et al., Citation2020; Rodriguez-Piñeros et al., Citation2012; Rodríguez-Piñeros et al., Citation2018; Wijaya and Offermans, Citation2019), and two (Bumbudsanpharoke et al., Citation2009; Leite et al., Citation2019) reported reductions of <50%, 50%–75%, 75%–90% and even up to >90%, respectively ().
3.3.3. Q-set (size)
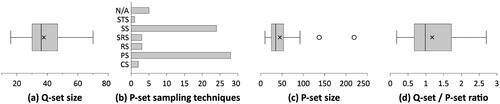
The size of the Q-set across studies ranged from 16 to 70, although most were around 30-50 (). The decision on the Q-set size should not be underestimated, nor should it be considered as a mere output of the concourse reduction process. Some authors have reported ideal sizes as high as 40–80, ≥40, ≥60 and 60–90 (Watts & Stenner, Citation2012). Large Q-sets enlarge the (already time-consuming) sorting process, thereby possibly discouraging respondents and eventually increasing the dropout rate (Previte et al., Citation2007; Simons, Citation2013; Stone et al., Citation2017). In light of these two antagonistic positions and considering RGS-related constraints for Q (e.g., illiteracy, improper site conditions, exposure to elements), researchers may be inclined to keep a highly reduced number of statements (Alexander et al., Citation2018; Cammelli et al., Citation2019; Nordhagen et al., Citation2017; Sumberg et al., Citation2017), without compromising the representativeness of the discourses.
Figure 5. Characteristics of research design. (a) Q-set size in a number of statements across studies. (b) Number of studies per P-set sampling techniques, including convenience sampling (CS), purposive sampling (PS), random sampling (RS), stratified random sampling (SRS), snowball sampling (SS) and structured sampling (STS). (c) P-set size in number of participants across studies. (d) Q-set/P-set ratio across studies.
3.3.4. Q-set (presentation of statements)
The vast majority of the selected studies (n = 47) presented statements solely in written form. Exceptions to this are (Carmenta et al., Citation2017) which also included images (though not specified) next to written statements; (Barbosa et al., Citation2020) which would suggest the use of illustrations along with the wording; and (Alexander et al., Citation2018) which was the only one conducted with a photo-based Q-set supported by proxy statements. The latter was intentionally chosen, along with just 16 statements, to reduce the complexity of engaging semi-literate Laotian farmers. Researchers may encounter other potential limitations besides illiteracy. For instance, participants with visual conditions (e.g., visual impairment and color blindness) would require visual items to be carefully implemented. Some authors have employed high-contrast designs and even statements written in Braille (Huang and Yu, Citation2013; Salaj and Kiš-Glavaš, Citation2017), whereas others advocate for non-conventional audiovisual-based Q-sets (Nazariadli et al., Citation2019). It is noteworthy that the latter are usually attached to digital tools and software such as VQMethod (Nazariadli, Citation2020), whose availability and/or applicability could be compromised in RGS contexts.
Most of the selected studies (n = 36) presented their statements written in a Latin script language (Afaan Oromo, English, French, Malagasy, Malay, Indonesian, Kinyarwanda, Portuguese, Spanish, Tok Pisin, Tswana, and Afrikaans). From these, (Astari and Lovett, Citation2019) and (Hugé et al., Citation2016) worked with a combination of Indonesian/English and Malay/English, respectively, whereas (Stoudmann et al., Citation2017) presented a unique successive translation of French, Malagasy, Sihanaka dialect, and Betsimisaraka dialect. In contrast, 14 studies (Alexander et al., Citation2018; Bumbudsanpharoke et al., Citation2009; Forouzani et al., Citation2013; Hilhorst et al., Citation2012; Hu et al., Citation2018; Kopytko and Pruneddu, Citation2018; Lairez et al., Citation2020; Nguyen et al., Citation2018; Nhem and Lee, Citation2020; Nhem and Lee, Citation2019; Taheri et al., Citation2020; Truong et al., Citation2017; Truong et al., Citation2019; Zobeidi et al., Citation2016) were conducted in non-Latin script languages (Khmer, Lao, Mandarin, Nepali, Persian, Thai, and Ukrainian). Although the latter does not seem to pose any inconvenience for the administration of hand-written Q-sets, it certainly might bear further limitations for researchers willing to rely on digital/electronic platforms and tools (Nazariadli, Citation2020; University of Birmingham, Citation2010; SurveyMonkey, Citation2020; Pruneddu, Citation2011). For example, current popular software has limited use (or none at all) of certain non-Latin script languages, which tend to belong to Global South cultures. For some Asian languages, complex and rare characters are not even defined for digital systems (Lee, Citation2019). Trivial operations, such as operating files of written statements across several platforms and throughout different software products (word processing, spreadsheets, design, CAD, etc.), might create spontaneous modifications in non-Latin characters, thus possibly rendering statements in rather meaningless wording. This digital constraint might further limit the applicability of the aforementioned inclusive audiovisual tools.
The sole use of a national/official language and/or lingua franca, even among native speakers, does not entail immediate accuracy and/or bias reduction. (Pirard et al., Citation2016) highlighted that language could be an issue across several ethnic groups in the study area, and, although relying on a lingua franca (Bahasa Indonesia, in this case) as a solution, respondents still presented different levels of fluency. Other authors (Schuman et al., Citation2018; Stoudmann et al., Citation2017), who had to deal with successive translations throughout a series of languages and dialects, resorted to the committee approach [as defined in (Buil et al., Citation2012)], in which discussions between researchers and translators aimed to use the most suitable terms for each statement, thereby reducing the likelihood of misinterpretation. Although (Barbosa et al., Citation2020) and (Zabala et al., Citation2017) conducted studies in Brazil and Mexico with purely native Portuguese and Spanish speaker research teams, respectively, special care was given to adapting the statements to local terms through extensive iterative piloting with on-site experts and community members.
3.3.5. P-set (sampling techniques)
The P-sets were mainly sampled through purposive sampling (n = 15) (Bumbudsanpharoke et al., Citation2009; Carmenta et al., Citation2017; Forouzani et al., Citation2013; Frate and Brannstrom, Citation2015; Hamadou et al., Citation2016; Huaranca et al., Citation2019; Jiren et al., Citation2020; Lansing, Citation2013; Mayett-Moreno et al., Citation2017; Nhem and Lee, Citation2020; Rodríguez-Piñeros et al., Citation2018; Rodríguez-Piñeros and Mayett-Moreno, Citation2015; Tuokuu et al., Citation2019; Wijaya and Offermans, Citation2019; Zabala et al., Citation2017), snowball sampling (n = 11) (Alexander et al., Citation2018; Cammelli et al., Citation2019; Hugé et al., Citation2016; Leite et al., Citation2019; Nguyen et al., Citation2018; Nhem and Lee, Citation2019; Schneider et al., Citation2015; Stoudmann et al., Citation2017; Sumberg et al., Citation2017; Vela-Almeida et al., Citation2018; Yeboah et al., Citation2017), and a dual-method approach, which is usually a combination of the first two (n = 10) (Brannstrom, Citation2011; Giannichi et al., Citation2018; Jaung et al., Citation2016; Kopytko and Pruneddu, Citation2018; Moros et al., Citation2020; Rust, Citation2017; Schuman et al., Citation2018; Taheri et al., Citation2020; Weldegiorgis and Ali, Citation2016; Zobeidi et al., Citation2016) or in combination with convenience sampling (Anderson and Jacobson, Citation2018; Barbosa et al., Citation2020), random sampling (Nordhagen et al., Citation2017; Truong et al., Citation2019; Vargas et al., Citation2019) and stratified random sampling (Pereira et al., Citation2016). (Hilhorst et al., Citation2012; Pirard et al., Citation2016) and (Truong et al., Citation2017) are the only ones that rely solely on an exclusive approach of stratified random sampling and structured sampling, respectively ().
Both purposive and snowball sampling have become practical methods to recruit potential Q respondents. The selected studies applied these techniques relying on contacts of governmental representatives (Alexander et al., Citation2018; Forouzani et al., Citation2013; Nguyen et al., Citation2018), (local) organizations (Anderson and Jacobson, Citation2018; Cammelli et al., Citation2019; Giannichi et al., Citation2018; Jiren et al., Citation2020; Leite et al., Citation2019; Nhem and Lee, Citation2019; Schneider et al., Citation2015), local experts (Jaung et al., Citation2016), local community leaders (Alexander et al., Citation2018; Cammelli et al., Citation2019; Forouzani et al., Citation2013; Hugé et al., Citation2016; Nguyen et al., Citation2018; Nhem and Lee, Citation2020; Nordhagen et al., Citation2017; Stoudmann et al., Citation2017), and recruited respondents themselves (Barbosa et al., Citation2020; Hugé et al., Citation2016; Schuman et al., Citation2018; Vela-Almeida et al., Citation2018). Their main shortcoming is that researchers may end up with undesirably homogeneous P-sets (Truong et al., Citation2017; Watts & Stenner, Citation2012; Watts and Stenner, Citation2005) associated with the prevalence of existing networks (Cohen and Arieli, Citation2011; Sadler et al., Citation2010). This homogeneity can ultimately leave hard-to-reach RGS respondents aside (Woodley and Lockard, Citation2016), possibly biasing the analyzed viewpoints. For instance, although (Pereira et al., Citation2016; Truong et al., Citation2019) aimed at a gender-balanced P-set, their snowball sampling resulted only in male respondents due to a lack of engagement with/of women. (Schneider et al., Citation2015) acknowledged potential biases in the respondents because of their closeness to a local farmers’ aid organization. (Stoudmann et al., Citation2017) reported that snowballing through village heads was a matter of cultural etiquette, which could lead to other types of unforeseen cultural interactions. (Truong et al., Citation2017) remarked that sampling through key local informants resulted in a limited representation of certain perspectives, thereby hampering their interpretation. Variations in snowball sampling could be suitable for reducing these biases; for instance, turning initial key informants from selectors to legitimators of the spread voice (Sadler et al., Citation2010), or increasing the trust of the desired networks by emphasizing the integrity, transparency, and sensitivity of (local) researchers (Cohen and Arieli, Citation2011).
3.3.6. P-set (size)
Q does not rely on large P-sets but on their diversity of viewpoints (Simons, Citation2013; Stenner et al., Citation2017; Watts & Stenner, Citation2012). Hence, there is not an ideal minimum number of participants. According to (Watts & Stenner, Citation2012), some authors advocate for ranges of 40–60 participants; others favor Q-set/P-set ratios higher than 1, with the number of respondents being lower than the number of statements. P-set sizes across the selected studies ranged from 10 to 219, although the majority were concentrated around 30–50 (). The Q-set/P-set ratios varied from 0.18 to 2.70, with most of them being around 1.0–1.5 (). From the selected studies, only two of them antagonistically elaborated on it: (Jaung et al., Citation2016) appealed to the <1 ratio as an indicator of ideal P-set size, whereas (Wijaya and Offermans, Citation2019) pointed out that a ratio larger than <1 would have increased the likelihood of finding a correlation between loaded respondents.
3.3.7. P-set (gender)
Gender representativeness, particularly concerning women’s participation, did not prove to be an active P-set criterion across the selected studies (). The aggregated female/male ratiosFootnote4 of the selected studies () revealed that female participants were typically about half of their male counterparts. Honorable exceptions are (Barbosa et al., Citation2020), whose focus was exclusively on a female phenomenon, and (Leite et al., Citation2019; Mayett-Moreno et al., Citation2017; Rodríguez-Piñeros and Mayett-Moreno, Citation2015), which considered a strong gender dimension in conducting their studies and interpreting viewpoints. In addition, only two studies (Stoudmann et al., Citation2017; Vargas et al., Citation2019) were explicit about gender balance, whereas (Pirard et al., Citation2016; Sumberg et al., Citation2017; Tuokuu et al., Citation2019; Weldegiorgis and Ali, Citation2016; Wijaya and Offermans, Citation2019; Yeboah et al., Citation2017) aimed towards proper gender diversity and women representation.
Figure 6. P-set size and genders. (a) Number and gender of participants per each of the 50 studies. Numbers on the X-axis correspond to the references. Solid dark gray, solid light gray and diagonal-line patterns on each bar represent the proportions of female participants, male participants, and gender-unspecified participants, respectively. Dashed line, dotted-dashed line and dotted line represent the average of female, male and total participants across studies, respectively. (b) Female/Male ratio across the selected studies. Barbosa et al. (Citation2020) considered female participants only, thus is not represented here.
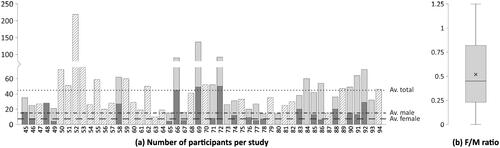
Four studies (Pereira et al., Citation2016; Schneider et al., Citation2015; Taheri et al., Citation2020; Zabala et al., Citation2017) relied exclusively on male participants (). These numbers should not be taken exclusively as unawareness from the researchers but also as a result of potential political and cultural ideas. For instance, (Pereira et al., Citation2016; Truong et al., Citation2019) pointed out that although some women had stronger (legal) attachment to their farms, they gave up responding in favor of their husbands. Schneider et al. (Citation2015) and Wijaya and Offermans (Citation2019) indicated that women were too shy to talk or faced cultural constraints, ultimately declining their participation. Contrarily, Vargas et al. (Citation2019) highlighted the higher number of female participants, though not offering any plausible explanation, whereas (Nordhagen et al., Citation2017) argued that men usually being absent from the village/farm resulted in slightly skewed female participation. Taking into account the particular challenges RGS women must face in accessing resources (Poole, Citation2017; Giordano et al., Citation2019), gender imbalance can cause further biases and/or incompleteness of the topic that researchers expect to understand. Therefore, it is key for Q researchers in RGS settings to adopt cross-cutting, gender-sensitive approaches in their studies, primarily when dealing with male-dominated societies.
3.3.8. Sorting grid
There are no rules to ascertain the sorting grid in which the Q-set must be sorted. Typical shapes include quasi-normal (pyramid) and inverted quasi-normal (inverted pyramid) forced-sorting grids. In this regard, 17 and 20 selected studies provided the former and the latter, respectively (). In contrast, Jiren et al. (Citation2020) used a unique, double-pyramid or diamond shape. This matrix, unlike typical grids, bears a principle of inverted axes. The ranking is performed across a vertical scale, whereas the rows, distributed symmetrically, hold for statements with the same value. A non-forced grid was used in Rijneveld and Marhaento (Citation2020) (not depicted), although the authors did not explain the reason for its use (nor its subsequent analytical process). Lansing (Citation2013) piloted a non-forced distribution that was discarded in favor of a forced grid; the authors argued that the forced approach led participants to reflect more while sorting. In contrast, Hugé et al. (Citation2016) allowed its respondents to deviate from the forced distribution as a way to cope with decision issues while sorting.
Figure 7. Sorting grids of the selected studies. 1(Anderson and Jacobson, Citation2018; Brannstrom, Citation2011; Forouzani et al., Citation2013; Huaranca et al., Citation2019; Hugé et al., Citation2016) did not report the orientation of their grids. They were assumed as inverted distributions. 2The shaded area with thicker border represents the second grid used in (Carmenta et al., Citation2017). 3(Hilhorst et al., Citation2012) did not use a quantitative scale; instead, its authors reported graphical hints (happy/sad faces). 4Reported grids of (Rodríguez-Piñeros and Mayett-Moreno, Citation2015; Schneider et al., Citation2015) did not match with their respective number of statements. 5(Sumberg et al., Citation2017; Yeboah et al., Citation2017) resorted to two grids; only information of one of them was provided.
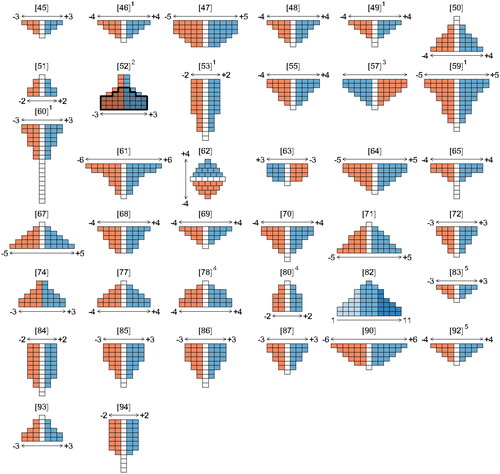
The shape of the sorting grid does not influence the reliability of the method. The forced distribution should be considered as a mere device to encourage respondents to perform a systematic analysis of each item (McKeown and Thomas, Citation1988; Watts & Stenner, Citation2012). However, unless properly designed and explained, the (inverted) pyramidal shape, with the strongest load of statements in the central column, might transmit to the participant the impression of importance, in which the apex of the pyramid should match the most critical statement(s). From this perspective, the diamond grid used by (Jiren et al., Citation2020) would offer a more natural, easy-to-read, top-to-bottom hierarchy, which can be further underpinned by providing graphical hints or ideograms (e.g., sad/happy faces) depicting the degrees of agreement along with the ranking scale (Cammelli et al., Citation2019; Hilhorst et al., Citation2012; Schneider et al., Citation2015).
The sorting grids in Q are structured through two ordinal scales: qualitative and quantitative. The former typically comprises a wording-based scale to measure the level of agreement. The latter, matching with the qualitative one, generally makes use of odd symmetric scales [(Carmenta et al., Citation2017; Pirard et al., Citation2016) become rare even-scale exceptions] with negative and positive sides and several sorting points, whose center corresponds to the neutral position, also referred to as ‘distensive zero’ (Watts & Stenner, Citation2012). Most of the selected studies (n = 39) employed qualitative scales, with (a variation in) the typical disagree/agree scale. Others resorted to (variations of) importance (Alexander et al., Citation2018; Anderson and Jacobson, Citation2018; Carmenta et al., Citation2017; Jiren et al., Citation2020; Nguyen et al., Citation2018), effectiveness (Carmenta et al., Citation2017; Tuokuu et al., Citation2019), (dis)approval (Schneider et al., Citation2015), affection (Rodríguez-Piñeros et al., Citation2018), and self-identification (Mayett-Moreno et al., Citation2017; Rodriguez-Piñeros et al., Citation2012; Rodríguez-Piñeros and Mayett-Moreno, Citation2015). The latter group employed highly personal approaches (I don’t identify with/I identify with, Unlike me/Like me), even though they studied perceptions of external phenomena (i.e., sustainable management of a community-owned forest reserve and related tourism infrastructure) rather than deeply intrinsic subject-wise affairs. In these cases, sorting impersonal statements like ‘Agriculture is not profitable’ (Mayett-Moreno et al., Citation2017), ‘The reserve should have more wild animals’ (Rodriguez-Piñeros et al., Citation2012) or ‘Ecotourism is a way to preserve the forest’ (Rodríguez-Piñeros and Mayett-Moreno, Citation2015), could become sources of confusions. Researchers should pay close attention to the possible mismatches between the wording of statements and the grid’s qualitative scales to prevent respondents from being biased by a false sense of doubt or neutrality.
The quantitative scales of the selected studies ranged from five to 13 points, although most of them were concentrated on seven (n = 13) and nine (n = 19). Although the number of sorting points enlarges/shortens the continuum through which respondents make ranking decisions on a given Q-set (Watts & Stenner, Citation2012), little is mentioned about their impact on the difficulty level of the sorting process. It is logical to think that the more sorting points are offered, the more time the respondent will take to position every single statement, and consequently, the more burdensome the process could become. In turn, this can negatively impact the in-sorting motivation, possibly decreasing the number of well-thought responses, as well as participation and completion rates.
Most of the selected studies (n = 41) employed a negative-to-positive order of the quantitative scales. Exceptions are studies with absolute (Stoudmann et al., Citation2017) and positive-to-negative (Frate and Brannstrom, Citation2015; Kopytko and Pruneddu, Citation2018; Leite et al., Citation2019; Rijneveld and Marhaento, Citation2020; Schuman et al., Citation2018) [and its vertical variation (Jiren et al., Citation2020)] scales. Absolute scales are used to prevent discomfort in the participants due to seemingly forced positive/negative choices while sorting; for example, participants do not necessarily have to feel disagreement, but a lower level of agreement in a negatively ranked statement (Watts & Stenner, Citation2012). Positive-to-negative scales could entail confusion in participants from sociolinguistic contexts with right-to-left reading languages (e.g., Persian, Arabic, Hebrew, Urdu, etc.), where the direction of the scale can enter into conflict with the respondents’ approach to reading and thus understanding (Bergen and Chan Lau, Citation2012).
The range of these scales, in combination with the different Q-set sizes, resulted in a wide diversity of sorting grids of both size and shape. These can be categorized according to the number of statements and kurtosis (). Most of the selected studies used mesokurtic sorting grids (n = 26), consistent with the traditional shapes depicted in introductory studies to Q (Watts & Stenner, Citation2012); 10% (n = 5) and 16% (n = 8) employed less common platykurtic (flat) and leptokurtic (steep) shapes, respectively ().
Table 2. Characteristics of sorting grids with regard to their size and kurtosis.
According to (Watts & Stenner, Citation2012), targeting the correct size and kurtosis of the sorting grid is key to making participants feel comfortable during the sorting process. Two complementary factors that should lead the choices are the complexity or specialized nature of the topic and the related level of knowledge of participants. Steeper grids allow for larger neutrality and less decision making. By contrast, flatter ones are suitable for participants and/or topics that require more fine-grained decisions. Most of the selected studies seemingly made arbitrary choices of sorting grids; scarcely, three offered justifications for their grid choices. Astari and Lovett (Citation2019) implemented platykurtic grids owing to the knowledgeability of the respondents [consistent with (Watts & Stenner, Citation2012)]. (Carmenta et al., 2017) preferred a platykurtic shape (one of the two grids) to enable subtle discrimination throughout many agreed statements. Nordhagen et al. (Citation2017) opted for a mesokurtic grid to diminish low-literacy cognitive barriers by allowing for more neutral positions. In addition, although Hamadou et al. (Citation2016) did not depict the sorting grid, its authors argued its simplicity was chosen because of the low educational level of the respondents.
3.4. Data collection
3.4.1. Location and materials
Q is typically a space-demanding technique that requires controlled environments and large flat workspaces. The use of appropriate, robust, and resistant materials can cause a substantial difference during their administration (Donner, Citation2001; Watts & Stenner, Citation2012). Only 20% of the studies (n = 10) reported their respective locations where sorting occurred. Most of these (Cammelli et al., Citation2019; Lairez et al., Citation2020; Nhem and Lee, Citation2020; Rodríguez-Piñeros and Mayett-Moreno, Citation2015; Truong et al., Citation2017; Truong et al., Citation2019; Zobeidi et al., Citation2016) mentioned respondents’ houses or farms, whereas others pointed out generically each village or community (Schneider et al., Citation2015; Weldegiorgis and Ali, Citation2016), offices of stakeholders (Weldegiorgis and Ali, Citation2016; Zobeidi et al., Citation2016), and schools (Anderson and Jacobson, Citation2018). In RGS contexts, particularly in remote and scattered areas where it is not feasible to gather participants at specific locations, ideal site conditions cannot be easily met and controlled. If the sorting location is the main workplace of the dweller, exposure to the elements (i.e., sun, wind, rain, and moisture) will certainly imply further constraints for researchers (Cheema et al., Citation2018). Lack of proper furniture (e.g., large tables and chairs for participants) is another point of concern that must not be overlooked, as it can hamper the engagement of participants. Probably due to the unavailability of these facilities, some of the selected studies were sorted directly on the floor (Cammelli et al., Citation2019; Lairez et al., Citation2020).
Although 30 of the selected studies indicated certain use of materials, most of these referred only to generic instruments such as ‘cards’ and ‘boards’. Others provided further specifications, such as paper (Huaranca et al., 2019; Nhem and Lee, Citation2020; Nhem and Lee, Citation2019; Rodríguez-Piñeros and Mayett-Moreno, Citation2015; Sumberg et al., Citation2017; Yeboah et al., 2017), (thin) paper/cardboard (Barbosa et al., Citation2020; Cammelli et al., Citation2019; Lairez et al., Citation2020; Schneider et al., Citation2015), laminated cards and board (Jiren et al., Citation2020), magnetic cards and board (Schuman et al., Citation2018), and a combination of paper, pencil, and eraser (without cards and sorting board) (Weldegiorgis and Ali, Citation2016). Three studies (Huaranca et al., 2019; Kopytko and Pruneddu, Citation2018; Rust, Citation2017) did not (partially) use any of these kinds of materials because of the use of online platforms. Materials such as mere paper and/or cardboard can result in damaged instruments if sorting is conducted outdoors during drizzling periods, and too lightweight materials could be compromised in the case of winds, becoming an additional burden to the respondent. The selection of adequate materials can help researchers cope with these unforeseen conditions; thus, these logistical issues should not be underestimated. Jiren et al. (Citation2020) and Schuman et al., (Citation2018) are good examples of the proper management of materials that facilitate interaction between researchers and respondents. The former used laminated cards, thereby becoming waterproof and highly durable throughout the field journeys. Furthermore, it implemented a system of hook and loop fasteners, hence being windproof and rendering it prone to be used vertically (coping with lack of flat horizontal space). Finally, the board was designed in a foldable layout, thus becoming more portable, in a (seemingly) waterproof material. The latter provided similar benefits through magnetic materials, although these could be more costly and scarce in certain (rural) settings.
3.4.2. Administration technique
Most of the selected studies were conducted face to face. Of these, 15 were done individually with each respondent (Anderson and Jacobson, Citation2018; Barbosa et al., Citation2020; Cammelli et al., Citation2019; Forouzani et al., 2013; Hu et al., Citation2018; Jiren et al., Citation2020; Nguyen et al., Citation2018; Nhem and Lee, Citation2020; Nhem and Lee, Citation2019; Rijneveld and Marhaento, Citation2020; Rodríguez-Piñeros et al., Citation2018; Stoudmann et al., 2017; Truong et al., Citation2017; Zabala et al., Citation2017; Zobeidi et al., Citation2016), thereby being more time-consuming for the research teams. For this reason, studies (Nguyen et al., Citation2018; Nordhagen et al., Citation2017), and (Carmenta et al., 2017), with 92, 137, and 219 effective respondents, respectively, became impressive cases of collected sorts for this type of study. In contrast, studies (Mayett-Moreno et al., Citation2017; Pirard et al., Citation2016), and (Vargas et al., Citation2019) were collectively conducted during a 16-person community meeting, in rounds of three people simultaneously, and in a 39-person deliberative workshop, respectively. Considering that (Vargas et al., Citation2019) poses an exceptional setup for RGS contexts, it would have been interesting to understand how it was executed; unfortunately, the authors did not provide any details on the process or locations. In addition, it is worth recalling whether Q is administered individually or collectively can influence the results (Buil et al., Citation2012). Since it is intended to capture personal viewpoints, undesired group opinions—especially when involving dominant individuals and/or in collectivistic cultures—could steer some respondents’ own perspectives (Stone et al., Citation2017).
Online-administered Q is an acceptable alternative to its face-to-face version (Watts & Stenner, Citation2012). Some authors (Ormerod, Citation2017; Davis and Michelle, Citation2011; Westwood and Griffiths, Citation2010; Hermans et al., Citation2012; Raadgever et al., Citation2008) have successfully conducted online-administered Q sorts, although this is still a rare choice nowadays. From the selected studies, only three (Huaranca et al., 2019; Kopytko and Pruneddu, Citation2018; Rust, Citation2017) were (partially) conducted by means of online tools, namely Partnership Online Evaluation Tool with Q methodology – POETQ (University of Birmingham, Citation2010; Jeffares and Dickinson, Citation2016), Qsortware (Pruneddu, Citation2011) and SurveyMonkey (SurveyMonkey, Citation2020); none of them took place in a low-income country. Online administration at times might be the only feasible technique, for instance, when addressing an international community (Bordt, Citation2018)Footnote5 or in view of exceptional yet plausible limited-access scenarios, such as the COVID-19 global pandemic crisis (Omary et al., Citation2020). In RGS settings, the online administration of Q is certainly restricted by much more than merely the researcher’s willingness to use it. RGS dwellers worldwide face a serious lack of access to the Internet (Villapol et al., Citation2018), deeply limited access to equipment and electricity (Armey and Hosman, Citation2016), and (technological) illiteracy (Jere et al., Citation2013).
On one hand, the (digital) gap between researchers and RGS populations demands building and/or reinforcing local (Q) research capacities. On the other hand, circumstances like those of the ongoing pandemic may pose a sudden and unforeseen turn towards remote research (Omary et al., Citation2020) that renders that gap more acute and critical than ever. The way forward during the latter should not be limited to relying on local networks (e.g., NGOs, cooperatives, village development centers, extension officers) as a way to bridge the gap. The crisis must foster the development of innovative, open-source tools to make Q more accessible and with fewer shortcomings, especially under the light of an increasing access to and use of mobile phones in the Global South (Loo and Ngan, Citation2012).
3.4.3. Assistance and facilitation
Q is an assistance-intensive technique; therefore, for RGS dwellers who might bear further cultural- and literacy-related constraints (Roser and Ortiz-Ospina, Citation2018), appropriate facilitation is crucial. Most of the selected studies relied on pre-sort instructions (i.e., explanation of the purpose and whole process) (Anderson and Jacobson, Citation2018; Giannichi et al., Citation2018; Hamadou et al., Citation2016; Jiren et al., Citation2020; Moros et al., Citation2020; Nguyen et al., Citation2018; Nhem and Lee, Citation2020; Pirard et al., Citation2016; Schuman et al., Citation2018; Sumberg et al., Citation2017; Truong et al., Citation2017; Truong et al., Citation2019; Vela-Almeida et al., Citation2018; Weldegiorgis and Ali, Citation2016; Wijaya and Offermans, Citation2019; Yeboah et al., 2017), normally accompanied by step-by-step oral guidance (Alexander et al., Citation2018; Bumbudsanpharoke et al., Citation2009; Cammelli et al., Citation2019; Frate and Brannstrom, Citation2015; Jaung et al., Citation2016; Lairez et al., Citation2020; Moros et al., Citation2020; Nhem and Lee, Citation2020; Nhem and Lee, Citation2019; Nordhagen et al., Citation2017; Sumberg et al., Citation2017; Tuokuu et al., Citation2019; Wijaya and Offermans, Citation2019; Yeboah et al., 2017; Zobeidi et al., Citation2016). Other complementary, more time-consuming activities were reading of (almost) every statement by the research team (Cammelli et al., Citation2019; Carmenta et al., 2017; Lairez et al., Citation2020; Nordhagen et al., Citation2017; Wijaya and Offermans, Citation2019), especially because of low levels of literacy and on-demand iterative clarification of statements (Alexander et al., Citation2018; Astari and Lovett, Citation2019; Lairez et al., Citation2020; Moros et al., Citation2020; Pirard et al., Citation2016; Sumberg et al., Citation2017; Wijaya and Offermans, Citation2019; Yeboah et al., 2017). In-depth explanations and interactions may smoothen the sorting process and reduce the risk of participants misunderstanding instructions and misinterpreting statements; however, this may also increase sorting times and interviewer bias, which can seriously affect the respondents’ engagement and validity of the findings. Moreover, the status of the researchers (i.e., origin, gender, age, etc.) may provoke unexpected behavior from participants; in these cases, proper selection, training, and supervision of (local) assistants is highly advisable (Buil et al., Citation2012).
When researchers are not (native) speakers of the P-set language(s), as it occurred with 20% (n = 10) of the selected studies (Anderson and Jacobson, Citation2018; Brannstrom, Citation2011; Bumbudsanpharoke et al., Citation2009; Hilhorst et al., Citation2012; Hugé et al., Citation2016; Kopytko and Pruneddu, Citation2018; Lansing, Citation2013; Nguyen et al., Citation2018; Nordhagen et al., Citation2017; Rodriguez-Piñeros et al., Citation2012)Footnote6, they will likely rely on translators and interpreters. In this case, particular emphasis should be placed on biases beyond the mere accuracy of the terms in statements. Interpreters and assistants must first thoroughly understand the dynamics of the methodology and the topic under investigation, so they can provide a more accurate explanation to participants (Cheema et al., Citation2018). Similarly, they must be aware of not influencing the respondents’ sorts with their own opinions while facilitating. This potential limitation again links to discussing the need to build (Q) research capacities in the local contexts of the Global South. By intensively involving local scholars, universities, and institutes, these studies could be conducted by relying on native speakers and will also empower those who can better understand the demands of their local realities.
Online-administered studies (Huaranca et al., 2019; Kopytko and Pruneddu, Citation2018; Rust, Citation2017) do not allow—nor should require—face-to-face facilitation. Their respective platforms give the participant the chance to read written instructions as many times as needed to understand the required dynamics. Three main downsides are that they require participants to have access to the required equipment, demand a certain degree of (ICT) literacy, and entirely rely on each respondent’s interpretation of the provided statements.
Sorting a set of statements holistically through a (relatively) large grid can be a daunting and cumbersome process, especially if respondents are not vastly knowledgeable on the topic under study. The so-called three-pile technique is a popular way among researchers to cope with this burden (Watts & Stenner, Citation2012). It consists of a primary rough sorting in which the participant distributes all statements based on three criteria: agree, neutral, and disagree. This preliminary rough sort is thereafter refined by positioning the statements to the sorting grid. From the selected studies, 48% (n = 24) (Alexander et al., Citation2018; Astari and Lovett, Citation2019; Barbosa et al., Citation2020; Cammelli et al., Citation2019; Forouzani et al., 2013; Hamadou et al., Citation2016; Jaung et al., Citation2016; Jiren et al., Citation2020; Kopytko and Pruneddu, Citation2018; Lairez et al., Citation2020; Moros et al., Citation2020; Nhem and Lee, Citation2020; Nhem and Lee, Citation2019; Nordhagen et al., Citation2017; Rodríguez-Piñeros et al., Citation2018; Stoudmann et al., 2017; Sumberg et al., Citation2017; Truong et al., Citation2017; Truong et al., Citation2019; Tuokuu et al., Citation2019; Wijaya and Offermans, Citation2019; Yeboah et al., 2017; Zabala et al., Citation2017; Zobeidi et al., Citation2016) resorted to this technique. Jaung et al. (Citation2016) implemented an interesting two-step modification, where participants sequentially sorted into three and nine sub-piles (three per each first pile), thus enabling a smoother transition to the final grid distribution.
3.4.4. Sorting times
Required sorting times across the selected studies were reported to be as low as 25 min (Brannstrom, Citation2011), and as high as 1.5 h (Frate and Brannstrom, Citation2015; Pereira et al., Citation2016) and (up to) 3.0 h (Hu et al., Citation2018) (). Considering that these times are highly interrelated with the Q-set size, we can define a sorting time ratio expressed in seconds (s) per statement (st). These ratios varied from approximately 58 s st−1 (45) to 225 s st-1 (Alexander et al., Citation2018), although most ratios were concentrated around 100 s st−1 (). A third variable that influences the time required for sorting, which is usually overlooked in Q studies, is the number of sorting points throughout the grid. Larger Q-sets, distributed over a wider range of sorting choices, naturally take respondents longer times than otherwise. Accounting for this third variable, we define another ratio as the required time in seconds (s) per statement (st) per sorting point (sp). Most of the selected studies were within ratios of <10 s st−1 sp−1 (Anderson and Jacobson, Citation2018; Brannstrom, Citation2011; Nhem and Lee, Citation2019) and 10–20 s st−1 sp−1. Giannichi et al., (Citation2018), Moros et al., (Citation2020), Pereira et al., (Citation2016), Pirard et al., (Citation2016), Schneider et al., (Citation2015), Truong et al., (Citation2017), Truong et al., (Citation2019), Yeboah et al., (2017) (); others had higher ratios of >20 s st−1 sp−1 (Cammelli et al., Citation2019; Frate and Brannstrom, Citation2015; Hu et al., Citation2018; Zobeidi et al., Citation2016), and even an exceptionally high ratio of 32 s st−1 sp−1 (Alexander et al., Citation2018).
Figure 8. Sorting times across the selected studies. (a) Absolute sorting time in minutes. (b) Sorting time ratio, expressed in seconds per statement. (c) Sorting time ratio, expressed in seconds per statement per sorting points.
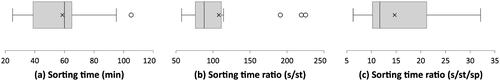
Only Truong et al., (Citation2017) elaborated on the consequences of (too) long sorting times hampering the Q process. Regarding the high ratios of (Alexander et al., Citation2018; Cammelli et al., Citation2019), they found their origins in the reported illiteracy conditions of their respective respondents. Other unexplained yet salient time-related facts from certain studies are worth remarking. Although Alexander et al., (Citation2018) presented the smallest Q-set, presented in the form of pictures instead of written statements, it counterintuitively resulted in the highest sorting time ratios. Its images could facilitate the sorting flow yet could also turn into subjective instruments that perhaps demanded more extended interpretation and discussion times. In contrast, although Nhem and Lee, (Citation2019) had a large Q-set that had to be additionally sorted vertically (concerning the strength of feeling of each statement within a given sorting point), it turned into barely 6 s st−1 sp−1, the lowest reported ratio.
Except for Yeboah et al., (2017), none of the studies with the largest Q-sets (>50 statements) (Astari and Lovett, Citation2019; Carmenta et al., 2017; Forouzani et al., 2013; Huaranca et al., 2019; Stoudmann et al., 2017) indicated sorting times. From these, two particularly interesting cases to analyze would have been (Huaranca et al., 2019), which presented 68 lengthy written statements, and (Carmenta et al., 2017) which asked each respondent to sort two 30- and 40-statement Q-sets in a single sitting.
3.4.5. Complementary information
To provide Q studies with an accurate and holistic interpretation of viewpoints, authors normally collect qualitatively rich complementary information (e.g., sociodemographic data, reasoning on sorting, etc.) (Watts & Stenner, Citation2012; Zabala et al., Citation2018). The most commonly used technique is the post-sorting interview about the placement of the (most extreme) elements and related topics (Alexander et al., Citation2018; Anderson and Jacobson, Citation2018; Barbosa et al., Citation2020; Brannstrom, Citation2011; Bumbudsanpharoke et al., Citation2009; Cammelli et al., Citation2019; Carmenta et al., 2017; Forouzani et al., 2013; Frate and Brannstrom, Citation2015; Giannichi et al., Citation2018; Hamadou et al., Citation2016; Hilhorst et al., Citation2012; Huaranca et al., 2019; Hugé et al., Citation2016; Jaung et al., Citation2016; Jiren et al., Citation2020; Kopytko and Pruneddu, Citation2018; Lairez et al., Citation2020; Leite et al., Citation2019; Mayett-Moreno et al., Citation2017; Moros et al., Citation2020; Nguyen et al., Citation2018; Nhem and Lee, Citation2020; Nhem and Lee, Citation2019; Nordhagen et al., Citation2017; Pereira et al., Citation2016; Pirard et al., Citation2016; Rijneveld and Marhaento, Citation2020; Rodriguez-Piñeros et al., Citation2012; Rodríguez-Piñeros et al., Citation2018; Rodríguez-Piñeros and Mayett-Moreno, Citation2015; Rust, Citation2017; Schneider et al., Citation2015; Stoudmann et al., 2017; Sumberg et al., Citation2017; Taheri et al., Citation2020; Truong et al., Citation2017; Truong et al., Citation2019; Tuokuu et al., Citation2019; Vargas et al., Citation2019; Vela-Almeida et al., Citation2018; Weldegiorgis and Ali, Citation2016; Wijaya and Offermans, Citation2019; Yeboah et al., 2017), as well as its collective variant in the form of focus group discussions (Weldegiorgis and Ali, Citation2016; Wijaya and Offermans, Citation2019). Other less common techniques include in-sorting interviews (about clarifying and sorting statements) (Astari and Lovett, Citation2019; Hu et al., Citation2018; Nguyen et al., Citation2018), pre-sorting interviews (Giannichi et al., Citation2018; Schneider et al., Citation2015), sociodemographic surveys (Sumberg et al., Citation2017; Zobeidi et al., Citation2016), and secondary information from prior interviews (Schuman et al., Citation2018). It is worth noting that according to (Truong et al., Citation2017), (too) long sorting times led participants to provide poor-quality complementary information during exit interviews.
3.4.6. Data recording
Q studies require adequate data recording of both the sort itself and any other information that contributes to the interpretation (Watts & Stenner, Citation2012). Less than half of the selected studies (n = 19) provided relevant information. Most of them used any form of (audio) recording for interviews (Alexander et al., Citation2018; Anderson and Jacobson, Citation2018; Cammelli et al., Citation2019; Giannichi et al., Citation2018; Hu et al., Citation2018; Jiren et al., Citation2020; Pereira et al., Citation2016; Schuman et al., Citation2018; Truong et al., Citation2019; Vela-Almeida et al., Citation2018), answer sheets for recording the sorts (Bumbudsanpharoke et al., Citation2009; Nhem and Lee, Citation2020; Nhem and Lee, Citation2019; Weldegiorgis and Ali, Citation2016; Zobeidi et al., Citation2016) and written notes (Cammelli et al., Citation2019; Jiren et al., Citation2020; Sumberg et al., Citation2017; Yeboah et al., 2017). Less reported techniques include photos of sorts (Alexander et al., Citation2018), structured questionnaires (Nhem and Lee, Citation2020), and even a unique approach of collecting notes written by the participants themselves (Rodríguez-Piñeros et al., Citation2018). Regarding web-based Q studies (Huaranca et al., 2019; Kopytko and Pruneddu, Citation2018; Rust, Citation2017), their respective platforms offered their own data-recording methods. Moreover, these studies did not limit the application of other online methods such as email-based follow-up interviews (Kopytko and Pruneddu, Citation2018).
Means of recording could be more restricted, in both quality and quantity, in RGS settings. Although none of the studies pointed out any related limitations, it makes sense to resort to methods that fulfil certain context-friendly properties: portable and lightweight, particularly for journeys between remote areas with low accessibility; elements-resistant, so rain, dust, heat, and humidity do not compromise recorded data; off-the-grid operation, either through long-life batteries for electronic equipment and/or by using non-electronic media. Moreover, a good strategy for reducing the risk of on-field data loss is to rely on several complementary and redundant recording methods.
3.5. Analysis and results
As this Q research stage typically does not imply on-field methodological choices, the respective findings can be found in Appendix C of the Data availability statement.
3.6. Interpretation
Given the subjectivity that interpreting viewpoints entails, and the particularities of each of the selected studies, the contents of the interpretations themselves were not considered within the scope of this review. Nevertheless, some commonalities can be identified regarding the labelling and framing of the interpreted factors. Although labelling is not a mandatory step in Q, it is certainly a common practice among Q methodologists. These labels are intended to deliver, in a nutshell, what characterizes each viewpoint and makes it unique compared to one another (Donner, Citation2001; Simons, Citation2013; Watts & Stenner, Citation2012). Because these labels depend mostly on the creativity of the researchers, there are virtually endless options to define them; however, some approaches are recognizable. Some labels assign behavioral characteristics to respondents, whereas others focus on defining a given situation or even providing a short explanation of certain positions.
Most of the selected studies relied on labels for societal scenarios, either in their compact (n = 17) (Barbosa et al., Citation2020; Brannstrom, Citation2011; Huaranca et al., 2019; Jiren et al., Citation2020; Kopytko and Pruneddu, Citation2018; Leite et al., Citation2019; Mayett-Moreno et al., Citation2017; Moros et al., Citation2020; Nhem and Lee, Citation2020; Nhem and Lee, Citation2019; Rodriguez-Piñeros et al., Citation2012; Stoudmann et al., 2017; Truong et al., Citation2017; Truong et al., Citation2019; Tuokuu et al., Citation2019; Vargas et al., Citation2019; Vela-Almeida et al., Citation2018) or longer forms (n = 12) (Alexander et al., Citation2018; Astari and Lovett, Citation2019; Cammelli et al., Citation2019; Carmenta et al., 2017; Frate and Brannstrom, Citation2015; Hugé et al., Citation2016; Jaung et al., Citation2016; Rodríguez-Piñeros et al., Citation2018; Rodríguez-Piñeros and Mayett-Moreno, Citation2015; Sumberg et al., Citation2017; Weldegiorgis and Ali, Citation2016; Yeboah et al., 2017), behavioral adjectives (n = 11) (Bumbudsanpharoke et al., Citation2009; Giannichi et al., Citation2018; Hamadou et al., Citation2016; Hu et al., Citation2018; Lansing, Citation2013; Nordhagen et al., Citation2017; Pereira et al., Citation2016; Schneider et al., Citation2015; Taheri et al., Citation2020; Wijaya and Offermans, Citation2019; Zabala et al., Citation2017), or their combinations (n = 4) (Lairez et al., Citation2020; Pirard et al., Citation2016; Schuman et al., Citation2018; Zobeidi et al., Citation2016). Few authors resorted to longer, descriptive versions of behavioral adjectives (n = 1) (Forouzani et al., 2013) and explanatory labels (n = 1) (Anderson and Jacobson, Citation2018). Other studies (n = 4) (Hilhorst et al., Citation2012; Nguyen et al., Citation2018; Rijneveld and Marhaento, Citation2020; Rust, Citation2017) reported the use of generic nameless labels, distinguished by the use of numbers or letters.
Interpreted factors should ideally be validated through ulterior interaction with respondents. By iteratively providing participants with draft interpretations, they can offer further feedback that contributes to refining the narratives (Robbins and Krueger, Citation2000; Robbins, Citation2005). This appears to have been amply overlooked (or underreported) in Q studies. Of the selected studies, only four (Brannstrom, Citation2011; Kopytko and Pruneddu, Citation2018; Lansing, Citation2013; Schuman et al., Citation2018) mentioned that they had resorted to this technique. Regarding RGS settings, where even one-time (sorting) contact with respondents could already be limited, validation seems to become a less likely choice. Under such circumstances, an alternative could be to validate the narratives with at least the highest loaded respondents for each factor (Kopytko and Pruneddu, Citation2018; Lansing, Citation2013).
3.7. Challenges and the way forward
By reviewing and analyzing the 50 selected studies, we have seen the potential of Q in unraveling diverse narratives on different forms of RGS livelihoods. We have seen its application across topics related to decision-making in smallholder farming systems, conflicts between environmental governance and RGS livelihoods, conflicts of mining projects and RGS populations, environmental management and conservation, conditions of refugees in humanitarian crisis contexts, among others. At the same time, we have evidenced that deploying Q in RGS settings is a planning-, time-, and facilitation-intensive process (Previte et al., Citation2007; Simons, Citation2013; Stone et al., Citation2017; Ho, Citation2017). The first two stages of Q, namely research design and data collection, are the ones requiring interactions between researcher and the (RGS) participant; hence, the ones that concentrate most of the identified methodological challenges (). As such, during its implementation in the RGS—particularly in low-income settings—along with its (non)human-dependent constraints, it will almost certainly result in limitations and improvisations. Paradoxically, most of the Q scientific literature keeps looping on the portion that has already been exhaustively reported: analysis and interpretation (Dziopa and Ahern, Citation2011; Zabala and Pascual, Citation2016; Watts and Stenner, Citation2007). From the selected studies, only four (Hugé et al., Citation2016; Schneider et al., Citation2015; Truong et al., Citation2017; Weldegiorgis and Ali, Citation2016) critically elaborated on on-field methodological issues. An unawareness of these challenges could undermine the successful implementation of Q with RGS dwellers.
Table 3. Summary of discussed challenges due to the implementation of Q in RGS settings and respective good practices.
Most challenges across the selected studies were related to the difficulty in reaching (female) respondents, thereby possibly underrepresenting viewpoints (Anderson and Jacobson, Citation2018; Brannstrom, Citation2011; Giannichi et al., Citation2018; Kopytko and Pruneddu, Citation2018; Pereira et al., Citation2016; Rust, Citation2017; Schneider et al., Citation2015; Truong et al., Citation2019; Wijaya and Offermans, Citation2019; Yeboah et al., 2017; Zabala et al., Citation2017). This was not exclusively limited to physical/geographical unreachability, but also to social and cultural barriers that excluded at times female and other less socially connected participants. In addition, some research teams faced particular constraints due to their dependency on local third parties (e.g., NGOs, farmer associations), and thus lack of on-field autonomy, to reach the desired P-set (Schneider et al., Citation2015).
Other authors (Alexander et al., Citation2018; Cammelli et al., Citation2019; Hamadou et al., Citation2016; Hugé et al., Citation2016; Nordhagen et al., Citation2017) reported illiteracy, semi-literacy, and low education as limiting factors in conducting sorting sessions more successfully. Such limitations likely lead to (too) long sorting interactions, which in turn could lead to a number of challenges. These include post-sorting time restrictions for researchers (Barbosa et al., Citation2020), thereby compromising the quality of collected complementary data (Truong et al., Citation2017); response biases due to short, not-well-thought sorts (Jaung et al., Citation2016; Truong et al., Citation2017); decrease in the level of engagement of respondents (Brannstrom, Citation2011; Schneider et al., Citation2015; Truong et al., Citation2017; Truong et al., Citation2019); and even ultimately drop-out problems (Cammelli et al., Citation2019; Vargas et al., Citation2019; Zabala et al., Citation2017). These potential limitations become much more salient when focusing on sub-Saharan Africa and South Asia, the regions with the highest illiteracy rates among adults worldwide (Szmigiera, Citation2015; Roser and Ortiz-Ospina, Citation2018).
Another identified issue was the lack of methodological clarity of the administered Q, which evolved towards inaccurate or invalid responses. For instance, Truong et al. (Citation2017) and Truong et al., (Citation2019) pointed out that some participants could not follow sorting instructions and at times found statements too complicated or contradictory, whereas Hugé et al., (Citation2016) and Weldegiorgis and Ali, (Citation2016) reported that some respondents who were uncomfortable with the forced distribution tended to sort out of the grid. Perhaps these difficulties become more understandable if Q is compared with other more familiar, more economical, and easier-to-administer attitudinal measuring instruments, such as the Likert scale (Ho, Citation2017; ten Klooster et al., Citation2008). Linguistic problems, such as different degrees of fluency in both researchers and participants (Pirard et al., Citation2016), as well as mismatches and misunderstandings in provided terms and wordings (Stoudmann et al., 2017), might aggravate this methodological obscurity.
Based on the selected documents, we also identified and discussed several good practices that could help in coping with the issues mentioned above (). Researchers can immediately adopt and implement these practices. For example, the design of an appropriate sorting grid is a costless and quicker process with substantial positive impacts. Other measures, however, demand longer participation and commitment of many more actors (e.g., Q capacity building in the Global South and development of more compatible Q electronic platforms). Moreover, the implementation of identified good practices must sometimes undergo trade-off decisions; for instance, complex translations and piloting of statements are not ideal when time and financial restrictions condition the study.
Beyond the discussed challenges, it is worth noting that (Nordhagen et al., Citation2017; Schneider et al., Citation2015) argued that their participants found Q an original and engaging technique. This is consistent with (Stone et al., Citation2017; ten Klooster et al., Citation2008), whose (non RGS) P-set enjoyed sorting, and even deemed Q ‘a welcome change to the usual research practices’. Other selected studies (Barbosa et al., Citation2020; Cammelli et al., Citation2019; Hilhorst et al., Citation2012; Truong et al., Citation2017) framed it to their respondents, perhaps intentionally, as a game rather than a survey method. Perhaps these perceptions and strategies are yet to be exploited to reduce the burden on participants.
Finally, although no single study reported any ethical conflicts of Q with cultural values, it also appears as an overlooked topic among researchers. Only (Kopytko and Pruneddu, Citation2018; Leite et al., Citation2019; Stoudmann et al., 2017; Truong et al., Citation2017; Truong et al., Citation2019) scantily touched upon the clearance and compliance with ethical standards. Nonetheless, this might represent just the tip of a much more complex (cross-)cultural iceberg [for example, the multi-cultural mining conflicts in the Ecuadorian Amazon reported in (Vela-Almeida et al., Citation2018)]. This could be the result of a (still) too Eurocentric, culture-insensitive way of conducting Q research (Stone et al., Citation2017). For example, it should call our attention when (Laney and Turner, Citation2015) points out that they gave up on using Q in northeast Madagascar after some villagers perceived it as a form of sorcery. Perhaps more subtle forms of cultural conflict occur in the RGS, and the research community is simply not aware of it (or does not document it). Another instance is the rising and mismanagement of RGS dwellers’ (monetary) expectations, especially after exposing them to recurrent and sustained interventions by (non)academic organizations (Cheema et al., Citation2018). Unfortunately, the data gathered here has not allowed us to elaborate much more in-depth on these topics, yet certainly is a way worth exploring.
4. Concluding remarks
Q can be considered as a flexible, innovative, and powerful technique for assessing differences in viewpoints across groups. Through the analysis of the selected studies, we have observed its strong potential to better understand the dynamics of the RGS livelihoods beyond oversimplified and stereotypical narratives (i.e., mere economic considerations). Hence, it can become a valuable tool to support context-sensitive and sustainable development interventions. At the same time, conducting Q studies in RGS settings may pose particular onsite methodological challenges and limitations. These, unless properly addressed in the planning and execution, may hamper Q’s effectiveness in revealing discourses on RGS livelihoods that are faithful to respondents’ perceptions and opinions. Such inaccurate and distorted discourses may eventually lead to flawed decisions and actions. As a response, in this review we have highlighted good Q methodological practices whereby researchers could cope with those challenges and limitations, thereby ensuring a better comprehension of the discourses emerging from the studied phenomenon (e.g., RGS livelihoods). We encourage Q researchers, particularly those engaging with RGS studies, to implement the strategies presented here.
Notwithstanding limitations and good practices, we advocate the construction of robust Q capacities and the gender-balanced empowerment of local researchers, along with the indispensable provision/production of open access and inclusive scientific knowledge, data, and tools. These efforts may contribute to closing geographical, social, and cultural gaps, such as the ones we have analyzed throughout the present work.
Authors contributions
Supplemental Material
Download Zip (594.4 KB)Acknowledgements
We express our gratitude to Zabala et al., (Citation2018), whose work inspired the framing of this article.
Disclosure statement
No potential conflict of interest was reported by the author(s).
Data availability statement
The dataset related to this study can be found at https://doi.org/10.34894/K252KB, an open-source online data repository hosted at DataverseNL (Intriago Zambrano, Citation2020).
Additional information
Funding
Notes on contributors
Juan Carlo Intriago Zambrano
Juan Carlo Intriago Zambrano is pursuing a PhD degree at the Water Resources department at Delft University of Technology, the Netherlands. He holds an MSc degree in Urban Environmental Management from Wageningen University, and a BArch degree from the University San Gregorio de Portoviejo. His scholar interests span across (agricultural) technological innovations in the Global South, as well as trans-disciplinary, multi-cultural studies with a gender approach. He is fond of bottom-up, participatory research methods like Q methodology.
Jan Carel Diehl
Jan Carel Diehl is professor in Design for Inclusive Sustainable Healthcare at the Faculty of Industrial Design Engineering of Delft University of Technology and Medical Delta Professor at Erasmus Medical Center in Rotterdam. He received his MSc degree and PhD in Design for Sustainability from Delft University of Technology. He is steering board member of the Delft Global Initiative and part of the LDE Center for Frugal Innovation in Africa. His general aim is to develop design tools and methods to create inclusive and sustainable product (service) systems solutions.
Maurits W. Ertsen
Maurits W. Ertsen is Associate Professor in the Water Resources department at Delft University of Technology, the Netherlands. He holds a PhD degree from DUT and an MSc degree from Wageningen University. He studies how longer-term water practices emerge from short-term actions of human and non-human agents in current, historical, and archaeological periods in places ranging from Peru to the Near East, in close cooperation with universities, NGO’s, and the private sector.
Notes
1 In this document, the Global South comprises low- and middle-income countries, as classified by the United Nations (142).
2 According to the classifications of journals of Ulrichsweb™ Global Serials Directory (http://ulrichsweb.serialssolutions.com/); in cases of journals bearing more than one discipline, the more representative was assigned to the respective document.
3 We do realize that our own research endeavors can be labelled in similar terms. In itself, we would argue that involvement of researchers from the GN in itself is not necessarily to be avoided – but we do argue that the balance of research power between GN and GS is in need of correction, including the labelling of GN and GS itself.
4 Barbosa et al. (Citation2020) was not accounted due to its exclusivity of female participants.
5 The author gave up the option of Q due to lack of feasible web-based alternatives.
6 Assumed after the authors’ countries of affiliations and language employed during the studies.
References
- Akter, S., Rutsaert, P., Luis, J., Htwe, N. M., San, S. S., Raharjo, B., & Pustika, A. (2017). Women’s empowerment and gender equity in agriculture: A different perspective from Southeast Asia. Food Policy, 69, 1–37. https://doi.org/10.1016/j.foodpol.2017.05.003
- Alexander, K. S., Parry, L., Thammavong, P., Sacklokham, S., Pasouvang, S., Connell, J. G., Jovanovic, T., Moglia, M., Larson, S., & Case, P. (2018). Rice farming systems in Southern Lao PDR: Interpreting farmers’ agricultural production decisions using Q methodology. Agricultural Systems, 160, 1–10. https://doi.org/10.1016/j.agsy.2017.10.018
- Anderson, C., & Jacobson, S. (2018). Barriers to environmental education: How do teachers’ perceptions in rural Ecuador fit into a global analysis? Environmental Education Research, 24(12), 1684–1696. https://doi.org/10.1080/13504622.2018.1477120
- Armey, L. E., & Hosman, L. (2016). The centrality of electricity to ICT use in low-income countries. Telecomm Policy, 40(7), 617–627. https://doi.org/10.1016/j.telpol.2015.08.005
- Arunachalam, S. (2017). Social justice in scholarly publishing: Open access is the only way. The American Journal of Bioethics, 17(10), 15–17. https://doi.org/10.1080/15265161.2017.1366194
- Ascher, W. (2021). Coping with intelligence deficits in poverty-alleviation policies in low-income countries. Policy Sciences, 54(2), 345–370. https://doi.org/10.1007/s11077-020-09412-0
- Astari, A. J., & Lovett, J. C. (2019). Does the rise of transnational governance ‘hollow-out’ the state? Discourse analysis of the mandatory Indonesian sustainable palm oil policy. World Development, 117, 1–12. https://doi.org/10.1016/j.worlddev.2018.12.012
- Barbosa, R. A., Domingues, C. H. d F., Silva, M. C. d., Foguesatto, C. R., Pereira, M. d A., Gimenes, R. M. T., & Borges, J. A. R. (2020). Using Q-methodology to identify rural women’s viewpoint on succession of family farms. Land Use Policy, 92, 104489. https://doi.org/10.1016/j.landusepol.2020.104489
- Bergen, B. K., & Chan Lau, T. T. (2012). Writing direction affects how people map space onto time. Frontiers in Psychology, 3, 109. https://doi.org/10.3389/fpsyg.2012.00109
- Bond, J. (2016). Extension agents and conflict narratives: A case of Laikipia County, Kenya. Journal of Agricultural Education and Extension, 22(1), 81–96. https://doi.org/10.1080/1389224X.2014.997256
- Bordt, M. (2018). Discourses in ecosystem accounting: A survey of the expert community. Ecological Economics, 144, 82–99. https://doi.org/10.1016/j.ecolecon.2017.06.032
- Brannstrom, C. (2011). A Q-method analysis of environmental governance discourses in Brazil’s Northeastern Soy Frontier. The Professional Geographer, 63(4), 531–549. https://doi.org/10.1080/00330124.2011.585081
- Breman, J. (1985). Between accumulation and immiseration: The partiality of fieldwork in rural India. Journal of Peasant Studies, 13(1), 5–36. https://doi.org/10.1080/03066158508438281
- Buil, I., de Chernatony, L., & Martínez, E. (2012). Methodological issues in cross-cultural research: An overview and recommendations. Journal of Targeting, Measurement and Analysis for Marketing, 20(3-4), 223–234. https://doi.org/10.1057/jt.2012.18
- Bumbudsanpharoke, W., Moran, D., & Hall, C. (2009). Exploring perspectives of environmental best management practices in Thai agriculture: an application of Q-methodology. Environment Conservation, 36(3), 225–234. https://www.cambridge.org/core/product/identifier/S0376892909990397/type/journal_article
- Cammelli, F., Coudel, E., & de Freitas Navegantes Alves, L. (2019). Smallholders’ perceptions of fire in the Brazilian Amazon: Exploring implications for governance arrangements. Human Ecology, 47(4), 601–612. https://doi.org/10.1007/s10745-019-00096-6
- Carmenta, R., Zabala, A., Daeli, W., & Phelps, J. (2017). Perceptions across scales of governance and the Indonesian peatland fires. Global Environmental Change, 46, 50–59. https://doi.org/10.1016/j.gloenvcha.2017.08.001
- Casale, M., Lane, T., Sello, L., Kuo, C., & Cluver, L. (2013). Conducting health survey research in a deep rural South African community: challenges and adaptive strategies. Health Research Policy and Systems, 11(1), 14. https://doi.org/10.1186/1478-4505-11-14
- Chacko, E. (2004). Positionality and Praxis: Fieldwork Experiences in rural India. Singapore Journal of Tropical Geography, 25(1), 51–63. https://doi.org/10.1111/j.0129-7619.2004.00172.x
- Chambers, R. (1983). Rural development: Putting the last first (pp. 256). Routledge.
- Chambers, R. (2017). Can we know better? Reflections for development (pp. 194). Practical Action Publishing. https://www.developmentbookshelf.com/doi/book/10.3362/9781780449449
- Chan, L., Kirsop, B., & Arunachalam, S. (2005). Open access archiving: the fast track to building research capacity in developing countries. SciDevNet. Retrieved June 19, 2020, from https://www.scidev.net/global/communication/feature/open-access-archiving-the-fast-track-to-building-r.html
- Cheema, A. R., Mehmood, A., & Khan, F. A. (2018). Challenges of research in rural poverty: lessons from large field surveys. Development in Practice, 28(5), 714–719. https://doi.org/10.1080/09614524.2018.1467881
- Churruca, K., Ludlow, K., Wu, W., Gibbons, K., Nguyen, H. M., Ellis, L. A., & Braithwaite, J. (2021). A scoping review of Q-methodology in healthcare research. BMC Medical Research Methodology, 21(1), 125. https://doi.org/10.1186/s12874-021-01309-7
- Cobb, C. (2018). Answering for someone else: Proxy reports in survey research. In D. L. Vannette, & J. A. Krosnick (Eds.), The Palgrave handbook of survey research (pp. 87–93). Springer International Publishing. https://doi.org/10.1007/978-3-319-54395-6_12
- Cohen, N., & Arieli, T. (2011). Field research in conflict environments: Methodological challenges and snowball sampling. Journal of Peace Research, 48(4), 423–435. https://doi.org/10.1177/0022343311405698
- Datta, A. (2019). Rural development. In J. Midgley, R. Surender, & L. Alfers (Eds.), Handbook of social policy and development (pp. 169–187). Edward Elgar Publishing. https://www.elgaronline.com/view/edcoll/9781785368424/9781785368424.00016.xml
- Davis, C., & Michelle, C. (2011). Q methodology in audience research: Bridging the qualitative/quantitative ‘divide. Participations: Journal of Audience and Reception Studies, 8(2), 559–593. https://www.participations.org/Volume 8/Issue 2/contents.htm
- Devkota, R., Pant, L. P., Gartaula, H. N., Patel, K., Gauchan, D., Hambly-Odame, H., Thapa, B., & Raizada, M. N. (2020). Responsible agricultural mechanization innovation for the sustainable development of Nepal’s hillside farming system. Sustainability, 12(1), 374. https://doi.org/10.3390/su12010374
- Dieteren, C. M., Patty, N. J. S., Reckers-Droog, V. T., & van Exel, J. (2023). Methodological choices in applications of Q methodology: A systematic literature review. Social Sciences & Humanities Open, 7(1), 100404. https://linkinghub.elsevier.com/retrieve/pii/S2590291123000098
- Dingkuhn, E. L., Wezel, A., Bianchi, F. J. J. A., Groot, J. C. J., Wagner, A., Yap, H. T., & Schulte, R. P. O. (2020). JA multi-method approach for the integrative assessment of soil functions: Application on a coastal mountainous site of the Philippines. Journal of Environmental Management, 264, 110461. https://doi.org/10.1016/j.jenvman.2020.110461
- Donner, J. C. (2001). Using Q-sorts in participatory processes: An introduction to the methodology. In Social analysis: Selected tools and techniques. (pp. 24–49). Social Development Family of the World Bank. https://documents.worldbank.org/en/publication/documents-reports/documentdetail/568611468763498929/social-analysis-selected-tools-and-techniques
- Dryzek, J. S., & Berejikian, J. (1993). Reconstructive democratic theory. American Political Science Review, 87(1), 48–60. https://www.cambridge.org/core/product/identifier/S0003055400099068/type/journal_article https://doi.org/10.2307/2938955
- Dziopa, F., & Ahern, K. (2011). A systematic literature review of the applications of Q-technique and its methodology. Methodology, 7(2), 39–55. https://doi.org/10.1027/1614-2241/a000021
- Easdale, M. H., Pérez León, N., & Aguiar, M. R. (2020). Strains in sustainability debates: Traditional ecological knowledge and western science through the lens of extension agents in a pastoral region. Rural Sociology, 85(1), 57–84. https://doi.org/10.1111/ruso.12268
- ESSENCE on Health Research. (2014). Seven principles for strengthening research capacity in low- and middle-income countries: simple ideas in a complex world. ESSENCE Good practice document series. Report No.: TDR/ESSENCE/2.14. : https://www.who.int/tdr/publications/seven-principles/en/
- Fan, S., & Rue, C. (2020). The role of smallholder farms in a changing world. In S. Gomez y Paloma (Ed.), The role of smallholder farms in food and nutrition security (pp. 13–28). Springer International Publishing. https://doi.org/10.1007/978-3-030-42148-9_2
- Fan, S., Brzeska, J., Keyzer, M., & Halsema, A. (2013). From subsistence to profit: Transforming smallholder farms. IFPRI. http://ebrary.ifpri.org/cdm/ref/collection/p15738coll2/id/127763
- Forouzani, M., Karami, E., Zamani, G. H., & Moghaddam, K. R. (2013). Agricultural water poverty: Using Q-methodology to understand stakeholders’ perceptions. Journal of Arid Environments, 97, 190–204. https://doi.org/10.1016/j.jaridenv.2013.07.003
- Frate, C. A., & Brannstrom, C. (2015). Will Brazil’s ethanol ambitions undermine its agrarian reform goals? A study of social perspectives using Q-method. Journal of Rural Studies, 38, 89–98. https://doi.org/10.1016/j.jrurstud.2014.10.007
- Gc, R. K., & Hall, R. P. (2020). The commercialization of smallholder farming—A case study from the rural western middle Hills of Nepal. Agriculture, 10(5), 143. https://www.mdpi.com/2077-0472/10/5/143 https://doi.org/10.3390/agriculture10050143
- Giannichi, M. L., Dallimer, M., Baker, T. R., Mitchell, G., Bernasconi, P., & Ziv, G. (2018). Divergent Landowners’ expectations may hinder the uptake of a forest certificate trading scheme. Conservation Letters, 11(3), e12409. https://doi.org/10.1111/conl.12409
- Giordano, M., Barron, J., & Ünver, O. (2019). Water scarcity and challenges for smallholder agriculture. In C. Campanhola & S. Pandey (Eds.), Sustainable food and agriculture (pp. 75–94). FAO and Elsevier. https://linkinghub.elsevier.com/retrieve/pii/B9780128121344000054
- Hamadou, I., Moula, N., Siddo, S., Issa, M., Marichatou, H., Leroy, P., & Antoine-Moussiaux, N. (2016). Mapping stakeholder viewpoints in biodiversity management: an application in Niger using Q methodology. Biodiversity and Conservation, 25(10), 1973–1986. https://doi.org/10.1007/s10531-016-1175-x
- Hazell P. B. R., & Rahman A. (Eds.). (2014). New directions for smallholder agriculture (pp. 574). Oxford University Press. http://www.oxfordscholarship.com/view/10.1093/acprof:oso/9780199689347.001.0001/acprof-9780199689347
- Hermans, F., Kok, K., Beers, P. J., & Veldkamp, T. (2012). Assessing sustainability perspectives in rural innovation projects using Q-methodology. Sociologia Ruralis, 52(1), 70–91. https://doi.org/10.1111/j.1467-9523.2011.00554.x
- Hilhorst, D., Weijers, L., & van Wessel, M. (2012). Aid relations and aid legitimacy: mutual imaging of aid workers and recipients in Nepal. Third World Quarterly, 33(8), 1439–1457. https://doi.org/10.1080/01436597.2012.698126
- Ho, G. W. K. (2017). Examining perceptions and attitudes: A review of Likert-type scales versus Q-methodology. Western Journal of Nursing Research, 39(5), 674–689. https://doi.org/10.1177/0193945916661302
- Hu, Y., You, F., & Luo, Q. (2018). Characterizing the attitudes of the grain-planting farmers of Huaihe Basin, China. Food Policy, 79, 224–234. https://doi.org/10.1016/j.foodpol.2018.07.007
- Huang, C.-H., & Yu, S.-C. (2013). A study of environmental perception patterns of the visually impaired and environmental design. Indoor and Built Environment, 22(5), 743–749. : https://doi.org/10.1177/1420326X12456317
- Huaranca, L. L., Iribarnegaray, M. A., Albesa, F., Volante, J. N., Brannstrom, C., & Seghezzo, L. (2019). Land use change, and economic development in an expanding agricultural frontier in Northern Argentina. Ecological Economics, 165, 106424. https://doi.org/10.1016/j.ecolecon.2019.106424
- Hugé, J., Vande Velde, K., Benitez-Capistros, F., Japay, J. H., Satyanarayana, B., Nazrin Ishak, M., Quispe-Zuniga, M., Mohd Lokman, B. H., Sulong, I., Koedam, N., Dahdouh-Guebas, F. (2016). Mapping discourses using Q methodology in Matang Mangrove Forest, Malaysia. Journal of Environmental Management, 183, 988–997. https://linkinghub.elsevier.com/retrieve/pii/S0301479716307083
- Intriago Zambrano, J. C. (2020). Results of semi-systematic literature review on the application of Q-methodology in the rural Global South, as part of the DARE-TU PhD project. DataverseNL. Retrieved July 20, 2020. https://doi.org/10.34894/K252KB
- Intriago, J. C., Ertsen, M., Diehl, J.-C., Michavila, J., & Arenas, E. (2018). Co-creation of affordable irrigation technology: The DARE-TU project. International Conference Water Science for Impact, Wageningen, The Netherlands (pp. 1). https://repository.tudelft.nl/islandora/object/uuid%3Af512eafc-0b22-4c7f-9d3e-41d17377a88e?collection=research
- Jaung, W., Putzel, L., Bull, G. Q., & Kozak, R. (2016). Certification of forest watershed services: A Q methodology analysis of opportunities and challenges in Lombok, Indonesia. Ecosystem Services, 22, 51–59. fromhttps://linkinghub.elsevier.com/retrieve/pii/S2212041616303345
- Jeffares, S., & Dickinson, H. (2016). Evaluating collaboration: The creation of an online tool employing Q methodology. Evaluation, 22(1), 91–107. https://doi.org/10.1177/1356389015624195
- Jere, N. R., Thinyane, M., Boikhutso, T., & Ndlovu, N. (2013). An assessment of ICT challenges in rural areas: ICT experts vs rural users views. In Proceedings of the South African Institute for Computer Scientists and Information Technologists Conference on – SAICSIT ‘13 (pp. 233). ACM Press. http://dl.acm.org/citation.cfm?doid=2513456.2513496
- Jiren, T. S., Dorresteijn, I., Hanspach, J., Schultner, J., Bergsten, A., Manlosa, A., Jager, N., Senbeta, F., & Fischer, J. (2020). Alternative discourses around the governance of food security: A case study from Ethiopia. Global Food Security, 24, 100338. https://doi.org/10.1016/j.gfs.2019.100338
- Kopytko, N., & Pruneddu, A. (2018). Triple-win strategy? Why is not everyone doing it? A participant-driven research method to reveal barriers to crop rotation in Ukraine. Climatic Change, 149(2), 189–204. https://doi.org/10.1007/s10584-018-2229-8
- Lairez, J., Lopez-Ridaura, S., Jourdain, D., Falconnier, G. N., Lienhard, P., Striffler, B., Syfongxay, C., & Affholder, F. (2020). Context matters: Agronomic field monitoring and participatory research to identify criteria of farming system sustainability in South-East Asia. Agricultural Systems, 182, 102830. https://doi.org/10.1016/j.agsy.2020.102830
- Laney, R., & Turner, B. L. (2015). The persistence of self-provisioning among smallholder farmers in Northeast Madagascar. Human Ecology, 43(6), 811–826. https://doi.org/10.1007/s10745-015-9791-8
- Lang, V. F., & Lingnau, H. (2015). Defining and measuring poverty and inequality post-2015. Journal of International Development, 27(3), 399–414. https://doi.org/10.1002/jid.3084
- Lansing, D. M. (2013). Not all baselines are created equal: A Q methodology analysis of stakeholder perspectives of additionality in a carbon forestry offset project in Costa Rica. Global Environmental Change, 23(3), 654–663. https://doi.org/10.1016/j.gloenvcha.2013.02.005
- Lee, M. (2019). Non-Latin scripts in multilingual environments: research data and digital humanities in area studies”. DhDBlog – Digital Humanities im deutschsprachigem Raum. Retrieved June 16, 2020, from https://blogs.fu-berlin.de/bibliotheken/2019/01/18/workshop-nls2018/
- Leite, S. K., Vendruscolo, G. S., Renk, A. A., & Kissmann, C. (2019). Perception of farmers on landscape change in southern Brazil: Divergences and convergences related to gender and age. Journal of Rural Studies , 69, 11–18. https://doi.org/10.1016/j.jrurstud.2019.04.008
- Leong, C., & Lejano, R. (2016). Dec 3 Thick narratives and the persistence of institutions: using the Q methodology to analyse IWRM reforms around the Yellow River. Policy Sciences, 49(4), 445–465. https://doi.org/10.1007/s11077-016-9253-1
- Loo, B. P. Y., & Ngan, Y. L. (2012). Developing mobile telecommunications to narrow digital divide in developing countries? Some lessons from China. Telecomm Policy, 36(10–11), 888–900. https://doi.org/10.1016/j.telpol.2012.07.015
- Mayett-Moreno, Y., Villarraga-Flórez, L., & Rodríguez-Piñeros, S. (2017). Young farmers’ perceptions about forest management for ecotourism as an alternative for development, in Puebla, Mexico. Sustainability, 9(7), 1134. https://doi.org/10.3390/su9071134
- McKeown, B., & Thomas, D. (1988). Q methodology. Quantitative Applications in the Social Sciences. Report No.: 07–066.
- Mellor, J. W., & Malik, S. J. (2017). The impact of growth in small commercial farm productivity on rural poverty reduction. World Development, 91, 1–10. https://doi.org/10.1016/j.worlddev.2016.09.004
- Moros, L., Corbera, E., Vélez, M. A., & Flechas, D. (2020). Pragmatic conservation: Discourses of payments for ecosystem services in Colombia. Geoforum, 108, 169–183. https://doi.org/10.1016/j.geoforum.2019.09.004
- Nazariadli, S. (2020). VQMethod. OSF. Retrieved June 16, 2020, from https://osf.io/d3wh6/
- Nazariadli, S., Morais, D. B., Supak, S., Baran, P. K., & Bunds, K. S. (2019). Assessing the visual Q method online research tool: A usability, reliability, and methods agreement analysis. Methodological Innovations, 12(1), 205979911983219. http://journals.sagepub.com/doi/10.1177/2059799119832194
- Nguyen, B. N., Boruff, B., & Tonts, M. (2018). Indicators of mining in development: A Q‐methodology investigation of two gold mines in Quang Nam province, Vietnam. Resources Policy, 57, 147–155. https://linkinghub.elsevier.com/retrieve/pii/S0301420717302040
- Nhem, S., & Lee, Y. J. (2019). Using Q methodology to investigate the views of local experts on the sustainability of community-based forestry in Oddar Meanchey province, Cambodia. Forest Policy and Economics, 106, 101961. https://doi.org/10.1016/j.forpol.2019.101961
- Nhem, S., & Lee, Y. J. (2020). Exploring perspectives in assessing the quality of governance of the reducing emissions from deforestation and forest degradation (REDD+) pilot project in Cambodia: Use of Q methodology. Journal of Mountain Science, 17(1), 95–116.
- Nijnik, A., Nijnik, M., Kopiy, S., Zahvoyska, L., Sarkki, S., Kopiy, L., & Miller, D. (2017). Identifying and understanding attitudinal diversity on multi-functional changes in woodlands of the Ukrainian Carpathians. Climate Research, 73(1–2), 45–56. http://www.int-res.com/abstracts/cr/v73/n1-2/p45-56/
- Nordhagen, S., Pascual, U., & Drucker, A. G. (2017). Feeding the household, growing the business, or just showing off? Farmers’ motivations for crop diversity choices in Papua New Guinea. Ecological Economics, 137, 99–109. https://doi.org/10.1016/j.ecolecon.2017.02.025
- Nunan F., Clare B., & Sukanya K. (Eds.). The Routledge handbook on livelihoods in the global South (1st ed., pp. 525). Routledge. (2023). https://www.taylorfrancis.com/books/9781003014041
- Omary, M. B., Eswaraka, J., Kimball, S. D., Moghe, P. V., Panettieri, R. A., & Scotto, K. W. (2020). The COVID-19 pandemic and research shutdown: Staying safe and productive. The Journal of Clinical Investigation, 130(6), 2745–2748. https://doi.org/10.1172/JCI138646
- Ormerod, K. J. (2017). Common sense principles governing potable water recycling in the southwestern US: Examining subjectivity of water stewards using Q methodology. Geoforum, 86, 76–85. https://doi.org/10.1016/j.geoforum.2017.09.004
- Pereira, M. A., Fairweather, J. R., Woodford, K. B., & Nuthall, P. L. (2016). Assessing the diversity of values and goals amongst Brazilian commercial-scale progressive beef farmers using Q-methodology. Agricultural Systems, 144, 1–8. https://doi.org/10.1016/j.agsy.2016.01.004
- Pirard, R., Petit, H., Baral, H., & Achdiawan, R. (2016). Perceptions of local people toward pulpwood plantations: Insights from the Q-method in Indonesia. International Forestry Review, 18(2), 218–230. http://openurl.ingenta.com/content/xref?genre=article&issn=1465-5489&volume=18&issue=2&spage=218
- Poole, N. (2017). Smallholder agriculture and market participation (pp. 172). Practical Action Publishing; https://www.developmentbookshelf.com/doi/book/10.3362/9781780449401
- Potnis, D., & Gala, B. (2020). Best practices for conducting fieldwork with marginalized communities. Information Processing and Management, 57(3), 102144. https://doi.org/10.1016/j.ipm.2019.102144
- Previte, J., Pini, B., & Haslam-McKenzie, F. (2007). Q Methodology and rural research. Sociol Ruralis, 47(2), 135–147. https://doi.org/10.1111/j.1467-9523.2007.00433.x
- Pruneddu, A. (2011). Q-SORTWARE. Retrieved June 17, 2020, from http://www.qsortware.net/
- Raadgever, G. T., Mostert, E., & van de Giesen, N. C. (2008). Identification of stakeholder perspectives on future flood management in the Rhine basin using Q methodology. Hydrology and Earth System Sciences, 12(4), 1097–1109. https://www.hydrol-earth-syst-sci.net/12/1097/2008/
- Rijneveld, R., & Marhaento, H. (2020). Stakeholders’ contradicting perceptions on the effects of agroforestry and monocropping systems on water use. Water Practice and Technology, 15(2), 365–373. https://iwaponline.com/wpt/article/15/2/365/73146/Stakeholders-contradicting-perceptions-on-the https://doi.org/10.2166/wpt.2020.024
- Robbins, P. (2005). Q methodology. In K. Kempf-Leonard (Ed.). Encyclopedia of social measurement (pp. 209–215). Elsevier. https://linkinghub.elsevier.com/retrieve/pii/B012369398500356X
- Robbins, P., & Krueger, R. (2000). Beyond bias? The promise and limits of Q method in human geography. The Professional Geographer, 52(4), 636–648. https://doi.org/10.1111/0033-0124.00252
- Rodríguez-Piñeros, S., & Mayett-Moreno, Y. (2015). Forest owners’ perceptions of ecotourism: Integrating community values and forest conservation. Ambio, 44(2), 99–109. https://doi.org/10.1007/s13280-014-0544-5
- Rodriguez-Piñeros, S., Focht, W., Lewis, D. K., & Montgomery, D. (2012). Incorporating values into community-scale sustainable forest management plans: An application of Q methodology. Small-Scale Forestry, 11(2), 167–183. https://doi.org/10.1007/s11842-011-9182-y
- Rodríguez-Piñeros, S., Martínez-Cortés, O., Villarraga-Flórez, L., & Ruíz-Díaz, A. (2018). Timber market actors’ values on forest legislation: A case study from Colombia. Forest Policy and Economics, 88, 1–10. https://linkinghub.elsevier.com/retrieve/pii/S1389934116303185
- Roser, M., & Ortiz-Ospina, E. (2018). Literacy. Our World in Data. Retrieved Jun 18, 2020, from https://ourworldindata.org/literacy
- Roser, M., & Ortiz-Ospina, E. (2018). Literacy. Our World in Data. Retrieved November 23, 2021. https://ourworldindata.org/literacy
- Rust, N. A. (2017). Can stakeholders agree on how to reduce human–carnivore conflict on Namibian livestock farms? A novel Q-methodology and Delphi exercise. Oryx, 51(2), 339–346. https://www.cambridge.org/core/product/identifier/S0030605315001179/type/journal_article https://doi.org/10.1017/S0030605315001179
- Sadler, G. R., Lee, H.-C., Lim, R. S.-H., Fullerton, J., & Research, A. (2010). Recruitment of hard-to-reach population subgroups via adaptations of the snowball sampling strategy. Nursing & Health Sciences, 12(3), 369–374. https://doi.org/10.1111/j.1442-2018.2010.00541.x
- Salaj, I., & Kiš-Glavaš, L. (2017). Perceptions of students with disabilities regarding their role in the implementation of education policy: A Q method study. Hrvatska Revija Za Rehabilitacijska Istrazivanja, 53, 47–62.
- Schneider, C., Coudel, E., Cammelli, F., & Sablayrolles, P. (2015). Small-scale farmers’ needs to end deforestation: insights for REDD + in São Felix do Xingu (Pará, Brazil). International Forestry Review, 17(1), 124–142. http://www.ingentaconnect.com/content/10.1505/146554815814668963
- Schuman, S., Dokken, J.-V., Van Niekerk, D., & Loubser, R. A. (2018). Religious beliefs and climate change adaptation: A study of three rural South African communities. Jàmbá, 10(1), 1–12. https://jamba.org.za/index.php/jamba/article/view/509
- Serwadda, D., Ndebele, P., Grabowski, M. K., Bajunirwe, F., & Wanyenze, R. K. (2018). Open data sharing and the Global South—Who benefits? Science,. 359(6376), 642–643. https://doi.org/10.1126/science.aap8395
- Shucksmith M., & Brown D. L., (Eds.). (2016). Routledge international handbook of rural studies (pp. 697). Routledge. https://www.taylorfrancis.com/books/9781315753041
- Simons, J. (2013). An introduction to Q methodology. Nurse Researcher, 20(3), 28–32. http://web.b.ebscohost.com/ehost/pdfviewer/pdfviewer?vid=2%7B&%7Dsid=04142c8f-81ac-491e-ada6-524c41818567%7B%25%7D40sessionmgr107%7B&%7Dhid=118
- Slavchevska, V., Kaaria, S., & Taivalmaa, S. L. (2019). The feminization of agriculture. In T. Allan, B. Bromwich, M. Keulertz, & A. Colman (Eds.). The Oxford handbook of food, water and society (pp. 267–284). Oxford University Press. http://oxfordhandbooks.com/view/10.1093/oxfordhb/9780190669799.001.0001/oxfordhb-9780190669799-e-55
- Snyder, H. (2019). Literature review as a research methodology: An overview and guidelines. Journal of Business Research, 104, 333–339. https://doi.org/10.1016/j.jbusres.2019.07.039
- Stenner, P., Watts, S., & Worrell, M. (2017). Q Methodology. In C. Willig, W. Stainton-Rogers (Eds.), The SAGE handbook of qualitative research in psychology (2nd ed., pp. 212–237). SAGE. https://books.google.nl/books?id=AAniDgAAQBAJ
- Stone, T. E., Maguire, J., Kang, S. J., & Cha, C. (2017). Practical issues of conducting a Q methodology study: Lessons learned from a cross-cultural study. Advances in Nursing Science, 40(3), 291–299. http://journals.lww.com/00012272-201707000-00006 https://doi.org/10.1097/ANS.0000000000000164
- Stoudmann, N., Waeber, P. O., Randriamalala, I. H., & Garcia, C. (2017). Perception of change: Narratives and strategies of farmers in Madagascar. Journal of Rural Studies, 56, 76–86. https://doi.org/10.1016/j.jrurstud.2017.09.001
- Strijker, D., Bosworth, G., & Bouter, G. (2020). Research methods in rural studies: Qualitative, quantitative and mixed methods. Journal of Rural Studies, 78, 262–270. https://doi.org/10.1016/j.jrurstud.2020.06.007
- Sumberg, J., Yeboah, T., Flynn, J., & Anyidoho, N. A. (2017). Young people’s perspectives on farming in Ghana: a Q study. Food Security, 9(1), 151–161. https://doi.org/10.1007/s12571-016-0646-y
- SurveyMonkey. (2020). SurveyMonkey. Retrieved June 17, 2020, from https://surveymonkey.com/
- Szmigiera, M. (2015). The illiteracy rate among all adults (over 15-year-old) in 2019, by world region. Statista. Retrieved November 23, 2021. https://www.statista.com/statistics/262886/illiteracy-rates-by-world-regions/
- Taheri, F., Forouzani, M., Yazdanpanah, M., & Ajili, A. (2020). How farmers perceive the impact of dust phenomenon on agricultural production activities: A Q-methodology study. Journal of Arid Environments, 173, 104028. https://doi.org/10.1016/j.jaridenv.2019.104028
- Tambe, S. (2022). SDGs and continued relevance of rural livelihoods. In Teaching and learning rural livelihoods: A guide for educators, students, and practitioners (1st ed.). Springer Cham. p. 29–42. https://doi.org/10.1007/978-3-030-90491-3_3
- ten Klooster, P. M., Visser, M., & de Jong, M. D. T. (2008). Comparing two image research instruments: The Q-sort method versus the Likert attitude questionnaire. Food Quality and Preference, 19(5), 511–518. https://linkinghub.elsevier.com/retrieve/pii/S0950329308000360
- Theis, S., Lefore, N., Meinzen-Dick, R., & Bryan, E. (2018). What happens after technology adoption? Gendered aspects of small-scale irrigation technologies in Ethiopia, Ghana, and Tanzania. Agriculture and Human Values, 35(3), 671–684. https://doi.org/10.1007/s10460-018-9862-8
- Truong, D. B., Binot, A., Peyre, M., Nguyen, N. H., Bertagnoli, S., & Goutard, F. L. (2017). A Q method approach to evaluating farmers’ perceptions of foot-and-mouth disease vaccination in Vietnam. Frontiers in Veterinary Science, 4, 95. http://journal.frontiersin.org/article/10.3389/fvets.2017.00095/full https://doi.org/10.3389/fvets.2017.00095
- Truong, D. B., Doan, H. P., Doan Tran, V. K., Nguyen, V. C., Bach, T. K., Rueanghiran, C., Binot, A., Goutard, F. L., Thwaites, G., Carrique-Mas, J., & Rushton, J. (2019). Assessment of drivers of antimicrobial usage in poultry farms in the Mekong delta of Vietnam: A combined participatory epidemiology and Q-sorting approach. Frontiers in Veterinary Science, 6, 84. https://www.frontiersin.org/article/10.3389/fvets.2019.00084/full https://doi.org/10.3389/fvets.2019.00084
- Tuokuu, F. X. D., Idemudia, U., Gruber, J. S., & Kayira, J. (2019). Linking stakeholder perspectives for environmental policy development and implementation in Ghana’s gold mining sector: Insights from a Q-methodology study. Environmental Science & Policy, 97, 106–115. (March): https://doi.org/10.1016/j.envsci.2019.03.015
- United Nations. (2020). World economic situation and prospects 2020. United Nations. https://www.un.org/development/desa/dpad/publication/world-economic-situation-and-prospects-2020/
- United Nations. (2021). Ending poverty. Retrieved November 24, 2021, from https://www.un.org/en/global-issues/ending-poverty
- University of Birmingham. (2010). Welcome to POETQ. PoetQ. Retrieved June 17, 2020, from http://poetqblog.blogspot.com/
- Van Loon, J., Woltering, L., Krupnik, T. J., Baudron, F., Boa, M., & Govaerts, B. (2020). Scaling agricultural mechanization services in smallholder farming systems: Case studies from sub-Saharan Africa, South Asia, and Latin America. Agricultural Systems, 180, 102792. https://doi.org/10.1016/j.agsy.2020.102792
- Vargas, A., Diaz, D., & Aldana-Domínguez, J. (2019). Public discourses on conservation and development in a rural community in Colombia: an application of Q-methodology. Biodiversity and Conservation, 28(1), 155–169. https://doi.org/10.1007/s10531-018-1644-5
- Vela-Almeida, D., Kolinjivadi, V., & Kosoy, N. (2018). The building of mining discourses and the politics of scale in Ecuador. World Development, 103, 188–198. https://doi.org/10.1016/j.worlddev.2017.10.025
- Villapol, M. E., Liu, W., Gutierrez, J., Qadir, J., Gordon, S., Tan, J., Chiaraviglio, L., Wu, J., and Zhang, W. (2018). A sustainable connectivity model of the internet access technologies in rural and low-income areas. In P. H. J. Chong, B. C. Seet, M. Chai, S. U. Rehman (Eds.), Smart grid and innovative frontiers in telecommunications (pp. 93–102). Springer International Publishing.
- Waarts, Y. R., Janssen, V., Aryeetey, R., Onduru, D., Heriyanto, D., Aprillya, S. T., N’Guessan, A., Courbois, L., Bakker, D., & Ingram, V. J. (2021). Multiple pathways towards achieving a living income for different types of smallholder tree-crop commodity farmers. Food Security, 13(6), 1467–1496. https://doi.org/10.1007/s12571-021-01220-5
- Wang, J., & Liu, Z. (2014). A bibliometric analysis on rural studies in human geography and related disciplines. Scientometrics, 101(1), 39–59. https://doi.org/10.1007/s11192-014-1388-2
- Watts, S., & Stenner, P, (2012). Doing Q methodological research: Theory, method and interpretation (pp. 248). SAGE Publications Ltd. http://methods.sagepub.com/book/doing-q-methodological-research
- Watts, S., & Stenner, P. (2005). Doing Q methodology: theory, method and interpretation. Qualitative Research in Psychology, 2(1), 67–91. http://www.tandfonline.com/doi/abs/10.1191/1478088705qp022oa
- Watts, S., & Stenner, P. (2007). Q methodology: The inverted factor technique. Irish Journal of Psychology, 28(1–2), 63–76. https://doi.org/10.1080/03033910.2007.10446249
- Weldegiorgis, F. S., & Ali, S. H. (2016). Mineral resources and localised development: Q-methodology for rapid assessment of socioeconomic impacts in Rwanda. Resources Policy, 49, 1–11. https://doi.org/10.1016/j.resourpol.2016.03.006
- Westwood, D., & Griffiths, M. D. (2010). The role of structural characteristics in video-game play motivation: A Q-methodology study. Cyberpsychology, Behavior and Social Networking, 13(5), 581–585. https://doi.org/10.1089/cyber.2009.0361
- Wijaya, A., & Offermans, A. (2019). Public agricultural extension workers as boundary workers: identifying sustainability perspectives in agriculture using Q-methodology. Journal of Agricultural Education and Extension, 25(1), 3–24. https://www.tandfonline.com/doi/full/10.1080/1389224X.2018.1512875
- Woodley, X. M., & Lockard, M. (2016). Womanism and snowball sampling: Engaging marginalized populations in holistic research. The Qualitative Report, 21(2), 321–329. https://nsuworks.nova.edu/tqr/vol21/iss2/9
- Yeboah, T., Sumberg, J., Flynn, J., & Anyidoho, N. A. (2017). Perspectives on desirable work: Findings from a Q study with students and parents in Rural Ghana. The European Journal of Development Research, 29(2), 423–440. https://doi.org/10.1057/s41287-016-0006-y
- Zabala, A., & Pascual, U. (2016). Bootstrapping Q methodology to improve the understanding of human perspectives. PLOS One, 11(2), e0148087. https://doi.org/10.1371/journal.pone.0148087
- Zabala, A., Pascual, U., & García-Barrios, L. (2017). Payments for Pioneers? Revisiting the role of external rewards for sustainable innovation under heterogeneous motivations. Ecological Economics, 135, 234–245. : https://doi.org/10.1016/j.ecolecon.2017.01.011
- Zabala, A., Sandbrook, C., & Mukherjee, N. (2018). When and how to use Q methodology to understand perspectives in conservation research. Conservation Biology, 32(5), 1185–1194. https://doi.org/10.1111/cobi.13123
- Zachariah, R., Kumar, A. M. V., Reid, A. J., Van den Bergh, R., Isaakidis, P., Draguez, B., Delaunois, P., Nagaraja, S. B., Ramsay, A., Reeder, J. C., & Denisiuk, O. (2014). Open access for operational research publications from Lowand middle-income countries: who pays? Public Health Action, 4(3), 141–144. http://www.ingentaconnect.com/content/10.5588/pha.14.0028
- Zobeidi, T., Yazdanpanah, M., Forouzani, M., & Khosravipour, B. (2016). Climate change discourse among Iranian farmers. Climate Change, 138(3-4), 521–535. https://doi.org/10.1007/s10584-016-1741-y