
Abstract
The SERVQUAL model is a commonly used tool for evaluating service quality in public and private sector organizations. It was applied to evaluate the quality of service in the public sector in Ethiopia through the discrepancy between perceived and expected services (ESs). Therefore, a gap score was calculated based on customers’ perceived minus ES quality, as most scholars used to measure the actual service quality. The survey used a descriptive cross-sectional design. A structured questionnaire with 22 items derived from the SERVQUAL model was administered to 562 customers to collect data from the public sector in Ethiopia. Customers who have visited the public sector at least twice were selected for this study. Due to the challenge of selecting the customers randomly, a convenient sampling method was employed as it was easier to pick customers while visiting the offices. The discrepancy between customers’ perceived and ESs across all dimensions of the SERVQUAL model became negative. The mean score of all items and dimensions of expectation is higher than perception. Hence, service quality in Ethiopia in the public sector remained low. Reliability, tangibility and empathy scored the highest mean gap, respectively, while responsiveness and assurance scored the lowest mean. Despite customers’ expectations, the most essential dimensions, reliability, tangibility and empathy, had the lowest perceived service (PS) quality. Finally, customers’ expectations were not met. Therefore, the service quality in public sector institutions needs improvement in all dimensions. This study has important implications for both theoretical and practical research in service delivery.
IMPACT STATEMENT
The public sector plays a crucial role in providing essential services to the citizens of Ethiopia. Customers expect nothing but the best from these services, but sadly, quality remains a persistent issue that causes headaches for both bureaucrats and customers alike. Despite the government’s various attempts to ensure quality service delivery, it still seems like a far-off dream. As a result, citizens are left with nothing but dissatisfaction toward the public sector. The daily communications of people about the failure of service quality, as well as the government’s efforts to initiate programs to improve the situation, are a testament to this fact. This issue has significant implications for both society and the government. This study seeks to identify the gaps between the expectations of customers and the services delivered by the public sector. The study aims to provide plausible solutions to bridge these gaps and improve service quality in the public sector. The findings of this study can be insightful for policymakers, bureaucrats, citizens and the government to gain a better understanding of the issue, and to take corrective measures to improve the quality of services in the public sector.
1. Introduction
Quality is the capacity to meet customers’ needs (Kar, Citation2016). Quality of service primarily focuses on fulfilling the customer’s requirements and how effectively the service satisfies the customer’s anticipations (Thirumal Azhagan et al., Citation2021). The value of service quality to customers and organizations is undeniable (Parasuraman et al., Citation1985). In this era of globalization and competition, providing excellent services is critical to any firm’s success (Biswas & Verma, Citation2022). Service delivery is so crucial that organizations can depend on it to survive (Negi, Citation2009). Quality is essential to a firm’s survival in the current global environment (Tripathi & Siddiqui, Citation2018). The public sector’s public services are critical in any given community because individuals rely heavily on them (Ocampo et al., Citation2019). Thus, it is necessary to provide services efficiently and quickly to ensure the appropriate level of well-being for everyone involved (Ramakrishnan, Citation2013).
Understanding consumer attitudes is crucial for maintaining high service quality and creating a more tightly linked system (Pakurár et al., Citation2019). Customers’ perceived and expected service (ES) quality are crucial for a firm’s success and existence (Sakyi, Citation2020). Improving service quality across public organizations is one of the world’s most complex challenges (Besley & Ghatak, Citation2007). Despite having made the democratic transition, the social outcome indicators showed that many governments of developing countries continue to provide low service quality (Goldstein, Citation2013). In developing countries, service quality across the public sector is weak, if not poor (Okeke-Uzodike et al., Citation2014). Given the variety of customers across public organizations, meeting customers’ expectations of service quality is challenging but critical (Jones & Shandiz, Citation2015).
In 2001, the Ethiopian government implemented the Ethiopian service delivery policy, which aimed to achieve several goals, including enhancing the efficiency and effectiveness of service quality, promoting equal access to government services, ensuring accountability for inadequate service delivery, and ultimately, ensuring customer satisfaction. The government has introduced this policy because it is essential for enhancing service delivery in the public sector. It is crucial to have a well-defined policy outlining the government’s objectives and expectations regarding service delivery and service providers’ and recipients’ rights and responsibilities throughout the service delivery process (Haile, Citation2018). Additionally, in 2001, the government carried out significant reorganization efforts, including the implementation of the National Capacity Building Program (NCBP), which provided fresh momentum to the Civil Service Reform Program (CSRP) (Mengesha & Common, Citation2006). Besides, in 2003, the Ethiopian government unveiled the Public Sector Capacity Building programs, aiming to enhance the capacity of government institutions to provide effective, efficient, and responsive public services. To achieve its vision and policy strategies, the government has implemented various public service reform measures to revolutionize the public service into an objective, modern and efficient system (Markos, Citation2013; Tadesse, Citation2019). The reform measures included business process re-engineering (BPR), balanced scorecards (BSCs), public service change army and Citizens Charter.
However, the reform programs were unpopular and lacked sufficient dedication at the lower level of the government tier, where the reform initiatives are expected to be implemented and institutionalized (Tadesse, Citation2019). In Ethiopia, service delivery practices in public organizations are always accompanied by complaints and grievances (see also, Siyum, Citation2022). Citizens complain daily on every media platform about the poor service delivered by the public sector. Poor quality of service is pervasive at all tiers of the government, including the federal and local levels of government. Thus, citizens desperately speak about service quality across the public sector. In addition, the Ethiopian civil service faced various issues that hindered attaining desired outcomes. For instance, the failure to effectively cater to the equal rights of service users to access public services has resulted in a negative perception of government institutions and civil servants among the public (Haile, Citation2018). Finally, the reform tools for service delivery, such as the BSC, BPR, citizen charter and change army, are currently suspended and not implemented in the public sector. Moreover, the available handful researches in Ethiopia have concentrated almost exclusively on the direct service quality of institutions, with little attention given to the citizen expectation that will best meet client needs. So, it is important to note that there is a shortage of well-researched studies that accurately measure the quality of services provided by public institutions and how citizens perceive and expect them. While many studies focus on the quality of services in the private sector, critically examining the public sector is equally important. Furthermore, due to the sheer volume of customers in the public sector, using large sample sizes can help overcome methodological gaps resulting from response errors, reduced statistical power and the risk of bias. Therefore, analyzing the public sector’s service quality in Ethiopia in one way fills the literature gap and assesses the status of service quality and citizens’ expectations in another way. Moreover, the existing studies mentioned in the literature review deserve credit for contributing to the literature on service quality in Ethiopia. However, most of these studies failed to consider the dynamics and evolution of Ethiopian society’s demand for service. So, this theoretical gap is considered in this study to manage citizens’ expectations that have evolved due to current socio-economic changes and political dynamism in the country. This study also addresses methodological gaps identified in the previous studies, particularly in terms of scope, sampling and the selection of organizations. Although this study also employed the SERVQUAL model, the same as most previous studies, it selected a reasonable number of sample institutions and respondents. Thus, its scope is broad and assists in yielding relatively accurate results.
The study answers the following questions:
What is the status of service quality across the public sector in Ethiopia?
Is there a gap between the perceived and ES quality of customers in the public sector in Ethiopia?
2. Literature and conceptual model
2.1. Concept of service quality
Quality is compliance with customers’ interests and the customer’s perception of quality holds significance, not that of the management (Berry et al., Citation1988). Service quality is how thriving firms meet or exceed customer expectations (Pakurár et al., Citation2019). It is a discrepancy between expectation and perception (Aseres & Sira, Citation2020). The gap between the expectation of customers on the performed service before the service area and their received service is service quality (Mena et al., Citation2020). In operations management, quality is characterized by two main factors: suitability for the intended purpose and consistency (Negi, Citation2009). ‘The research on measuring service quality has primarily focused on how to meet or exceed the external customer’s expectations, and service quality has been viewed as a measure of how the delivered service level matches consumer expectations’ (Shahin, Citation2010, p. 5).
Service quality is determined by how well service assets are managed and how well service demand is met in an integrated manner (Cohen et al., Citation2006). It is highly reliant on employees’ performance and institutional resources that elements of physical goods can be fixed (Zeithaml et al., Citation1988). Service provision requires the service provider to interact with the client, and the service provider must be responsive to the needs of the people (Ramakrishnan, Citation2013). Inseparability, heterogeneity and intangibility are the main recognized characteristics for understanding service quality (Parasuraman et al.,Citation1985). Berry et al. (Citation1985) categorized service quality into two: the ordinary degree of quality at which service is provided regularly and the degree of quality at which ‘exceptions’ or ‘problems’ are managed.
Creating a quality culture involves a number of steps, including setting clear quality standards, selecting employees who are capable of upholding them, providing them with the necessary training, ensuring that they are upholding the standards, and awarding them when they succeed (Berry et al., Citation1985). It is possible to improve the utilization of public resources and the standard of services by encouraging greater transparency and enabling regular people to evaluate the effectiveness, sufficiency and quality of necessary services, as well as to express their needs and preferences and take part in innovation (Ocampo et al., Citation2019). Higher (lower) service quality levels will result in higher (lower) outputs for the firm and the client (Parasuraman, Citation2010). Therefore, the provision of services society needs to sustain and enhance its welfare should be a critical duty of the government and government institutions (Makanyeza et al., Citation2012).
2.2. Customer expectations and perceived services
Clients have played a pivotal role in assessing service quality (Kalaja et al., Citation2016). Customers’ expectations are the foundation for their evaluation of service quality (Mena et al., Citation2020). Customers expect service providers to do their jobs correctly (Parasuraman, Zeithaml, et al., Citation1991; Parasuraman, Berry, et al., Citation1991). Expectations are defined in various ways in social science literature, but they are typically viewed as decisions of people’s beliefs that will or should occur under specific situations (James, Citation2007). The literature on service quality defined expectations as customers’ needs (Parasuraman et al., Citation1988). Expectations are standards for comparing subsequent experiences to evaluate the quality (Zeithaml et al., Citation1993). Generally speaking, service quality scholars have considered expectations as normative standards or customers’ expectations of what a service supplier should provide (Parasuraman et al., Citation1994).
Customers assess service quality based on their needs or expectation against their received or believed (Berry et al., Citation1988). Service quality is satisfactory when expectations are met, more than satisfactory when expectations are exceeded, and less than satisfactory when expectations are not met (Berry et al., Citation1985). The quality of service that customers perceive can decline if there is a discrepancy between their expectations and what the administration believes their expectations to be (Berry et al., Citation1988). The gap between customers’ expectations and perceptions is called perceived service (PS) quality (Parasuraman et al., Citation1992). Comparing clients’ service expectations and perceptions determines service quality (Berry et al., Citation1985, Citation1988; Parasuraman et al., Citation1985, Citation1988; Spreng & Mackoy, Citation1996). Thus, PS is the degree and trend of the gap between the perceptions and expectations of customers (Parasuraman et al., Citation1988). A competitive advantage improves PS quality (Tripathi & Siddiqui, Citation2018).
The SERVQUAL instrument’s expectation statements are about the degree of service clients think they should obtain from the service supplier (Parasuraman et al., Citation1994). In service quality studies, expectations are considered as the interests of customers toward a service, whereas in customer satisfaction studies, it is seen as customers’ forecasts about what they may expect during a transaction of a service (Jones & Shandiz, Citation2015). Customer expectations were categorized by Zeithaml et al. (Citation1993) into four primary areas, namely (1) the component of service that is expected, (2) factors that lead to the service desired, (3) factors that lead to adequate service and (4) factors that lead to both predicted and desired service. Moreover, Parasuraman, Zeithaml, et al. (Citation1991), Parasuraman, Berry, et al. (Citation1991) proposed that customers have two tiers of expectations regarding service: desired and adequate. The desired level of service refers to what the customer anticipates receiving, a mixture of what they believe is possible and what they think must be provided. When customers are satisfied with the service, it is called adequate, and the quality of service is served ().
Table 1. Empirical studies in Ethiopia about service quality.
2.2.1. SERVQUAL model
The SERVQUAL expectations minus perceptions gap are the most commonly utilized model in service quality research and propose that comparing consumers’ expectations of the provided service with their perceptions of a company’s service performance determines service quality (Jones & Shandiz, Citation2015). For measuring levels of service quality, the SERVQUAL gap score idea of evaluating the difference between expectations and perceptions has proven to be very helpful (Shahin, Citation2010). SERVQUAL evaluates the perceived and ESs of the customer (Tripathi & Siddiqui, Citation2018).
Parasuraman et al. (Citation1985) developed SERVQUAL with ten dimensions to evaluate service quality. Then, after a critical review of the scales, they redefined them and reduced them into five dimensions. Parasuraman et al. (Citation1988) later designed a SERVQUAL model with multiple items to evaluate customer perceptions of service quality. The SERVQUAL model has five dimensions: assurance, responsiveness, tangibles, reliability and empathy (Markovic & Raspor, Citation2010; Parasuraman et al., Citation1988). In addition, the model measures the disparity between what customers anticipate and what they encounter, which can lead to either positive or negative outcomes, depending on whether the customers’ expectations are greater or lesser than their experiences (Daniel & Berinyuy, Citation2010). When the quality of services exceeds their initial expectations, consumers or citizens are satisfied; however, when performance falls short of expectations, they are dissatisfied (Mok et al., Citation2017). Of course, other models, such as SERVPERF, E-S-QUAL and FAIRSERV, partially derived from SERVQUAL, have been employed to measure service quality in different fields of study. The SERVPERF measures performance and depends only on the perception of customers, not expectations. E-S-QUAL was developed to measure the electronic service quality. It was developed to measure the service quality delivered by Web sites on which customers shop online (Parasuraman et al., Citation2005). FAIRSERV is a complex model in that customers evaluate the service delivery with other norms of fairness and focus on satisfaction and repatronage intention. While these three models do not provide a comprehensive measure of the service quality gap, it is worth exploring alternative methods to gain a more complete understanding of the situation. In light of this, it is evident that the SERVQUAL model offers a more comprehensive and practical approach to measuring service quality gaps in the public sector, considering its proven track record and industry-wide acceptance ().
Figure 1. A model for this study amended from Parasuraman et al. (Citation1985).
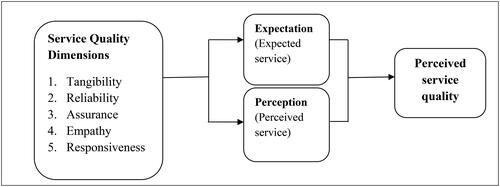
The dimensions of service quality are explained as follows:
Tangibility: The appearance of physical facilities, equipment, communication and personnel (Jones & Shandiz, Citation2015; Mena et al., Citation2020; Parasuraman, Zeithaml, et al., Citation1991; Parasuraman, Berry, et al., Citation1991; Parasuraman et al., Citation1992). ‘Service companies often use tangibles to enhance their image, provide continuity, and signal customer quality’ (Jones & Shandiz, Citation2015). Customers will use the physical image of the service to assess quality (Pakurár et al., Citation2019).
Reliability: The capacity to deliver the stated service with accuracy and dependability (Berry et al., Citation1985; Jones & Shandiz, Citation2015; Parasuraman, Zeithaml, et al., Citation1991; Parasuraman, Berry, et al., Citation1991; Parasuraman et al., Citation1992). ‘Reliability depends on handling customer service issues, performing the services right the first time, offering services on time, and maintaining an error-free record’ (Mena et al., Citation2020).
Responsiveness: the desire to assist clients and promptness in service (Jones & Shandiz, Citation2015; Mena et al., Citation2020; Parasuraman, Zeithaml, et al., Citation1991; Parasuraman, Berry, et al., Citation1991; Parasuraman et al., Citation1992; Sakyi, Citation2020). Response time to customer support requests and the ability to provide quick service are both examples of responsiveness (Mena et al., Citation2020).
Assurance: Employee expertise, manners and capacity for building others’ confidence (Jones & Shandiz, Citation2015; Parasuraman, Zeithaml, et al., Citation1991; Parasuraman, Berry, et al., Citation1991; Parasuraman et al., Citation1992).
Empathy: The company gives each customer individualized care (Jones & Shandiz, Citation2015; Parasuraman et al., Citation1985, Parasuraman, Zeithaml, et al., Citation1991; Parasuraman, Berry, et al., Citation1991; Parasuraman et al., Citation1992). ‘It entails providing tailored care to staff members who are aware of the requirements of their clients and client facilities during business hours’ (Mena et al., Citation2020).
Service quality across industries is evaluated using the SERVQUAL Model. In essence, SERVQUAL gauges the discrepancies between expectations and perceptions of the services offered to customers in various sectors (Hasan et al., Citation2019). It was used in the private sector to measure service quality. Nevertheless, nowadays, it is also commonly used in the public sector to evaluate service quality. Although consumers’ expectations for private services have long been discussed, there has lately been an increase in interest in what the general public expects from public services (James, Citation2011). Therefore, the public sector can also use the SERVQUAL tool to distinguish and evaluate the different attributes of service quality in public services (Kim, Citation2006). Hence, this study employed this model to evaluate the service delivery of the public sector in Ethiopia.
To sum up, unlike many previous studies, which focus on particular or single institutions such as Ethio-telecom, Banks, health services, transportation and hotels, this study concentrates comprehensively on various public sectors that serve large numbers of people. Therefore, the findings of this study assist the policymakers, bureaucrats, politicians, and even NGOs in the country by highlighting the huge gap where the PS falls short of expectations in most of the public sector and, in response, to work on improving quality service and reform.
2.2.2. Operational definition
Service quality: is offering services that align with the preferences of citizens and ensuring that they are delivered efficiently with the highest quality and at the lowest cost possible (Engdaw, Citation2019).
Expected services (ESs): is a desire or wants of customers, that is, what they feels a service provider ‘should’ offer rather than ‘would’ offer (Berry et al., Citation1988).
Perceived services (PSs): is the service experience that customers receive from service providers, regardless of whether it meets their expectations or not. This can include factors, such as the quality of the service, the attitude of the service provider, and the overall customer experience (Parasuraman, Zeithaml, et al., Citation1991; Parasuraman, Berry, et al.,Citation1991).
3. Materials and methods
The study employed a cross-sectional survey method based on Parasuraman et al. (Citation1985) SERVQUAL model, i.e. expected service minus perceived service gap (E − P). In service quality research, SERVQUAL is the leading model used to evaluate it. It has long been the typical method for assessing consumers’ perceptions of service quality (Shahin, Citation2010). It can assist service organizations in measuring customers’ service quality expectations and perceptions (Parasuraman et al., Citation1988). Several proprietary and published studies have used the SERVQUAL scale to evaluate clients’ perceptions of the quality of service (Parasuraman, Zeithaml, et al., Citation1991). Like many other service quality pieces of research, thus this study employed the SERVQUAL model to evaluate the service quality gaps in the public sector in Ethiopia. A multi-stage sampling method was employed to select the public sector for this study. First, the federal ministries with high customer visitors were selected. Second, the four regions (Oromia, Tigray, Amhara and Southern Nations, Nationalities and Peoples of Ethiopia) are believed to have numerous customers, and Addis Ababa, by its status as a capital, was taken purposefully. Third, institutions with a large number of customers and critically criticized customers during their service delivery process were also taken purposefully. Therefore, courts, urban land administration offices, revenue offices, trade offices, and urban administration offices were selected.
Fourth, due to the challenge of finding customers within a defined area and the absence of a registered database of their names and numbers, the selection of individual units was done using convenient sampling. As a result, it was difficult to accurately determine the total population, making it hard to use a sampling size determination formula. In the absence of a precise formula, a trend based on previous similar studies was employed to determine the sample size. Accordingly, a sample size from Negi (Citation2009) was considered but doubled it. This was done to increase the precision of the study results, as a larger sample size generally leads to more accurate and reliable findings. Hence, 562 customers participated in this study. Finally, customers who visited the office during the data collection were requested to complete the questionnaire. To qualify for the study, customers had to have visited the office at least twice, with the purpose of ensuring their familiarity with the office’s operations. Then, the questionnaires were administered to respondents by trained enumerators.
A structured questionnaire was distributed to 562 customers of the selected public sector. Among these distributed questionnaires, 465 were returned, representing an 83% response rate in this study. Among the respondents, 55.9% are males, while 44.1% are females. The respondents have an average age of 36.41 years (SD 9.35). Regarding marital status, 29.9% are single, 66.2% are married, 3.5% are widowed and 0.4% are divorced.
3.1. Measurement
Parasuraman et al. (Citation1988) established a SERVQUAL model with a 22-item tool to assess customers’ perceptions of service quality. This instrument has been pervasively employed to assess customers’ perceptions in different service organizations. The original SERVQUAL model instrument was refined using different multi-sector studies (Parasuraman, Zeithaml, et al., Citation1991). This refined SERVQUAL model was used in this research to evaluate customers’ perceptions and expectations of the service rendered by the public sector organizations in Ethiopia. The SERVQUAL model was constructed based on five dimensions of service quality (Markovic & Raspor, Citation2010; Parasuraman et al., Citation1988; Parasuraman, Zeithaml, et al., Citation1991; Parasuraman, Berry, et al., Citation1991). These are tangibility, assurance, responsiveness, reliability and empathy. Therefore, these dimensions are adopted in this study accordingly.
A seven-point Likert-type scale is used in the SERVQUAL model to evaluate a level of agreement or disagreement with a specific item. However, a five-point Likert scale was employed in this study to ease the rating scale for the respondents. In addition, the degree of service quality is indicated by the discrepancy between perceptions and expectations of service quality (Markovic & Raspor, Citation2010). As a result, this study also employed the perceived and ES gap to measure public sector organizations’ service quality. See the questions, dimensions, and codes given for each item in .
Table 2. SERVQUAL dimensions, items and their codes.
3.2. Statistical analysis and reliability
The data were entered into and analyzed using SPSS version 25 (SPSS Inc., Chicago, IL). After data entry and cleaning, the first step was testing the validity and reliability of items and dimensions for further analysis. After the validity and reliability test, descriptive statistics were conducted to identify the mean and standard deviation (SD) gap score between the perception and expectation of customers. Besides, the paired-sample T-test was conducted to see if the mean difference between the perception and expectation of customers was significant.
Cronbach’s alpha coefficient is frequently utilized as a measure of internal consistency. Thus, a reliability test was conducted to calculate Cronbach’s alpha coefficient of each scale and dimension. SERVQUAL is a multi-item scale with high validity and reliability that service providers can use to comprehend customers’ expected and PSs and thus improve service (Parasuraman et al., Citation1988). The score of a discrepancy between perception and expectation for the five dimensions regularly has high-reliability coefficients across the different studies, showing excellent internal consistency among the items within each dimension (Parasuraman, Zeithaml, et al., Citation1991; Parasuraman, Berry, et al., Citation1991). Therefore, the reliability of the refined items (Parasuraman, Zeithaml, et al., Citation1991; Parasuraman, Berry, et al., Citation1991) and the original items (Parasuraman et al., Citation1988) are high. The result of the reliability in this study is also found appropriate to carry out the analysis, presenting the value of Cronbach alpha between 0.74 and 0.94, satisfying the criterion of 0.70 except for the dimension ‘empathy’, which scored 0.67. The third item, ‘employees of excellent institutions understand the specific needs of their customers’, was deleted to avoid the low value of Cronbach alpha. After the item was deleted, Cronbach’s alpha value of ‘empathy’ became 0.84. Thus, all the scales and dimensions have shown a good reliability score. Besides, the validity test was performed using factorial analysis so as to explain the variance in each item. Each of the items loaded strongly and all of them were retained for further analysis. As a result, the SERVQUAL model and its items were fit for gap analysis in this study ().
Table 3. Reliability and validity test of the constructs.
4. Results and discussions
4.1. Expectations and perceptions
The placement of a customer’s evaluation of service quality on the spectrum varies based on the degree of difference between their ES and their PS (Parasuraman et al., Citation1985; Berry et al., Citation1988). According to Parasuraman et al. (Citation1985), the findings of service quality based on expectation and perception are described threefold. First, when the expectation score (ES) is greater than the perception score (PS), the perceived quality is not satisfactory and may become entirely unacceptable as the difference between ES and PS increases. Secondly, the perceived quality is satisfactory when expectation and perception scores are equal. Finally, when the expectation score is less than the perception score, the perceived quality is better than the standard across various service industries.
‘SERVQUAL can be used to assess a given firm’s quality along the five dimensions by averaging the difference scores on items making up dimensions. It can also provide overall service quality measures in the form of an average score across five dimensions’ (Parasuraman et al., Citation1988). The idea of using the SERVQUAL gap score to evaluate service quality by comparing expectations and perceptions has proven to be a valuable tool (Shahin, Citation2010).
Therefore, the gap score of expectation minus perception based on the SERVQUAL model was employed in this study. The mean score of all the 21 items from expectation minus the mean score of all the 21 items from perception was calculated to see the PS quality of public sector organizations in Ethiopia. Besides, the total mean score of each dimension was calculated to get the gap score and then decided the PS quality ().
Table 4. Perception, expectation and gap score for each item and dimension.
The extent to which expectations surpass perceptions is measured by the quality score, also known as the service gap. A strong positive value of P-E implies high service quality, leading to increased satisfaction of customers. The mean value is a frequently employed metric for evaluating the central tendency of the responses. Hence, the mean score of the scales was calculated to evaluate the service quality status among the country’s public sectors.
In this case, all the items under the expectation have the highest mean score compared to perception. Besides, the grand mean for expectation is higher (4.26) than that for perception (3.05), and the grand mean gap score is −1.25. This indicates that the respondents agreed and had positive expectations of public sector institutions. However, their expectations were not met. Generally, respondents’ PS quality in the public sector institutions did not meet their expectations because the gap scores for each item, i.e. perceived minus expected gap scores, are negative, ranging from –0.96 to–1.48.
Suppose the expectations are greater than the perceptions. In that case, the quality of service will be seen as unsatisfactory and may even be considered completely unacceptable, with a larger difference between what was expected and what was actually received (Parasuraman et al., Citation1985). Thus, the mean for expectation is higher than the mean for perception. This finding is supported by Estepa et al. (Citation2005) and Daniel and Berinyuy (Citation2010). A study by Estepa et al. (Citation2005) focused on students’ perceptions regarding the service quality in the dining center revealed that the expectations of students were not met, as evidenced by all the negative gap scores, ranging from –0.22 to –0.82. Furthermore, the study by Daniel and Berinyuy (Citation2010) on the service industry found that perceptions of customers on service delivery rendered by the institution did not meet their expectations (all the dimensions scored negative), and the score ranged from −0,6874 to −1,0033. Based on these figures, it can be inferred that customers’ judgment of service performance in the service sector falls short of their anticipated level of service quality (Daniel & Berinyuy, Citation2010).
SD measures how the set of observations is spread. The bigger it deviates, the more stretched the observations. A small SD score means the responses were concentrated; hence, the sampled customers had the same opinion about a statement and scored almost similarly. Therefore, the SD for perception is higher than the expectation in almost all items except two and empathy. The grand SD for perception is 1.23, while the grand SD for expectation is 1.08. The higher SD for perception indicates that the respondents had different opinions toward the same statement, whereas the lower SD for expectation means that the respondents had similar opinions toward the same statement.
Therefore, respondents consistently reacted to the items for expectation but spread out toward the items for perception. Thus, the respondents’ expectations had scored the highest mean but lower SD, which means they were expecting quality services from the public sector institutions with a more consistent reaction toward it. However, in another way, the respondents’ perception had scored the lowest mean but highest SD, which means they were not getting quality services from the public sector institutions as their expectations with a different reaction toward it ().
Table 5. The gap score of the five dimensions (expectation minus perception).
The negative mean scores for all dimensions and the negative mean score of overall PS quality (−1.21) indicate that expectations exceed perceptions in public organizations. This result corroborates the findings of Negi (Citation2009), who researched service quality in Ethiopian telecom and revealed that the perception minus expectation gap scores became negative in all dimensions. The highest gap scores for this study are reliability (−1.34), tangibility (−1.31) and empathy (−1.22), respectively. The lowest gap scores are responsiveness (−1.08) and assurance (−1.12). The findings of Daniel and Berinyuy (Citation2010); Markovic and Raspor (Citation2010); and Shahin (Citation2010) are consistent with this study, which discovered ‘reliability’ was identified as the most important indicator of PS quality out of the five dimensions considered.
Furthermore, the study of ecotourism quality in Ethiopia by Aseres and Sira (Citation2020) found that the reliability (−0.915) and tangibility (−0.384) dimensions, respectively, have scored the highest ecotourism service gap, which is more consistent with this study. The high mean score in reliability and tangibility indicated that the customers expect the most from both dimensions of the public sector organizations. The low mean score of responsiveness (−1.08) indicated that customers did not expect a lot on this dimension, or it could be the least important to them, yet they expected most from this service dimension. This finding contradicts a previous study by Afroj et al. (Citation2021) that revealed the highest gap score (−2.22) exists in the willingness of the organizations to respond instantly upon request. Low expectations for a certain characteristic do not always mean that those expectations can be easily fulfilled, nor does it imply that the people evaluating the performance on those traits are less discerning or critical (Estepa et al., Citation2005). Customers’ expectations are not met in all dimensions because of their negative gap score, and they received low service quality in reliability, tangibility, empathy, assurance and responsiveness, respectively, in public sector organizations.
Furthermore, the mean scores of PS ranged from 2.88 for empathy to 3.16 for assurance. Thus, customers PS quality from the public sector organizations is very low in empathy, followed by reliability and tangibility; both have a mean score of 3.02 but received better quality service in the dimension of assurance than other dimensions, though the gap score is negative and yet they expect more from this dimension either.
The total mean score for ES is 4.26, while the total mean score for PS is 3.05 on a scale of 1–5. This mean difference shows that the ESs are reasonably high since they are all above four, and customers expect very high service quality from public sector organizations. However, the PS quality is low in public sector organizations, evidenced by the low total mean score for perception and the negative gap score of all the dimensions.
The quality of service delivery in Ethiopia’s public sector is deteriorating over time. Even in the health sector, where high service quality is required due to its sensitivity as the work is related to treating human life, the results of research studies are mixed. For instance, Erchafo et al. (Citation2018) found that the perceived quality of institutional delivery service in the health sector in southern west Ethiopia was low. Similarly, in North Ethiopia, only 6.3% of health facilities had good quality for essential delivery care (Fisseha et al., Citation2017), which means the quality of service in these health institutions is a luxury. In contrary, Atsebeha and Chercos (Citation2018) found that 75.2% of HIV/AIDS patients are satisfied with the antiretroviral therapy service delivery at a referral hospital. In other public sector institutions, the service delivery problem is becoming beyond the government’s capacity ().
Table 6. Paired samples t-test of perceived service and expected service.
5. Implications for theory
The purpose of the study was to evaluate the service quality gap among the public sector in Ethiopia. The study has yielded valuable insights into the service quality gap, particularly in the public sector, and has become an invaluable reference for future researchers and academics. Moreover, this study has also encouraged other researchers to approach this issue using different research methodologies and to build on the initial findings. The SERVQUAL model has been approved as a reliable tool for measuring the service quality gap in Ethiopia’s public sector.
This model has universal applicability and can be used irrespective of cultural, political or geographical differences. As a result, this research serves as a conceptual framework for policymakers to refer to when making decisions related to the service quality gap in the public sector. This research has also highlighted the dimensions, which have high service quality gap in the public sector, providing comprehensive recommendations for improvement. These recommendations are likely to make a significant contribution to the field’s knowledge and pave the way for further research on this issue. Overall, this research is expected to have a significant impact on the service quality gap in Ethiopia’s public sector, leading to improvements in service delivery and customer satisfaction.
6. Implications for practice
The comprehensive insights derived from the study’s findings will provide a deep understanding of the service quality gap, enabling policymakers and administrators to develop targeted and impactful solutions. The public sector institutions must realize the significance of providing quality service on all fronts to meet customer expectations and gain a competitive edge. Therefore, they need to execute the following actions to improve service quality:
Provide the key performers with proper training to enhance their customer service skills and make them aware of their responsibilities. Empathy and active listening are crucial skills that should also be emphasized to ensure that they can understand and meet customer needs effectively.
Managers should acknowledge the importance of employees in delivering quality service and ensure that there are enough staff members to handle customer needs. This will help streamline service delivery and ensure that customers are not kept waiting for long periods. Managers should also ensure that the employees are well-motivated and have a conducive working environment.
Provide on-the-job training to employees that will help them enhance their skills and knowledge to deliver quality service. Allocate resources for service delivery, establish a standardized evaluation system to recognize top-performing employees, share information, and put in place effective and compliant handling mechanisms. This will help to identify areas that need improvement and recognize those who are doing exceptionally well.
Regularly evaluate service output and outcomes, such as customer service and overall satisfaction, to identify areas of improvement. Make any necessary adjustments based on the assessment to ensure that customers’ needs are met effectively and efficiently.
Conduct year-round assessments to monitor improvement efforts and identify trends in service quality. The initial assessment will serve as a benchmark for future assessments and is critical for gauging the effectiveness of service quality improvement efforts. This will help to identify areas that need improvement and make the necessary adjustments to enhance service quality.
7. Conclusion
A SERVQUAL model was employed to distinguish the service quality gap in the public sector in Ethiopia. The status of service quality in Ethiopian public organizations is very low. Perceptions fall short of expectations, leading to overall low perceived quality of service. The mean score of all items under the expectation is larger than that of all the items under perception. Thus, the high discrepancy between ES and PS led to low service quality in Ethiopia. Reliability, tangibility and empathy scored the highest mean gap, respectively, whereas responsiveness and assurance scored the lowest mean gap. This lower mean score shows that customers had not much expectation from the dimensions of responsiveness and assurance, or they could be the least important to customers. However, this does not mean the customers had no expectations from these dimensions. Customers had much expectation from the dimensions of reliability, tangibility and empathy but perceived low service. The grand mean score of customers’ expectations is 4.26, while the grand mean score of customers’ perceptions is 3.05. The grand mean gap score is −1.25. Besides, the gap score of all items and dimensions remained negative. Customers expected higher than they received from public sector institutions. However, the PS quality is not as their expectations. Hence, customers’ expectation was not met. The researcher, finally, suggests that the service quality in public sector institutions needs improvement in every aspect.
8. Limitations and future research
The study used a simple statistics quantitative study with mean and SD to determine the gap score between customer perception and expectation. Future research should include quantitative studies with advanced inferential statistics analysis that incorporate satisfaction as a dependent variable, as well as qualitative and mixed research methods to better understand the main factors that create the service quality gap in the public sector.
This study utilized a cross-sectional research design to collect data at a specific time. However, it is important to note that the findings may not fully represent the beliefs of public sector customers in the past or future. To ensure consistent results across various times, conducting a longitudinal study would be beneficial.
In addition, the study employed a simple quantitative analysis using mean and SD to determine the gap score between customer perceptions and expectations. Future research should include advanced inferential statistical analysis with satisfaction as a dependent variable, as well as qualitative and mixed research methods to provide a more comprehensive understanding of the primary factors that create the service quality gap in the public sector.
Moreover, the service quality problem in Ethiopia is deep and complex and solving it requires sophisticated statistical techniques and rigorous methodologies to accurately measure results. However, the SERVQUAL model, which relies on a simple comparison of perception minus expectation to find a gap score, has its limitations in capturing multifaceted, subjective and dynamic problems. Therefore, it is vital to consider different approaches when investigating the service quality gap in a complex country like Ethiopia.
It is worth noting that this study solely focused on the public sector and did not consider the private sector, which may limit its holistic implications. Future research should include both public and private sectors to provide valuable comparisons and implications.
Furthermore, the study only collected data from an urban area due to time and financial constraints. Therefore, it would be advantageous to conduct a study in both urban and rural areas to compare findings and understand geographical differences.
Finally, the study only gathered data from customers, and the perspective of employees was not included. Including public sector employees’ perspectives would provide a more comprehensive understanding of the service quality dynamics and suggest more effective improvement solutions.
Disclosure statement
No potential conflict of interest was reported by the author(s).
Data availability
All the data analyzed and reported in this study is available and may be accessed on request.
Additional information
Funding
Notes on contributors
Berihu Asgele Siyum
Berihu Asgele Siyum is a highly accomplished and experienced researcher who has made significant contributions to both private firms and government higher institutions in Ethiopia over the course of more than a decade. His impressive track record demonstrates his unwavering dedication to achieving excellence and driving innovation in his field. As a respected university lecturer and researcher, Berihu has conducted extensive research on a national level, establishing himself as an authoritative figure in research development and project management. His outstanding work has been widely recognized and published across a range of domains, particularly in the areas of governance and development, where he has made invaluable contributions. His recent publications are ‘Practice and Challenge of Urban Land Governance: An Empirical Study in Tigrai, East Africa’, ‘University Instructors’ Burnout: Antecedents and Consequences’ and ‘Underlying Causes of Conflict in Ethiopia: Historical, Political, and Institutional?’
References
- Afework, S., Mariam, D. H., & Demeke, B. (2003). Assessment of quality of services in private clinics in Addis Ababa, Ethiopia. Ethiopian Medical Journal, 41(3), 1–16. https://pubmed.ncbi.nlm.nih.gov/15227892/
- Afroj, S., Hanif, F., Hossain, M. B., Fuad, N., Islam, I., Sharmin, N., & Siddiq, F. (2021). Assessing the municipal service quality of residential neighborhoods based on SERVQUAL, AHP and Citizen’s Score Card: A case study of Dhaka North City Corporation area, Bangladesh. Journal of Urban Management, 10(3), 179–191. https://doi.org/10.1016/j.jum.2021.03.001
- Aseres, S. A., & Sira, R. K. (2020). An exploratory study of ecotourism services quality (ESQ) in Bale Mountains National Park (BMNP), Ethiopia: Using an ECOSERV model. Annals of Leisure Research, 23(3), 386–406. https://doi.org/10.1080/11745398.2019.1642769
- Atsebeha, K. G., & Chercos, D. H. (2018). High antiretroviral therapy service delivery satisfaction and its’ associated factors at Midre-genet hospital; Northwest Tigray, Ethiopia. BMC Health Services Research, 18(1), 223. https://doi.org/10.1186/s12913-018-3055-4
- Berry, L. L., Parasuraman, A., & Zeithaml, V. A. (1988). The service-quality puzzle. Business Horizons, 31(5), 35–43. https://doi.org/10.1016/0007-6813(88)90053-5
- Berry, L. L., Zeithaml, V. A., & Parasuraman, A. (1985). Quality counts in services, too. Business Horizons, 28(3), 44–52. https://doi.org/10.1016/0007-6813(85)90008-4
- Beshah, B., & Kitaw, D. (2014). Quality management practice in Ethiopia. African Journal of Business Management, 8(17), 1. https://doi.org/10.5897/AJBM2013.1624
- Besley, T., & Ghatak, M. (2007). Reforming public service delivery. Journal of African Economies, 16(1), 127–156. https://doi.org/10.1093/jae/ejm026
- Biswas, A., & Verma, R. K. (2022). Augmenting service quality dimensions: Mediation of image in the Indian restaurant industry. Journal of Foodservice Business Research, 26(3), 496–527. https://doi.org/10.1080/15378020.2022.2027198
- Chanie, P. (2001). The challenges of the civil service reform in Ethiopia: Initial observations. Eastern Africa Social Science Research Review, 17(1), 79–102. https://www.ajol.info/index.php/eassrr/article/view/22717
- Cohen, M. A., Agrawal, N., & Agrawal, V. (2006). Achieving breakthrough service delivery through dynamic asset deployment strategies. Interfaces, 36(3), 259–271. https://doi.org/10.1287/inte.1060.0212
- Daniel, C. N., & Berinyuy, L. P. (2010). Using the SERVQUAL model to assess service quality and customer satisfaction. Umeå School of Business
- Engdaw, B. D. (2019). The Impact of Quality Public Service Delivery on Customer Satisfaction in Bahir Dar City Administration: The Case of Ginbot 20 Sub-city. International Journal of Public Administration, 43(7), 644–654. https://doi.org/10.1080/01900692.2019.1644520
- Erchafo, B., Alaro, T., Tsega, G., Adamu, A., Yitbarek, K., Siraneh, Y., Hailu, M., & Woldie, M. (2018). Are we too far from being client centered? PLoS One, 13(10), e0205681. https://doi.org/10.1371/journal.pone.0205681
- Estepa, A., Shanklin, C., & Back, K. (2005). Students’ perceived service quality and customer satisfaction in a Midwestern University foodservice operation. Journal of Foodservice Management and Education, 1, 40–61. http://fsmec.org/wp-content/uploads/2011/09/EstepaShanklinBack2005.pdf
- Fisseha, G., Berhane, Y., Worku, A., & Terefe, W. (2017). Quality of the delivery services in health facilities in Northern Ethiopia. BMC Health Services Research, 17(1), 187. https://doi.org/10.1186/s12913-017-2125-3
- Goldstein, J. (2013). Sensing service delivery: Pervasive computing and governance in developing countries. Political Science & Politics, 46(02), 307–311. https://doi.org/10.1017/S1049096513000243
- Haile, T. (2018). The challenges of service delivery and customer satisfaction in the public sector (the case of adama transport authority). International Journal of Advanced Research, 6(3), 487–493. https://doi.org/10.21474/ijar01/6695
- Hasan, M., Khan, M. N., & Farooqi, R. (2019). Service quality measurement models: Comparative analysis and application in airlines industry. Global Journal of Enterprise Information System, 11(2), 29–41. https://doi.org/10.18311/gjeis
- James, O. (2007). Evaluating the expectations disconfirmation and expectations anchoring approaches to citizen satisfaction with local public services. Journal of Public Administration Research and Theory, 19(1), 107–123. https://doi.org/10.1093/jopart/mum034
- James, O. (2011). Managing citizens’ expectations of public service performance: Evidence from observation and experimentation in local government. Public Administration, 89(4), 1419–1435. https://doi.org/10.1111/j.1467-9299.2011.01962.x
- Jones, J. L., & Shandiz, M. (2015). Service quality expectations: Exploring the importance of SERVQUAL dimensions from different nonprofit constituent groups. Journal of Nonprofit & Public Sector Marketing, 27(1), 48–69. https://doi.org/10.1080/10495142.2014.925762
- Kalaja, R., Myshketa, R., & Scalera, F. (2016). Service quality assessment in health care sector: The case of Durres Public Hospital. Procedia - Social and Behavioral Sciences, 235, 557–565. https://doi.org/10.1016/j.sbspro.2016.11.082
- Kar, B. (2016). Service quality and SERVQUAL model: A reappraisal service quality and SERVQUAL model. Amity Journal of Operations Management, 1(2), 52–64. https://amity.edu/UserFiles/admaa/e7a56Paper 4.pdf
- Kim, H. J. (2006). Measuring citizen satisfaction with contracted-out public service quality: An application of servqual measures. International Review of Public Administration, 11(2), 1–14. https://doi.org/10.1080/12294659.2003.10805081
- Lodesso, S. L., van Niekerk, E. J., Jansen, C. A., & Müller, H. (2019). Student satisfaction regarding service quality at Ethiopian Public Higher Education Institutions: A case study. Journal of Student Affairs in Africa, 6(2), 51–64. https://doi.org/10.24085/jsaa.v6i2.3309
- Makanyeza, C., Kwandayi, H., & Ikobe, B. (2012). Strategies to improve service delivery in local authorities. International Journal of Information Technology and Business Management, 15(1), 1–11.
- Markos, S. (2013). Civil service reform in Ethiopia: Issues, lessons, and future directions. International Journal of Public Administration, 36(4), 235–247. https://doi.org/10.1080/01900692.2012.713305
- Markovic, S., & Raspor, S. (2010). Measuring perceived service quality using SERVQUAL: A case study of the croatian hotel industry. Management, 5(3), 195–209. https://openurl.ebsco.com/EPDB%3Agcd%3A2%3A3858034/detailv2sid=ebsco%3Aplink%3Ascholar&id=ebsco%3Agcd%3A54572570&crl=c
- Mena, T. M., Zaveri, B., Deogaonkar, A., & Zeberga, F. W. (2020). Service quality and it’s effect on customer satisfaction in star-mark hotels of Shashemene Town, Ethiopia. International Journal of Management, 11(9), 1135–1144. https://doi.org/10.34218/IJM.11.9.2020.106
- Mengesha, G. H., & Common, R. (2006). Civil service reform in Ethiopia: Success in two ministries. Research Memorandum 59, 1-26. https://www.researchgate.net/publication/237523633_Civil_Service_Reform_in_Ethiopia_Success_in_two_ministries
- Mersha, T., Sriram, V., Yeshanew, H., & Gebre, Y. (2012). Perceived service quality in Ethiopian retail banks. Thunderbird International Business Review, 54(4), 551–565. https://doi.org/10.1002/tie.21483
- Mok, J. Y., James, O., & Van Ryzin, G. G. (2017). Expectations of and satisfaction with public services. Experiments in public management research: Challenges and contributions (pp. 345–360). https://doi.org/10.1017/9781316676912.017 Cambridge University Press
- Negi, R. (2009). User’s perceived service quality of mobile communications: Experience from Ethiopia. International Journal of Quality & Reliability Management, 26(7), 699–711. https://doi.org/10.1108/02656710910975769
- Negi, R. (2010). Determining satisfaction through customer-perceived service quality and value: Evidence from Ethiopian Telecommunications. International Journal of Services and Operations Management, 7(3), 333–350. https://doi.org/10.1504/IJSOM.2010.035056
- Ocampo, L., Alinsub, J., Casul, R. A., Enquig, G., Luar, M., Panuncillon, N., Bongo, M., & Ocampo, C. O. (2019). Public service quality evaluation with SERVQUAL and AHP-TOPSIS: A case of Philippine government agencies. Socio-Economic Planning Sciences, 68, 100604. https://doi.org/10.1016/j.seps.2017.12.002
- Okeke-Uzodike, O. E., Okeke-Uzodike, U., Chitakunye, P., & Phiri, M. (2014). Measuring service delivery in relation to recruitment policies. Journal of Social Sciences, 40(1), 83–94. https://doi.org/10.1080/09718923.2014.11893305
- Pakurár, M., Haddad, H., Nagy, J., Popp, J., & Oláh, J. (2019). The service quality dimensions that affect customer satisfaction in the Jordanian banking sector. Sustainability, 11(4), 1113. https://doi.org/10.3390/su11041113
- Parasuraman, A. (2010). Service productivity, quality and innovation: Implications for service-design practice and research. International Journal of Quality and Service Sciences, 2(3), 277–286. https://doi.org/10.1108/17566691011090026
- Parasuraman, A., Berry, L. L., & Zeithaml, V. A. (1991). Understanding customer expectations of service understanding customer expectations of service. Sloan Management Review, 32(3), 39–48. https://sloanreview.mit.edu/article/understanding-customer-expectations-of-service/
- Parasuraman, A., Berry, L. L., & Zeithaml, V. A. (1992). Perceived service quality as a customer-based performance measure: An empirical examination of organizational barriers using an extended service quality model. Human Resource Management, 30(3), 335–364. https://doi.org/10.1002/hrm.3930300304
- Parasuraman, A., Zeithaml, V. A., & Berry, L. L. (1985). A conceptual model of service quality and its implications for future research. Journal of Marketing, 49(4), 41–50. https://doi.org/10.2307/1251430
- Parasuraman, A., Zeithaml, V. A., & Berry, L. L. (1988). SERVQUAL: A multiple-item scale for measuring consumer perceptions of service quality. Journal of Retailing, 64(1), 12–40. https://doi.org/10.1016/S0148-2963(99)00084-3
- Parasuraman, A., Zeithaml, V. A., & Berry, L. L. (1991). Refinement and reassessment of the SERVQUAL scale. Journal of Retailing, 67(4), 420–450. https://www.researchgate.net/publication/304344168_Refinement_and_reassessment_of_the_SERVQUAL_scale/comments
- Parasuraman, A., Zeithaml, V. A., & Berry, L. L. (1994). Alternative scales for measuring service quality: A comparative assessment based on psychometric and diagnostic criteria. Journal of Retailing, 70(3), 201–230. https://doi.org/10.1016/0022-4359(94)90033-7
- Parasuraman, A., Zeithaml, V. A., & Malhotra, A. (2005). E-S-QUAL: A multiple-item scale for assessing electronic service quality. Journal of Service Research, 7(3), 213–233. https://doi.org/10.1177/1094670504271156
- Potluri, R. M., & Mangnale, V. S. (2011). Critical factors of customer satisfaction in Ethiopian service sector. Asian Journal of Business Management, 3(1), 1–7. https://www.airitilibrary.com/Article/Detail/20418752-201102-201508130016-201508130016-1-7
- Ramakrishnan, R. (2013). Delivery of public services-the way forward. 15th Thinkers and Writers Forum, March 2013, Available at SSRN: https://ssrn.com/abstract=2242065
- Sakyi, D. (2020). A comparative analysis of service quality among ECOWAS seaports. Transportation Research Interdisciplinary Perspectives, 6, 100152. https://doi.org/10.1016/j.trip.2020.100152
- Shahin, A. (2010). SERVQUAL and model of service quality gaps: A framework for determining and prioritizing critical factors from faculty perspective in higher education. International Journal of Engineering Science and Technology, 2(7), 3297–3304.
- Siyum, B. A. (2022). Practice and challenge of urban land governance: An empirical study in Tigrai, East Africa. Journal of Management and Governance, 27(2), 631–650. https://doi.org/10.1007/s10997-022-09635-8
- Spreng, R. A., & Mackoy, R. D. (1996). An empirical examination of a model of perceived service quality and satisfaction. Journal of Retailing, 72(2), 201–214. https://doi.org/10.1016/S0022-4359(96)90014-7
- Tadesse, W. M. (2019). Public service reform in Ethiopia: Challenges and gaps post-implementation. Africa’s Public Service Delivery and Performance Review, 7(1), 1–9. https://doi.org/10.4102/apsdpr.v7i1.246
- Thirumal Azhagan, C., Gangadharan, S., & Madhanrajan, U. (2021). Computational analysis for service quality determinants in retail sectors using SERVQUAL model. Materials Today: Proceedings, https://doi.org/10.1016/j.matpr.2021.01.236
- Tripathi, S. N., & Siddiqui, M. H. (2018). Assessing the quality of healthcare services: A SERVQUAL approach. International Journal of Healthcare Management, 13(1), 133–144. https://doi.org/10.1080/20479700.2018.1469212
- Ubah, A., & Davi, M. (2015). A study on service quality of commercial banks in Dire Dawa, Ethiopia: Comparative study of public and private banks. European Journal of Business and Management, 7(28), 73-78.
- Zeithaml, V. A., Berry, L. L., & Parasuraman, A. (1988). Communication and control processes in the delivery of service quality. Journal of Marketing, 52(2), 35–48. https://doi.org/10.1177/002224298805200203
- Zeithaml, V. A., Berry, L. L., & Parasuraman, A. (1993). The nature and determinants of customer expectations of service. Journal of the Academy of Marketing Science, 21(1), 1–12. https://doi.org/10.1177/0092070393211001