
ABSTRACT
Presentations assessing public speaking skills are common features of undergraduate curricula. Performance feedback has often been traditionally limited to staff, yet students acting as peer assessors can also be a useful feedback source. Additionally, video recording offers a feedback method that can overcome a presentation’s transience and empower a student’s self-analysis. During 2016–17 a new 1st year module, ‘Core Skills in Biochemistry’, was implemented at the University of Nottingham. Peer assessment and video feedback were trialled as augmentations to lecturer-sourced presentation feedback. Student opinions were surveyed to gauge efficacy. Results indicate video feedback was appreciated to a greater extent than peer feedback, and both focussed on body language. As the year progressed students felt less confident in their colleagues’ judgement, and their willingness to receive peer feedback decreased. These results confirmed the validity of including these techniques within ‘Core Skills’, and laid the foundation for further innovations currently being trialled.
Introduction
During their career, a scientist may be required to speak before any audience size – for example, at low-key weekly laboratory briefings up to the high-impact, but infrequent, international conferences (Aryadoust, Citation2015). In such settings, oratorical skills displaying excellent clarity & cohesion can build a practitioner’s reputation amongst their peers and reflect well on their employers. Importantly, such oration skills as a professional ‘competence’ are highly transferable and so prove useful in many graduate career tracks (Sinclair, Citation2016). Consequently, universities should aim to teach them as effectively as possible.
So, how do universities begin a student’s training in public speaking? De Grez (Citation2009, p. 5) defines good public oration as a:
‘combination of knowledge, skills and attitudes needed to speak in public in order to inform, self-express, relate, or to persuade.’
In the authors’ experience, training in these skills traditionally revolves around a form of assessed presentation. Here, students present on a topic familiar to the assessors who are then able to grade an individual on technical and ‘conveyance’ fluidity. As in other technical disciplines, such as engineering (Pathak & Le Vasna, Citation2015), presentations in Life Science disciplines are (ideally!) ordered, efficient communiqués of information where the presenter effectively utilises a mix of verbal and visual cues to inform the audience on a chosen topic. Consequently, presentations can promote active and deep learning as they require a student to engage and synthesise a topic (often from first principles) in order to provide a complete picture to an audience (Biggs, Citation1999). Additionally, they are an assessment form that allows students to display personal capabilities, whilst gauging themselves relative to their peers (in real-time).
Authors such as Curtis (Citation1999) and Joughin (Citation2007) discuss the theory of employing oral assessments in valid teaching approaches, as well as their reception. Difficulties and limitations of presentations include their time consuming nature and their potential to cause anxiety (De Grez, Valcke, & Berings, Citation2010; Nash, Crimmins, & Oprescu, Citation2015; Sander, Sanders, & Stevenson, Citation2002). Aryadoust (Citation2015) suggests this may be due to the need to correctly (and simultaneously) display mastery of technical content and visual aids, alongside a fluency of expression. Added to having to master non-verbal communication whilst submitting oneself to the judgement of an audience, such feelings may not be surprising. Many believe desensitisation via repeated exposure to presentations may help reduce anxiety related to public speaking in the long-term (Behnke & Sawyer, Citation2000). Additionally, valid feedback that can facilitate learning and increase self-esteem should also play a role in increasing confidence in this important skill (Murphy and Barry (Citation2015), and authors there-in).
In traditional oral assessment arrangements, staff often provide verbal or written feedback (an ‘external source’; Schmidt & Wrisberg, Citation2001 in Murphy & Barry, Citation2015). However, more recently there has been a growing body of research highlighting the role of peer assessment in providing feedback (De Grez et al., Citation2010; Falchikov, Citation2005; Ritchie, Citation2016). Here, a student grades their peers’ work/performance using relevant criteria (Falchikov, Citation1995, Citation2001). Benefits include providing a control and autonomy to the task at hand and encouraging higher order thinking/active engagement within the learning environment (Suñol et al., Citation2015; Vickerman, Citation2009). Yet, it may also have drawbacks including making some students feel uncomfortable or exposed whilst judging a peer’s work, so Wen and Tsai (Citation2006) suggest learners remain anonymous.
In addition to these external sources, the student themselves (an ‘internal source’; Schmidt & Wrisberg, Citation2001 in Murphy & Barry, Citation2015) could also act as a reliable and provocative feedback source. Unfortunately, students are often unable to witness their own performance and are therefore unable to add their own feedback or to link it to any assessor feedback provided. This temporal transience of the presentation is a significant limitation in being able to easily reduce a student’s competency gap. Video recording technology provides an answer to this limitation, and because 21st century students seem comfortable with technology, its utilisation in the classroom may enhance engagement and increase course perceptions (Metcalf, Layton, & Goslin, Citation2016; Ritchie, Citation2016). Video feedback permits a real-time self-evaluation by the student of their performance against provided assessment criteria and has been studied/utilised by a range of authors (Bourhis & Allen, Citation1998; Christianson, Hoskins, & Watanabe, Citation2009; Stefanidis, Korndorffer, Heniford, & Scott, Citation2007). Students can self-assess a presentation’s verbal & non-verbal aspects from the perspective of an observer (Quigley & Nyquist, Citation1992 in Murphy & Barry, Citation2015). Consequently, such feedback can rapidly challenge a student’s comfortable, yet incorrect, self-assumptions whilst providing a stimulus for skill development and improved confidence (Jordan, Citation2012; Ritchie, Citation2016).
The study’s rationale
The University of Nottingham’s (UoN) undergraduate Biochemistry course displays a robust design based on pedagogic principles. Staff are willing to adopt approaches which consolidate this design. In 2016/17, an update to the biochemistry course curriculum was implemented. The equilibrium of emphasis moved away from a solely theoretical consideration of biochemistry to one where professional skill sets are also taught – an approach adopted in other institutions on other courses (Boyer Citation2000, Citation2017).
This emphasis was manifested in ‘Core Skills in Biochemistry’, a compulsory, year-long module encountered by all biochemistry students. Based around 28 traditional hour-long lectures, 3 half-day laboratory practicals, 9 small group tutorials and 9 workshops, Core Skills provides foundational skills necessary for UoN students to succeed in the ever-evolving field of biochemistry. Skills taught include basic biochemical calculations, practical laboratory skills, and the focus of this paper: oral presentations skills. In an improvement on the original course design, both formative and summative presentations were included in an attempt to increase student familiarity with the task. In alignment with Taylor and Toews (Citation2009) and De Grez, Valcke, and Roozen (Citation2013) who discuss elements that define a learning environment, learners were made aware of their roles and responsibilities via a didactic lecture. This focussed on real-world examples of good and bad presentation skills, coupled with common sense amendments based on the authors’ experience.
In order to be effective, feedback must be presented within a reasonable timeframe and consequently UoN has a 21 day ‘turn around’ rule for marks/feedback (Nicol & Macfarlane-Dick, Citation2006). Although Core Skills is taught via a team teaching approach (Money & Coughlan, Citation2016), academics found it increasingly difficult to provide feedback on assessment whilst delivering new teaching as the term progressed. The pressures, including class size expansion, that reduce feedback opportunities on assessment such as oral presentations are well known (De Grez, Valcke, & Roozen, Citation2009; Leger, Glass, Katsiampa, Liu, & Sirichand, Citation2015; van Ginkel, Gulikers, Biemans, & Mulder, Citation2016). To compensate, oral presentations were altered to include the use of pairs and groups which may reduce student anxiety and providing peer learning opportunities (Chou, Citation2011). Additionally, peer assessment and video recording were implemented to increase feedback variety and levels. In an attempt to judge the efficacy of this design, this study aimed to gauge student opinion on the utilisation of peer feedback and video recording.
Materials and methods
Ethics
Ethical consideration was approved by the University of Nottingham, School of Life Sciences Research Ethics committee (reference number: C051016TS). All students were asked to fill out a consent form to indicate voluntary participation and permission to be videoed. Participants were told there was no obligation to participate and that they could engage or withdraw without prejudice. Participation was anonymous, and following the approach of Money and Coughlan (Citation2016), participation (or not) would have no impact on grades.
Study design
During the academic year 2016/17 118 first year students (aged between 18 to 34 years) at the University of Nottingham took the ‘Core Skills in Biochemistry’ module. The module required two oral presentations – a formative 15 minute group presentation (where each student spoke for approximately 2 minutes), and a summative 15 minute presentation (performed in pairs, contributing 10% of the module mark) (). Five minutes of each presentation was set aside for questions. Students were required to use Microsoft® PowerPoint. Before the presentations occurred students attended a mixed-media orientation lecture, featuring YouTube clips, on effective presentation technique (in line with approaches taken by Aryadoust, Citation2015). Explanations of the study’s design and rationale were made in order to instil confidence in both experience and educators.
Figure 1. Core skills oral presentation workflow.
Sessions dedicated to oral presentation skills are spread throughout the academic year. An orientation lecture in semester 1 conveys the theory, and a formative presentation permits practice of that theory. In semester 2 skills are assessed with effort impacting upon course grades. Topics discussed by student groups at each presentation are displayed.
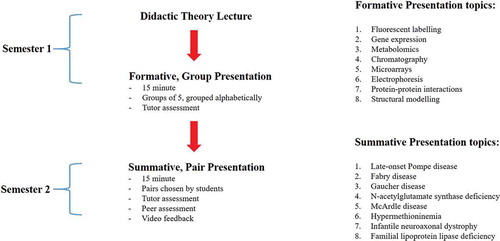
At the conclusion of both presentations students submitted a ‘Group Effort Sheet’ that ranked partner contributions from 1 (Poor) to 5 (Good). Two academic staff members filled out a mark sheet commenting on presentation skills (e.g. audibility, scale of note reading, audience engagement; 30% of the mark), organisation (e.g. talk layout, slide layout, image use; 30% of the mark), scientific content (e.g. understanding background material, biochemical content, 30% of the mark), and the ability to answer questions (10% of the mark). A grade (following UoN’s categorical marking scheme) and some free text offering further advice was provided. At the conclusion to the summative talk, which was video recorded, peers assessed the efforts of all their fellow students within that presentation session. This peer observation utilised a 5-point numerical rating scale (1 = Needs improvement to 5 = Excellent/comprehensive) and focussed on ‘slide style/content’; ‘scientific background’, and ‘presenter style’. Peers listed 2 areas for improvement and suggested a grade (1st = comprehensive, well-evidenced/presented, interesting; 2.1 = comprehensive/well presented; 2.2 = decent but needs improvement; 3rd = needs significant improvement; fail = presentation is unfollowable). On average, each student was assessed by 25–30 peers. After both presentations, student opinion was surveyed using questionnaires.
Questionnaires
At the conclusion of both presentations students were handed paper questionnaires to the 118 students (see Appendix A and B, questionnaire A = post-formative, questionnaire B = post-summative; inspired by Murphy and Barry (Citation2015). The data gathered from the questionnaires used a 5-point numerical rating scale (1 = No/disagree/poor to 5 = Yes/agree/excellent). Questionnaires were retrieved no later than 2 weeks after a presentation.
Video-recording
Recordings were made using Sony DCR-DVD150E cameras. Each consenting student’s performance was separately recorded on a unique DVD. To comply with privacy requirements, the unique recording was presented to the student at the presentation’s conclusion.
Data analysis
Data analysis and graphical generation was performed using ‘R version 3.2.2ʹ (R Core Team, Citation2013; Bryer & Speerschneider, Citation2016). Data normality was assessed using a Shapiro-Wilk test. Significance between Questionnaire A and B response distribution were assessed using a non-parametric Mann-Whitney U test. Percentages were calculated by: (ordinal category response)/(total respondents for questionnaire) x 100. Results were rounded to 1 decimal place. Percentages were also generated for aggregated ordinal categories (composed of options 1 + 2; 4 + 5). Aggregate option (1 + 2) was considered a ‘negative’ response to the question as posed. Aggregate option (4 + 5) was considered ‘positive’. Option 3 was considered ‘neutral’. Likert data plots were formulated using percentages calculated per total question respondents and figures were rounded to the nearest percentage.
Results
This study assessed student opinion on the efficacy of peer feedback and video feedback as enhancements to presentation skill training within first year biochemistry courses at UoN. Two questionnaires were utilised: Questionnaire A (post-formative) had a response rate of 20/118 (16.9%), whilst Questionnaire B (post-summative) had a greater response of 38/118 (32.2%).
‘Core skills’ students: a mixed background
Of the respondents to Questionnaire A, 50% (aggregate) reported having previous experience of public speaking whilst 15% said they had none at all. Many students (55%, aggregate) indicated they considered public speaking a difficult opportunity and an identical percentage indicated anxiety during the formative presentation. Following the second presentation, 42.1% (aggregate) still reported anxiety (a non-statistically significant decrease, W = 417, P-value = 0.5308, N1 = 20, N2 = 38) (). The students who described their emotional state as ‘neutral’ remained approximately equal (Questionnaire A: 25% & Questionnaire B: 29%).
Figure 2. The student experience of presentations.
After each presentation students were asked ‘On a scale of 1 → 5 (where 1 = fully comfortable and 5 = anxious) how would you rate your experience during your recent [formative/summative] presentation?’. Respondent number: Questionnaire A: 20, Questionnaire B: 38. Percentages rounded to 1 decimal place.
![Figure 2. The student experience of presentations.After each presentation students were asked ‘On a scale of 1 → 5 (where 1 = fully comfortable and 5 = anxious) how would you rate your experience during your recent [formative/summative] presentation?’. Respondent number: Questionnaire A: 20, Questionnaire B: 38. Percentages rounded to 1 decimal place.](/cms/asset/81d941ec-79c9-4fa2-9cf0-16b0388e263d/rhep_a_1587717_f0002_oc.jpg)
Course design: appreciated by students
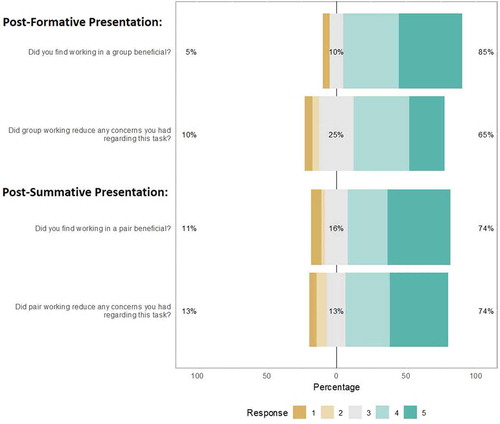
Opinions on the use of a mixed media orientation lecture were favourable with 65% (aggregate) of responses indicating satisfaction with that provision. The formative assessment team-working arrangement was also appreciated with 85% (aggregate) affirmatively answering that group work was beneficial with 65% (aggregate) of respondents commenting it had reduced their concerns (). In Questionnaire B, again, working with colleagues was appreciated and reduced concerns with 73.7% (aggregate) providing positive opinions of the working arrangements (). These levels did not differ significantly from the results of Questionnaire A (P-values > 0.5). A majority (70%, aggregate) believed that peer interactions during the formative assessment provided ideas that could influence their own approach – a majority that only slightly decreased to 65.79% (aggregate) on completion of the later summative presentation.
Figure 3. Student opinions of course delivery of presentation skill training.
Students were asked to evaluate group and pair working as present within the formative and summative presentation sessions, respectively. Scale: 1 = No/disagree/poor → 5 = Yes/agree/excellent. Respondent number: Questionnaire A: 20, Questionnaire B: 38. Percentages rounded to 1 decimal place.
Staff feedback: valued but with room for improvement
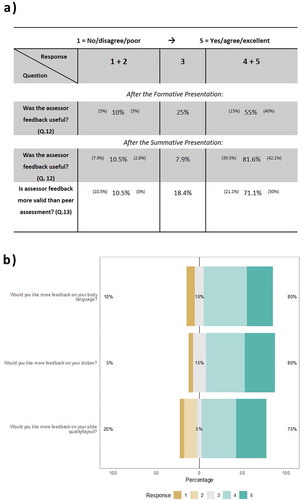
Part of Questionnaire A assessed student opinion of assessor feedback and revealed 35% of respondents considered it negatively (aggregate) or ambivalently as a useful tool for enhancing practice (). Assessor feedback was again studied in Questionnaire B and 81.6% (aggregate) gave favourable opinions of its usefulness for enhancing performance. When asked, the overwhelming majority (71.1%, aggregate) considered assessor feedback as more valid than peer feedback although 10.5% of respondents said ‘No’ to this question. The majority (75%, aggregate) wanted more feedback on slide layouts, 80% (aggregate) required more feedback on diction and 80% (aggregate) would appreciate more feedback on body language (). Only 5–10% of students appeared happy with staff feedback centred on these topics.
Figure 4. Student opinions of assessor feedback.
(a) Students were asked to evaluate staff feedback after each presentation (respondent number: Questionnaire A: 18; Questionnaire B: 38. Inserts display response rate to individual category contributing to the aggregate value. Questions are paraphrased and related to questionnaire. Percentages rounded to 1 decimal place). (b) Students were asked to indicate what performance areas they would like to see more comment on. Scale: 1 = No/disagree/poor → 5 = Yes/agree/excellent. Respondent number: Questionnaire A: 20. Values rounded to whole percentage.
Assessing another’s work: confidence & trust changes as the year progresses
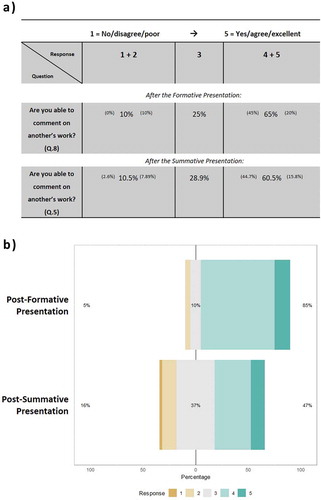
It was hoped that the lecture and formative presentations provided would increase student confidence such that they would feel comfortable enough to offer opinions on other students’ presentations. Should student opinions be gathered then the majority (80%, aggregate) preferred it to be anonymous. After the first presentation, only 65% (aggregate) of respondents felt confident enough to comment on another student’s presentation with 35% responding ambivalently/negatively (). By presentation 2, a statistically similar 60.5% (aggregate) felt that their experience put them in sufficient position to judge others. When asked whether students trusted their friends’ opinions on their work, the different questionnaires revealed a statistically different distribution of responses – indicative of an opinion change (W = 507, P-value = 0.02692, N1 = 20, N2 = 38). Initially, 85% (aggregate) trusted another student’s opinions of their efforts but this decreased to 47.4% (aggregate) by Questionnaire B (). This was greater than those who responded in negative terms (15.8%, aggregate) but a sizeable fraction remained ambivalent/neutral (36.8%, up from 10% in Questionnaire A).
Figure 5. Student opinions on their ability to assess another’s work.
(a) Students were asked to evaluate their confidence in assessing another’s work (respondent number: Questionnaire A: 20; Questionnaire B: 38. Inserts display response rate to individual category contributing to the aggregate value. Questions are paraphrased and related to questionnaire. Percentages rounded to 1 decimal place). (b) Students were asked ‘Would you trust your fellow student’s opinions of your efforts? Scale: 1 = No/disagree/poor → 5 = Yes/agree/excellent. Respondent number: Questionnaire A: 20; Questionnaire B: 38. Values rounded to whole percentage.
Peer feedback: appreciated but focussing on verbal & non-verbal presenter behaviour
Questionnaire A respondents (75%, aggregate) indicated they would like others to rate their efforts (only 5% actively demurred) (). Interestingly, student opinion shifted after the second presentation (W = 498.5, P-value = 0.04397, N1 = 20, N2 = 38). Then, only 52.6% (aggregate) felt happy with the idea of their peers providing feedback and the number of students who felt ambivalent or negative had increased. Questionnaire B revealed that 60.5% (aggregate) of students felt their peers had provided useful presentation feedback (39.5% answered ambivalently or disagreed) (). When asked about feedback content, only 26.3% (aggregate) & 28.9% (aggregate) of respondents positively agreed that peer feedback included hints about talk content and slide style, respectively. A sizeable fraction of respondents remained non-committal (neutral: 36.8% & 47.4%) on these points. Questionnaire B revealed that advice on ‘diction’ was encountered by 44.7% (aggregate) and that peer feedback seemed to include more ‘body language’ advice (55.3% answered positively).
Figure 6. Student opinions on peer feedback Students were asked to evaluate feedback from their peers.
(a) Responses to ‘If your fellow students were provided the opportunity to rate your own performance would you be happy with this as a method of feedback?’ after the formative and summative presentations (Respondent number: Questionnaire A: 20, Questionnaire B: 38) (b) Response to ‘Questionnaire B’ questions querying views on peer feedback after the summative presentation. Number of respondents who failed to answer individual questions is also displayed. Scale: 1 = No/disagree/poor → 5 = Yes/agree/excellent. Values rounded to whole percentage. N.B.image percentages based on number of question respondents.
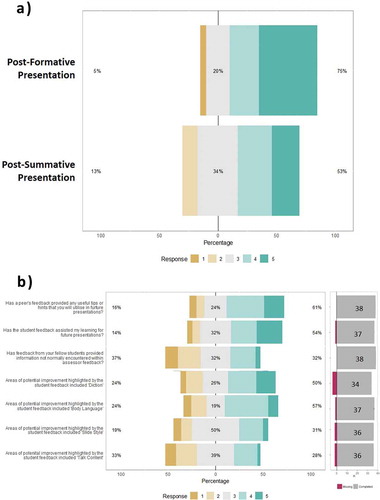
When queried (Questionnaire B) as to whether their peers had provided information not normally present in assessor feedback 36.8% responded negatively, 31.6% remained neutral, and 31.6% responded positively. Investigators were keen to determine impact of this feedback and asked if peer feedback had assisted student learning in terms of future presentations. 52.6% (aggregate) thought it had and 31.6% were neutral on this matter.
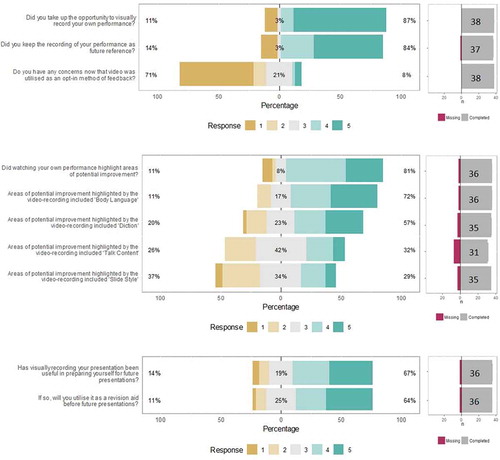
Video recording: appreciated and judged useful for future work
As a preparation for later use, student opinions on video feedback provision were gauged in Questionnaire A. 75% (aggregate) displayed positive thoughts on being able to watch their own performance, and 80% (aggregate) thought they would take up the offer of video feedback if presented. A similar majority, 65% (aggregate) considered keeping a recording for future reference. 10% (aggregate) of respondents suggested some form of concern with video recording provision.
The majority (86.9%, aggregate) of the 38 respondents were videotaped during their second presentation (). After the recording occurred, one respondent wished they had taken the offer, and two appeared content they had not. Three respondents (7.9%, aggregate) stated they had some form of concerns now recording had taken place. 81.6% said they had kept the recording (aggregate of neutral + positive responses). On watching the recording, 76.3% (aggregate) said performance areas were highlighted for improvement although 10.5% (aggregate) said otherwise. Utilising video recording did not seem to categorically aid students in improving their ‘talk content’ – in fact the largest proportion of responses to this query were ambivalent (34.2%). Similar mixed results were encountered regarding video recording’s ability to inform on ‘slide style’, 31.6% of students were ‘neutral’ and 34.2% were ‘negative’. More positively, 68.4% (aggregate) and 52.6% (aggregate) believed recording could highlight areas of improvement in ‘body language’ and ‘diction’, respectively. 63.2% (aggregate) felt that recording had been useful when viewed in the light of preparing for presentations in later years. 60.5% (aggregate) responded that they would use it as a revision aid before future presentations.
Figure 7. Student impressions of video feedback.
Student opinions of the different facets of video feedback were analysed after its employment during the summative presentation. Number of respondents who failed to answer individual questions is also displayed. Scale: 1 = No/disagree/poor → 5 = Yes/agree/excellent. Values rounded to whole percentage. N.B. image percentages based on number of question respondents.
Impact: interactive feedback engages a majority of students in the task
Staff were keen to see if students felt increased engagement due to having more interactive feedback forms (). Although 65.8% (aggregate) said yes when questioned on this, 34.2% of respondents were ambivalent or negative. 76.4% (aggregate) acknowledged a better understanding of the assessor’s role after conducting peer assessment and 71.1% (aggregate) acknowledged the impact of anonymous feedback on a person.
Table 1. Evaluation of the impact of the course design on the student.
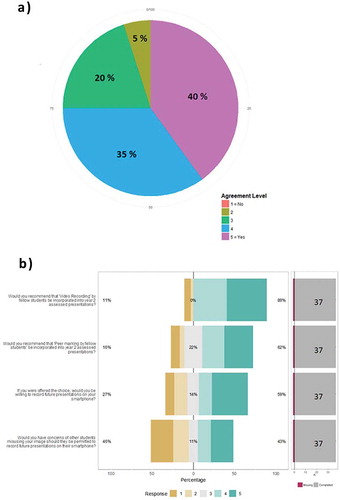
Future course innovations
As for further improvements, 75% (aggregate) of respondents were in favour of a debriefing with a staff member (). Students were asked their opinions on recording performances on personal smart phones (). 57.9% (aggregate) seemed happy with such an option, although 26.3% (aggregate) were not so happy. When asked if they has concerns of image misuse, opinions were mixed – 42.1% (aggregate) declared concerns, whilst 44.7% (aggregate) responded negatively. The greater majority (60.5%, aggregate) were happy to see incorporation of peer marking into year 2 presentations, and even greater majority (86.8%, aggregate) would be happy to see the incorporation of video recording.
Figure 8. Student opinions on future course innovations.
Students were asked if some of the techniques employed in this course, and others, could be utilised in other forthcoming courses. (a) Responses to ‘Would you appreciate a debriefing with a member of staff where your recorded presentation was the focus of discussion?’, (Respondent number: 20); (b) Response to questions after the summative presentation querying views on engagement and future application. Number of respondents who failed to answer individual questions is also displayed. Scale: 1 = No/disagree/poor → 5 = Yes/agree/excellent. Values rounded to whole percentage. N.B.image percentages based on number of question respondents.
Discussion
In this paper, a new design for teaching presentation skills during the first year biochemistry course at the University of Nottingham was evaluated through the prism of student opinion. The course design presented provides students with formative assessment and related feedback, as well as time to consider improvements before a summative assessment. By mimicking an experiential learning cycle, this arrangement is intended to foster ‘deep learning’ in the student (Entwistle, Citation2009; Kolb, Citation1984 in Leger et al., Citation2015). The students are exposed to new theory, they perform (receive feedback), before trying again. Intertwined in this design is an acceptance of the important role of formative assessments as part of learning (Nicol & Macfarlane-Dick, Citation2006). This arrangement should provide a strong foundation for improving competence in a skill set highly valued by employers.
From the results it is apparent UoN students have a range of different experiential backgrounds and, consequently, will have different learning needs. The authors agree with Leger et al. (Citation2015) who state that one form of feedback is unlikely to fit across all learning structures. Therefore this proposed course design, with a heavily augmented feedback arrangement, should help all students – whatever their starting point. The authors hoped this multi-layered approach would appeal to the modern student with significant investments in tuition fees who crave as much feedback as possible. The questions evaluating impact seem to indicate this was the case. Varying student needs can include differing stress levels and it is clear that anxiety was an issue for many students during the year. The authors, with their experience as examiners and disability liaison officers, believe that such anxiety amongst the student body is growing and recommend staff compensate for it in any robust course design. Therefore, they felt an equal focus on both form and content during the summative evaluation would reduce that anxiety. More importantly, it appears that group working was an appreciated design feature as it helped reduce anxieties as well as provided a source of inspiration/team-learning for the students involved. With that said, some work on the design must continue. Although a student majority are in favour of the orientation lecture, it would be better to have full cohort acceptance. Consequently, an increased responsive element (e.g. a problem/response section) will be incorporated to increase engagement, as will well-being techniques to help influence student anxieties further.
As a solid framework for enhancing presentation skills, assessor feedback was believed to set the ‘high-bar’ for feedback quality – a belief clearly held by the students. Yet, the results encountered suggest instances when staff feedback had not been as useful as hoped. It is possible that when delivered solely by itself students have a tricky time reconciling staff advice to their behaviour. Also, staff time is limited during presentations so detailed notetaking is difficult. However, in combination with peer and video feedback, it may now be easier to make sense of staff feedback. Also, when assessing a presentation created by a pair more time is available to characterise a student’s performance more effectively. Therefore, students may pick up on this – explaining the appreciation levels recorded post-summative presentation (in Questionnaire B). From a faculty standpoint, although providing enhanced feedback, this arrangement required less infrastructure and time compared to what some authors define as ‘1st class’ arrangements (e.g. tutor and peer feedback with in-class discussions and self-reflection, (Leger et al., Citation2015).
Peer feedback was viewed as both interactive and valid by the authors. Such feedback allows the presenter to judge their impact on the target audience (a more authentic experience) rather than solely the impact on the assessors with their intrinsically different capabilities. It should also allow students to develop their own critical appraisal skills. However, it is interesting to see how students viewed it. Should it be given, the majority wished it to be anonymous (which it was during the summative presentation). Anonymity can be a powerful influence on the feedback provided, and during this study student responses were monitored for politeness because of this.
Approximately two thirds of respondents showed confidence in their abilities to judge others (a slight decrease as the year progressed registered as non-significant). However, as the students grasped the full nature of the task that lay before them, we see their confidence in (and willingness to submit to) their colleagues’ judgement appear to decrease. This may be caused by their more accurate evaluation of their classmates’ strengths/limitations (if not their own ability…). When provided, the majority appreciated the feedback but it appeared to be stronger in terms of advising about non-verbal cues and verbal cues, (‘vocalics’ e.g. pitch & volume; Cavanagh, Bower, Moloney, & Sweller, Citation2014) rather than scientific content. This makes sense as all students can readily grasp when someone is nervous, but fewer will be able to tell when someone has muddled biochemical minutiae.
Video is less fallible than memory and allows for detailed analysis, ad infinitum (Sherin, Citation2004 in Cavanagh et al., Citation2014; Jordan, Citation2012 and studies there-in). Consequently, recordings allow a more efficient ‘filling in’ of knowledge/competency gaps present in students of diverse skill sets, as they themselves build on those experiences. Video can force the student to accept the assessor’s verdict, which may conflict with a student’s self-image of their competency. Additionally, the use of recordings has the advantage that students with specific learning differences can be catered for, for example dyslexia, in ways that written feedback cannot. Not all students wanted to be recorded but this has been commented upon by other authors (e.g. Brookfield, Citation1995 in Jordan, Citation2012). Students rated the recordings more favourably than peer assessment, and specifically as a good way of identifying non-verbal characteristics, potentially for reasons considered above. The authors acknowledge that the act of recording oral presentations is not a new facet in education. The use of such technology as DVD-R camcorders is not cutting edge, but meets with the philosophy of ‘Good Enough’ (Jordan, Citation2012 and studies there-in). They are cheap, easy to use, and produce tangible results. Ironically such legacy equipment has allowed the authors to avoid new obstacles, e.g. the issues faced in processing & storing of data in the form of recognisable images under the new the ‘General Data Protection Regulations’. They therefore consider this obsolete equpiment a beneficial asset!
It was originally intended that students would use their own smartphones for recording. However, ethical approval was denied for fear of image misuse and legal action. The authors initially considered this over-reactive, yet it seems 42.1% of the student body would agree with our ethics committee – a sizeable fraction. If such a method is to be adopted in future, strict guidelines for their employment to reassure participating students would be recommended.
With the above having been stated, and in the belief that the results are reproducible in other institutions, the authors do acknowledge some study limitations. Firstly, questionnaire response rates are low. Student surveys are very common at Nottingham with students encountering several university-mandated surveys per module, per term. Consequently, it is difficult to motivate student engagement in pedagogical studies. This leads to limitations in analysis as small datasets can limit the sensitivity for nonparametric tests employed. In addition, one perceived strength (that of student anonymity) has engendered further limitations. Although ethical approval is easier to attain, analytical techniques that gauge longitudinal trends, such as the Friedman Test, are consequently unavailable. The partial ‘anchoring’ of the numeric numbering system (used during surveying) at the extreme of its range adds further limitation. Is the mental distribution of numbers 1→5 on this line the same for all students? As it probably is not, the authors felt obliged to conform to an ordinal interpretation of the data. A future improvement would be to anchor each value or use a True Likert Scale. That way a more equal ‘interval’ between categories may be possible, permitting more analytical freedom, and hopefully a detection of the subtle but currently unconfirmed trends seen in this study.
With all this in mind – where to go now? Well, the authors have already begun building on this study. Cavanagh et al. (Citation2014) and Sherin (Citation2004) observe that self-reflection is important in assisting subjects ‘to become more sensitive to their communications’, and can help students engage in critically analysis. In 2017/18, such a self-reflection exercise was implemented to look at all feedback received within this course and data is currently being analysed. Additionally, peer feedback was captured utilising Socrative©, a Student Response System. This greatly decreased the admin load of staff. The authors are also tempted to set the peer assessment as contributing to the course mark, as previous studies such as Dragemark (Citation2006 in Aryadoust, Citation2015) have found this incentive to engage with the task.
When coupled with sufficient feedback and an approach to monitor student thoughts on the methods utilised, activities can be more effectively moulded into effective instructional tools. The authors venture that this has been achieved during this study. They welcome critique of the approach as they acknowledge the need to have an underlying set of standards what are robustly authentic – something the authors believe to be a global aim of educators. The authors also hope that this study helps with the formulation of best practice methods that enhance student uptake of key transferable skills, whilst also factoring in the limitations of university infrastructure.
Acknowledgments
The authors would like to gratefully acknowledge Dr. Tom Reader’s statistical advice.
Disclosure statement
No potential conflict of interest was reported by the authors.
Related Research Data
References
- Aryadoust, V. (2015). Self- and peer assessments of oral presentations by first-year university students. Educational Assessment, 20(3), 199–225. doi:10.1080/10627197.2015.1061989
- Behnke, R.R., & Sawyer, C.R. (2000). Anticipatory anxiety patterns for male and female public speakers. Communication Education, 49(2), 187–195. doi:10.1080/03634520009379205
- Biggs, J. (1999). Teaching for quality learning at university: What the student does. Buckingham: Open University Press.
- Bourhis, J., & Allen, M. (1998). The role of videotaped feedback in the instruction of public speaking: A quantitative synthesis of published empirical research. Communication Research Reports, 15(3), 256–261. doi:10.1080/08824099809362121
- Boyer, R. (2000). The new biochemistry: Blending the traditional with the other. Biochemistry and Molecular Biology Education, 28, 292–296.
- Brookfield, S. (1995). Becoming a critically reflective teacher. San Francisco, CA: Jossey-Bass.
- Bryer, J, & Speerschneider, K (2016) Package 'likert'. https://cran.r-project.org/web/packages/likert/likert.pdf
- Cavanagh, M., Bower, M., Moloney, R., & Sweller, N. (2014). The effect over time of a video-based reflection system on preservice teachers’ oral presentations. Australian Journal of Teacher Education, 39(6). doi:10.14221/ajte.2014v39n6.3
- Chou, M.-H. (2011). The influence of learner strategies on oral presentations: A comparison between group and individual performance. English for Specific Purposes, 30(4), 272–285. doi:10.1016/j.esp.2011.04.003
- Christianson, M., Hoskins, C., & Watanabe, A. (2009). Evaluating the effectiveness of a video-recording based self-assessment system fro academic speaking. Language Research Bulletin, 24, 1–15.
- Curtis, J. (1999). Using oral presentation to improve teaching, learning and assessment: A report into higher education practice. London: Middlesex University.
- De Grez, L. (2009). Optimizing the instructional environment to learn presentation skills (dissertation). Ghent, belgium: University of Leuven.
- De Grez, L., Valcke, M., & Berings, D. (2010). Student response system and learning oral presentation skills. Procedia - Social and Behavioral Sciences, 2(2), 1786–1789. doi:10.1016/j.sbspro.2010.03.985
- De Grez, L., Valcke, M., & Roozen, I. (2009). The impact of an innovative instructional intervention on the acquisition of oral presentation skills in higher education. Computers & Education, 53(1), 112–120. doi:10.1016/j.compedu.2009.01.005
- De Grez, L., Valcke, M., & Roozen, I. (2013). The differential impact of observational learning and practice-based learning on the development of oral presentation skills in higher education. Higher Education Research & Development, 33(2), 256–271. doi:10.1080/07294360.2013.832155
- Dragemark, A. (2006). Learning English for technical purposes: The LENTEC project. Hershey, PA: Idea Group Inc.
- Entwistle, N.J.M. (2009). The disposition to understand for oneself at university and beyond: Learning processes, the will to learn, and sensitivity to context. In L.F.S. Zhang, J. (Ed.), Perspectives on the nature of intellectual styles (pp. 29–62). New York: NY: Springer.
- Falchikov, N. (1995). Peer feedback marking: Developing peer assessment. Innovations in Education and Training International, 32(2), 175–187. doi:10.1080/1355800950320212
- Falchikov, N. (2001). Learning together: Peer tutoring in higher education. London: Routledge Falmer.
- Falchikov, N. (2005). Improving assessment through student involvement: Practical solutions for aiding learning in higher and further education. New York: RoutledgeFalmer.
- Jordan, L. (2012). Video for peer feedback and reflection: Embedding mainstream engagement into learning and teaching practice. Research in Learning Technology, 20(sup1), 19192. doi:10.3402/rlt.v20i0.19192
- Joughin, G. (2007). Student conceptions of oral presentations. Studies in Higher Education, 32(3), 323–336. doi:10.1080/03075070701346873
- Kolb, D.A. (1984). Experiential learning: Experience as the source of learning and development. Englewood Cliffs, NJ: Prentice-Hall.
- Leger, L.A., Glass, K., Katsiampa, P., Liu, S., & Sirichand, K. (2015). What if best practice is too expensive? Feedback on oral presentations and efficient use of resources. Assessment & Evaluation in Higher Education, 42(3), 329–346. doi:10.1080/02602938.2015.1109054
- Mandeville, D.S., Ho, T.K., & Valdez, L.A. (2017). The effect of problem based learning on undergraduate oral communication competency. Journal of College Teaching & Learning, 14, 1–10. doi:10.19030/tlc.v14i1.9957
- Metcalf, A., Layton, M.V., & Goslin, T.L. (2016). Three ways to improve student presentations. TESOL Journal, 7(2), 421–428. doi:10.1002/tesj.241
- Money, A., & Coughlan, J. (2016). Team-taught versus individually taught undergraduate education: A qualitative study of student experiences and preferences. Higher Education, 72(6), 797–811. doi:10.1007/s10734-015-9976-5
- Murphy, K., & Barry, S. (2015). Feed-forward: Students gaining more from assessment via deeper engagement in video-recorded presentations. Assessment & Evaluation in Higher Education, 41(2), 213–227. doi:10.1080/02602938.2014.996206
- Nash, G., Crimmins, G., & Oprescu, F. (2015). If first-year students are afraid of public speaking assessments what can teachers do to alleviate such anxiety? Assessment & Evaluation in Higher Education, 41(4), 586–600. doi:10.1080/02602938.2015.1032212
- Nicol, D.J., & Macfarlane-Dick, D. (2006). Formative assessment and self-regulated learning: A model and seven principles of good feedback practice. Studies in Higher Education, 31(2), 199–218. doi:10.1080/03075070600572090
- Pathak, A., & Le Vasna, M. (2015). Developing oral presentation competence in professional contexts: A design-based collaborative approach. International Journal of Evaluation and Research in Education, 4(4), 179–184.
- Quigley, B.L., & Nyquist, J.D. (1992). Using video technology to provide feedback to students in performance courses. Communication Education, 41(3), 324–334. doi:10.1080/03634529209378892
- R Core Team. (2013). R: A language and environment for statistical computing. Vienna, Austria: R foundation for Statistical Computing. Retrieved from http://www.R-protject.org/
- Ritchie, S.M. (2016). Self-assessment of video-recorded presentations: Does it improve skills? Active Learning in Higher Education, 17(3), 207–221. doi:10.1177/1469787416654807
- Sander, P., Sanders, L., & Stevenson, K. (2002). Engaging the learner: Reflections on the use of student presentations. Psychology Teaching Review, 10(1), 76–89.
- Schmidt, R., & Wrisberg, C. (2001). Motor learning and performance: A problem-based learning approach (2nd ed.). Illinois: Human Kinetics Publishers Inc.
- Sherin, M.G. (2004). New perspectives on the role of video in teacher education. Boston: Elsevier.
- Sinclair, S. (2016). The introduction and refinement of the assessment of digitally recorded audio presentations. Open Learning: the Journal of Open, Distance and e-Learning, 31(2), 163–175. doi:10.1080/02680513.2016.1190640
- Stefanidis, D., Korndorffer, J., Heniford, T., & Scott, D. (2007). Limited feedback and video tutorials optimize learning and resource utilization during laparoscopic simulator training. Surgery, 142(2), 202–206. doi:10.1016/j.surg.2007.03.009
- Suñol, J.J., Arbat, G., Pujol, J., Feliu, L., Fraguell, R.M., & Planas-Lladó, A. (2015). Peer and self-assessment applied to oral presentations from a multidisciplinary perspective. Assessment & Evaluation in Higher Education, 41(4), 622–637. doi:10.1080/02602938.2015.1037720
- Taylor, K.L., & Toews, S.V.M. (2009). Effective presentations: How can we learn from the experts? Medical Teacher, 21(4), 409–414. doi:10.1080/01421599979365
- van Ginkel, S., Gulikers, J., Biemans, H., & Mulder, M. (2016). Fostering oral presentation performance: Does the quality of feedback differ when provided by the teacher, peers or peers guided by tutor? Assessment & Evaluation in Higher Education, 42(6), 953–966. doi:10.1080/02602938.2016.1212984
- Vickerman, P. (2009). Student perspectives on formative peer assessment: An attempt to deepen learning? Assessment & Evaluation in Higher Education, 34(2), 221–230. doi:10.1080/02602930801955986
- Wen, M.L., & Tsai, -C.-C. (2006). University students’ perceptions of and attitudes toward (online) peer assessment. Higher Education, 51(1), 27–44. doi:10.1007/s10734-004-6375-8
Appendix A
Questionnaire employed after the 1st presentation
Title of Project: Does video feedback & peer observation offer a valid method of reinforcing oral presentation training for undergraduate biochemists?
Investigators: xxxxxxxxxxxxx, xxxxxxxxxxxx, xxxxxxxxxxx
Contact: [email protected]
This questionnaire is part of a pilot study aimed to investigate the perceived benefits of additional forms of feedback during undergraduate sessions on public speaking. Please fill out the questionnaire honestly and remember that all questionnaires or feedback will be treated anonymously.
Please circle the appropriate number (1 = No/disagree/poor → 5 = Yes/agree/excellent) which best reflects your opinion:
Have you any previous experience of public speaking? 1 2 3 4 5
Do you find public speaking difficult? 1 2 3 4 5
On a scale of 1 → 5 (where 1 = fully comfortable and 5 = anxious) how would you rate your experience during your recent formative presentation? 1 2 3 4 5
Did you feel that the theory lecture coupled with videos of ‘unacceptable’ vs ‘acceptable’ public speaking was useful as preparation for this task? 1 2 3 4 5
Did you find working in a group beneficial? 1 2 3 4 5
Did group working reduce any concerns you had regarding this task? 1 2 3 4 5
Did you find that watching how your fellow students performed gave you ideas on types of approach, delivery etc.? 1 2 3 4 5
Now that you have undertaken an undergraduate presentation, would you be better able to comment on another student’s presentation? 1 2 3 4 5
If your fellow students were provided the opportunity to rate your own performance (not counting towards grade) would you be happy with this as a method of feedback? 1 2 3 4 5
Would you be happy if this feedback were gathered anonymously? 1 2 3 4 5
Would you trust your fellow students’ opinions of your efforts? 1 2 3 4 5
Did you find the assessor feedback useful as a tool for enhancing your performance? 1 2 3 4 5
Would you like more feedback on your slide quality/layout? 1 2 3 4 5
Would you like more feedback on your diction? 1 2 3 4 5
Would you like more feedback on your body language? 1 2 3 4 5
Do you feel that watching your own performance would be a useful tool in improving your public speaking? 1 2 3 4 5
If video recording of your presentation was offered as a method of feedback would you take up the offer? 1 2 3 4 5
Would you appreciate a digital recording to keep for future reference? 1 2 3 4 5
Would you have any concerns if video was utilised as an optional method of feedback? 1 2 3 4 5
Would you appreciate a debriefing with a member of staff where your recorded presentation was the focus of discussion? 1 2 3 4 5
Thank you for taking part in this study.
Appendix B
Questionnaire employed after the 2nd presentation
Title of Project: Does video feedback & peer observation offer a valid method of reinforcing oral presentation training for undergraduate biochemists?
Investigators: xxxxxxxxxxxxx, xxxxxxxxxxxx, xxxxxxxxxxx
Contact: [email protected]
This questionnaire is part of a pilot study aimed to investigate the perceived benefits of additional forms of feedback during undergraduate sessions on public speaking. Please fill out the questionnaire honestly and remember that that all questionnaires or feedback will be treated anonymously.
Please circle the appropriate number (1 = No/disagree/poor → 5 = Yes/agree/excellent) which best reflects your opinion:
On a scale of 1 → 5 (where 1 = fully comfortable and 5 = anxious) how would you rate your experience during your recent summative presentation? 1 2 3 4 5
Did you find working in a pair beneficial? 1 2 3 4 5
Did pair working reduce any concerns you had regarding this task? 1 2 3 4 5
Did you find that watching how your fellow students performed gave you ideas on types of approach, delivery etc.? 1 2 3 4 5
Now that you have undertaken two undergraduate presentations, are you be better able to comment on another’s efforts? 1 2 3 4 5
As your fellow students were provided the opportunity to rate your own performance (not counting towards grade) are you be happy with this as a method of feedback? 1 2 3 4 5
Do you trust your fellow student’s opinions of your efforts? 1 2 3 4 5
Has a peer’s feedback provided any useful tips or hints that you will utilise in future presentations? 1 2 3 4 5
Has feedback from your fellow students provided information not normally encountered within assessor feedback? 1 2 3 4 5
Areas of potential improvement highlighted by the student feedback included: - Talk Content 1 2 3 4 5
– Slide style 1 2 3 4 5
–Body language 1 2 3 4 5
–Diction 1 2 3 4 5
Has the student feedback assisted my learning for future presentations? 1 2 3 4 5
Did you find the assessor feedback useful as a tool for enhancing your performance?1 2 3 4 5
Do you rate the assessor’s feedback as being more valid than that of your fellow students? 1 2 3 4 5
Did you take up the opportunity to visually record your own performance?1 2 3 4 5
If not, do you now wish you had recorded your presentation? 1 2 3 4 5
Did you keep the recording of your performance as future reference? 1 2 3 4 5
If so, will you utilise it as a revision aid before future presentations? 1 2 3 4 5
Do you have any concerns now that video was utilised as an opt-in method of feedback? 1 2 3 4 5
Did watching your own performance highlight areas of potential improvement? 1 2 3 4 5
Areas of potential improvement highlighted by the video-recording included: - Talk Content 1 2 3 4 5
–Slide style 1 2 3 4 5
–Body language 1 2 3 4 5
–Diction 1 2 3 4 5
Has visually recording your presentation been useful in preparing yourself for future presentations? 1 2 3 4 5
If you were offered the choice, would you be willing to record future presentations on your smartphone? 1 2 3 4 5
Would you have concerns of other students misusing your image should they be permitted to record future presentations on their smartphone? 1 2 3 4 5
Do you feel that these more interactive forms of feedback have led you to engage with the task in a deeper way than you would have otherwise? 1 2 3 4 5
Now that you have acted as a source of feedback for others, do you feel you understand the assessor’s role to a greater extent? 1 2 3 4 5
Do you have a better appreciation of the impact of anonymous feedback on a person? 1 2 3 4 5
Would you recommend that the following methods of feedback be incorporated into in to year 2 assessed presentations?
–Peer marking by fellow students 1 2 3 4 5
–Video recording 1 2 3 4 5
Thank you for taking part in this study.