
 ?Mathematical formulae have been encoded as MathML and are displayed in this HTML version using MathJax in order to improve their display. Uncheck the box to turn MathJax off. This feature requires Javascript. Click on a formula to zoom.
ABSTRACT
Metric structure cues important moments, which can guide attention across time. Supporting this, metric strength improves performance and modulates early auditory processing. It is unclear whether the early effects of metric strength rely on stimulus cues, or if they also occur during entirely subjective metric listening. Here, we assess ERP responses to physically identical tones at subjectively strong and weak moments in an imagined metric structure. Isochronous tone streams at two rates were perceived as repeating subjective groups of either three or four beats, with listening pattern indicated by a visual cue prior to trial start. ERP responses to tones were compared among subjective beat positions and rates separately by listening pattern. Subjectively strong group-initial tones elicited a more negative auditory N1 response and a late metric negativity (LMN; 250–450 ms) under all conditions. Comparisons among metrically weaker beats suggested hierarchical listening, a sustained negativity prior to group onset, and a posterior positivity to group-initial tones. These results demonstrate that metric attentional modulation of early auditory processing occurs when metric structure is entirely subjective, suggesting that temporal attention is integral to metric perception. Further, subjective metric processing draws on multiple additional neurocognitive mechanisms indexed by scalp ERP responses.
Introduction
Temporal predictability in complex auditory streams like speech and music can facilitate processing, guiding attention to moments likely to contain important information (Nobre & Van Ede, Citation2018). A primary aspect of temporal organization in both speech and music is meter, i.e., the orderly, hierarchical organization of stress across time (Cooper & Meyer, Citation1960; Kiparsky, Citation1975). Although metric organization is not identical across speech and music, a key point of overlap is that inter-stress intervals are regularized in both domains (Dauer, Citation1983; Patel, Citation2008), creating temporal predictability. This predictability provides cues to important moments, which could be used by perceptual systems to predictively allocate resources (i.e., selectively attend) to these moments to maximize information extraction (e.g., Jones, Citation1976; Jones & Boltz, Citation1989; Large & Jones, Citation1999).
Supporting this idea, listeners are both faster to identify phonemes and more disrupted by mispronunciations on stressed syllables than unstressed syllables during speech perception (Cason & Schön, Citation2012; Mattys & Samuel, Citation1997; Pitt & Samuel, Citation1990; Shields, McHugh, & Martin, Citation1974). Additionally, sensitivity to hierarchical stress in complex sounds and the acoustic correlates thereof is disrupted in children and adults with developmental dyslexia (Goswami et al., Citation2013; Huss, Verney, Fosker, Mead, & Goswami, Citation2011; Leong, Hämäläinen, Soltész, & Goswami, Citation2011), and in children with developmental language disorder (Corriveau, Pasquini, & Goswami, Citation2007; Richards & Goswami, Citation2015, Citation2019). By better understanding the neurocognitive mechanisms underlying meter perception, we can therefore gain insights into the complex relationship between selective attention and speech perception, and potentially into atypical language development. However, metric structure in speech is often correlated with other linguistic elements, including syntactic and phrasal structure (Kiparsky, Citation1975); to disentangle metric perception from these and other linguistic processes, it is important to examine metric perception under simpler, nonlinguistic conditions that do not contain the same confounding structural elements. The current study does so by comparing ERP responses to physically identical tones in the structurally simplest metric context: imagined metric hierarchies imposed on completely undifferentiated isochronous streams.
Behavioral Facilitation by Metric Strength in Nonlinguistic Contexts
Much work has demonstrated facilitated responses to events at metrically strong times in nonlinguistic contexts, which may indicate attention is allocated to these times. For example, melodic rule violations are better detected at accented moments in a binary hierarchy (Jones, Boltz, & Kidd, Citation1982), probe beats are judged as fitting better (and better remembered) at metrically strong times (Palmer & Krumhansl, Citation1990), and both intensity and duration deviants are more accurately detected at metrically strong times (Repp, Citation2010). Further, responses to visual targets occurring at the same time as metrically strong beats in an unrelated auditory stimulus are also facilitated (Bolger, Coull, & Schön, Citation2014; Bolger, Trost, & Schön, Citation2013; Escoffier, Sheng, & Schirmer, Citation2010), suggesting that the behavioral facilitation imparted by metric strength involves attention to time itself rather than to event structure within a single modality. While behavioral facilitation likely indicates that metrically strong times are relatively more attended than metrically weak times, overt responses have limited ability to determine the time-course of cognitive processing. In the current study, covert recording of neural responses provides information about the cognitive dynamics associated with processing metric strength, while behavior provides confirmation of performing the task.
Neural Responses to Metric Strength
A large body of research has demonstrated differentiable neural responses to events occurring at metrically strong compared to metrically weak times. Studies employing the steady-state evoked potential method (e.g., Nozaradan, Peretz, Missal, & Mouraux, Citation2011) show increased neuroscillatory activity at the beat and meter frequencies when perceiving a metric rhythm, both when the metric structure is inherent to the perceived stimulus (Nozaradan, Peretz, & Mouraux, Citation2012) and when it is imagined by the perceiver (Nozaradan et al., Citation2011). This neural differentiation between levels of metric strength is evident in auditory and visual modalities (Celma-Miralles, De Menezes, & Toro, Citation2016), and has been reported in infants as young as seven months old (Cirelli, Spinelli, Nozaradan, & Trainor, Citation2016), suggesting that tracking metric structure may be a fundamental skill. However, multiple overlapping effects will contribute to the peaks in the frequency spectrum as long as they regularly track the meter level frequency, such that these measurements do not clearly differentiate between perceptual and post-perceptual processing.
Studies employing event-related designs have been able to further characterize the neural response to metric strength by assessing the time-course over which metric processing occurs. The current study employs this advantageous approach because it allows for isolating the effects of attention on early auditory processing from other cognitive mechanisms involved in metric processing. Event-related studies of metric processing have employed several paradigms and analysis approaches revealing different neural effects of metric strength, but these effects can be broadly organized into three categories: effects of metric strength on deviant stimulus processing (e.g., Brochard, Abecasis, Potter, Ragot, & Drake, Citation2003; Ladinig, Honing, Háden, & Winkler, Citation2009), negativities around moments of metric strength (Fitzroy & Sanders, Citation2015; Potter, Fenwick, Abecasis, & Brochard, Citation2009; Schaefer, Vlek, & Desain, Citation2011; Vlek, Schaefer, Gielen, Farquhar, & Desain, Citation2011), and modulation of perceptual processing by metric strength (Abecasis et al., Citation2009; Escoffier, Herrmann, & Schirmer, Citation2015; Fitzroy & Sanders, Citation2015; Schaefer et al., Citation2011; Vlek et al., Citation2011). The current study focuses on the modulation of responses to non-deviant sounds (i.e., the latter two categories) by subjective metric strength, because deviant sound processing draws on reactive processes such as attentional capture (e.g., Schröger & Wolff, Citation1998) which can obscure the effects of predictive attentional allocation. However, the effects of metric strength on deviant stimulus processing are also briefly reviewed here first for context.
Effects of Metric Strength on Deviant Sound Processing
When deviant target sounds occur within a metric hierarchy, they elicit larger P300-like positivities at metrically strong times than at metrically weak times (Abecasis, Brochard, Granot, & Drake, Citation2005; Brochard et al., Citation2003; Jongsma, Desain, & Honing, Citation2004; Potter et al., Citation2009; Vuust, Ostergaard, Pallesen, Bailey, & Roepstorff, Citation2009). The P300 is a positivity with peak latency around 300 ms, elicited by targets across a variety of contexts (Polich & Kok, Citation1995). The P300 strength effect is larger in musicians (Brochard et al., Citation2003; Jongsma et al., Citation2004; Vuust et al., Citation2009), in more temporally predictable sequences (Bouwer, Werner, Knetemann, & Honing, Citation2016), and when metric strength occurs at a time predicted to be metrically weak (Geiser, Sandmann, Jäncke, & Meyer, Citation2010). These findings suggest that the P300 elicited by events at metrically strong times is at least in part indexing predictive processes, which could include predictive attentional allocation. However, Bouwer et al. (Citation2016) show larger P300-like responses to non-target deviants at metrically strong compared to weak times during both attentive and passive listening, suggesting some attention-independence of the P300 metric strength effect.
Deviant sounds and omissions also elicit negativities in the 100–250 ms time range that are larger at metrically strong times than metrically weak times. Most authors have interpreted this effect as a mismatch negativity (MMN) due to its observation to non-target stimuli during distracted or passive listening (Bouwer & Honing, Citation2015; Bouwer, Van Zuijen, & Honing, Citation2014; Bouwer et al., Citation2016; Geiser et al., Citation2010; Ladinig et al., Citation2009; Vuust et al., Citation2005; Zhao & Kuhl, Citation2016; Zhao, Lam, Sohi, & Kuhl, Citation2017); the MMN is a non-attention-dependent response to changes in auditory sequences (Näätänen, Paavilainen, Rinne, & Alho, Citation2007). Other studies employing active listening designs have distinguished between MMN and N2b (Bouwer et al., Citation2016), a component observed to unexpected stimuli under attentive conditions only (Näätänen & Picton, Citation1986), or remained agnostic as to whether the early negativity is an MMN or N2b (Geiser, Ziegler, Jancke, & Meyer, Citation2009). The N2b strength effect reported by Bouwer et al. (Citation2016) was present in both isochronous and jittered rhythms and larger in the isochronous condition, whereas the MMN strength effect was present for isochronous rhythms only. Together, the effects of metric strength on the P300-like positivity and early negativities elicited by deviants in rhythmic sequences indicate multiple cognitive processes are involved in metric perception, some of which are influenced by attention to a greater extent than others.
Negativities following Metrically Strong Standard Sounds
Event-related designs have also been employed to characterize the time-course of processing differences among standard (i.e., non-deviant) sounds presented at differing levels of metric strength. Several such studies demonstrate that non-target standard sounds occurring at metrically strong times elicit a frontal negativity between 200 and 500 ms relative to those occurring at metrically weak times (Fitzroy & Sanders, Citation2015; Potter et al., Citation2009; Schaefer et al., Citation2011; Vlek et al., Citation2011). This late metric negativity (LMN) is sometimes larger over the left hemisphere (Fitzroy & Sanders, Citation2015; Potter et al., Citation2009), and is similar when evoked by phenomenal and imagined metric accent (Schaefer et al., Citation2011; Vlek et al., Citation2011). Thus, an LMN is anticipated in response to subjectively stronger beats in the current study, in which no deviant tones are present. When evoked by notes in short novel melodies, the LMN is larger at faster tempi and for notes later in the melody (Fitzroy & Sanders, Citation2015), suggesting the processes underlying the LMN may be supported by a more reliable metric percept. When evoked by imagined metric grouping of metronome clicks, i.e., subjective rhythmization, the LMN is larger when comparing a strong beat to the following weak beat than to the preceding weak beat (Schaefer et al., Citation2011). The cognitive mechanisms indexed by the LMN are unknown, other than it is involved in recognizing or processing metric strength. The LMN has only been reported in studies involving attentive listening to the eliciting stimulus, suggesting that the LMN may be attention-dependent, though the relatively long latency of the LMN suggests that it does not index the effects of selective attention on auditory processing directly.
Modulation of Perceptual Processing by Metric Strength
In addition to eliciting an LMN, metric strength modulates perceptual processing of standard sounds. During attentive listening, metrically strong sounds elicit a more positive P2 between 150 and 190 ms (Fitzroy & Sanders, Citation2015), and an increased positivity over the N1/P2 time window (100–250 ms) in similar ways when metric accent is phenomenal and imagined (Schaefer et al., Citation2011; Vlek et al., Citation2011), suggesting that auditory processing is modified by metric strength. The effects of metric strength on the P2 are context-dependent; the P2 strength effect reported by Fitzroy and Sanders (Citation2015) interacted with presentation tempo, early/late occurrence in a melody, and musical expertise. Additionally, using magnetoencephalography (MEG), Abecasis and colleagues (2009) observed a larger M2 response between 140 and 210 ms to standards presented at metrically strong times during distracted listening. Given its latency and evoking conditions, the magnetic M2 observed by Abecasis et al. (Citation2009) is likely equivalent to the electric P2 of the obligatory cortical auditory evoked potentials (Pantev, Lütkenhöner, Hoke, & Lehnertz, Citation1986). Although the modulation of the P2 strength effect by local context suggests some attentional dependence, the observation of an M2 strength effect during distracted listening indicates that the metric strength-related processes indexed by P2/M2 are not entirely attention-dependent.
The effects of metric strength further extend to early auditory processing of non-target standard sounds, more clearly indicating that attention is selectively allocated to metrically strong times. Metrically strong notes in rapidly presented melodies elicit more negative N1 responses over left anterior scalp between 90 and 120 ms than physically identical metrically weak notes (Fitzroy & Sanders, Citation2015), in a manner distinct from both the LMN and P2 effects of metric strength. Increased negativity of the auditory N1 evoked by the same physical sound in different contexts (e.g., metrically strong vs. metrically weak) is a highly specific index of attentional allocation (Hillyard, Hink, Schwent, & Picton, Citation1973), providing electrophysiological support for the dynamic attending theory claim that attention is allocated to metrically strong times (e.g., Jones, Citation1976; Jones & Boltz, Citation1989; Large & Jones, Citation1999). The N1 effect of metric strength is not dependent on musical experience, indicating that the allocation of attention to metrically strong times is integral to metric perception (Fitzroy & Sanders, Citation2015). The early processing benefits imparted by metric attention extend to the visual modality, which may underlie the cross-modal behavioral facilitation observed at metrically strong times; images presented at metrically strong times in an concurrent auditory rhythm evoke a more negative visual N1 between 150 and 170 ms than images presented at out-of-rhythm times or in silence (Escoffier et al., Citation2015). Visual N1 amplitude is an index of visual selective attention, though not the earliest in ERP waveforms (Mangun & Hillyard, Citation1987).
Under unattended conditions (i.e., passive listening while watching a silent movie), metrically strong sounds in a subjective hierarchy also elicit a more positive P1 between 43 and 84 ms compared to metrically weak sounds, but do not elicit a more negative N1 (Bouwer & Honing, Citation2015). The passive listening paradigm indicates that this P1 metric strength effect is not attention-dependent. However, P1 amplitude under similar passive listening conditions is linked to rhythmic congruency and synchronization ability (Tierney & Kraus, Citation2013; Woodruff Carr, Fitzroy, Tierney, White-Schwoch, & Kraus, Citation2017), suggesting pre-attentive awareness of rhythm and meter does have effects on early processing. Nonetheless, the absence of an N1 strength effect during passive listening is consistent with the interpretation of the N1 strength effect as modulation of early auditory processing by attentional allocation to metrically strong times.
Early Processing Effects of Subjective Metric Strength
It is unclear whether subjective metric strength guides attention across time in a manner that modulates early auditory processing (i.e., the N1 strength effect) in the same way as metric strength cued by stimulus features. Determining whether early auditory processing is modulated by attention to metrically strong times in subjective hierarchies can clarify whether prior evidence of attentional allocation to metric strength in melodies represents cognitive mechanisms related to meter detection and tracking, or maintenance of an established metric percept. Although an early negativity between 0 and 100 ms to subjectively strong tones during attentive listening is reported by Potter et al. (Citation2009), presence of that effect at stimulus onset prevents distinguishing attentional modulation of early auditory responses (i.e., N1) from preparatory neural responses such as the contingent negative variation (CNV; see Kononowicz & Penney, Citation2016 for review). Moreover, a CNV-like response anticipating metrically strong sounds is reported from −20 to 20 ms around sound onset during passive listening by Bouwer and Honing (Citation2015), indicating that anticipatory neural processing occurs prior to metrically strong times in a non-attention-dependent manner. Studies of neuroscillatory dynamics provide further evidence that preparatory processing occurs prior to metrically strong times. Non-phaselocked (i.e., induced) event-related activity in the beta (20–30 Hz) frequency band peaks at stimulus onset for metrically strong sounds (Snyder & Large, Citation2005), suggesting a ramping up of this activity prior to stimulus occurrence. In the current study, preparatory responses could be evident in response to weak beats that are equivalent in the metric hierarchy, but differ in temporal proximity to upcoming strong beats.
Conversely, phaselocked (i.e., evoked) event-related activity in the beta band peaks after stimulus onset, and increases 100 ms after metrically accented tones in a similar fashion for imagined and phenomenal accent (Iversen, Repp, & Patel, Citation2009). The latency of the evoked beta response to metric strength observed by Iversen et al. (Citation2009) suggests that it may index early attentional modulation of auditory processing, similar to the N1 strength effect reported by Fitzroy and Sanders (Citation2015). However, Iversen and colleagues’ reported lack of effect in the 100 ms time window for the broadband evoked response suggests that the evoked beta and N1 strength effects are dissociable, and may therefore index different cognitive mechanisms. Nonetheless, other evidence suggests these effects may share neural generators; event-related beta-band activity filtered in the source domain using a model of N1 neural generators reveals greater beta desynchronization 200 ms after metrically strong compared to metrically weak sounds (Fujioka, Ross, & Trainor, Citation2015). Like the evoked beta response observed by Iversen et al. (Citation2009), this effect was similar for imagined and phenomenal metric accent. The timing of the beta desynchronization strength effect differed from the N1 latency (100–130 ms) reported in the same study however, so despite evidence of shared generators it remains unclear whether this beta strength effect indexes attention-driven enhancement of the typical N1 response. In a separate paradigm, Fujioka, Zendel, and Ross (Citation2010) show increased activation in left Heschl’s gyrus, a contributor to both P1 and N1 responses (CitationLiégeois-Chauvel, Musolino, Badier, Marquis, & Chauvel, 1994; CitationVaughan Jr. & Ritter, 1970), as early as 40 ms following metrically strong beats in a subjective hierarchy. This effect could indicate a role for attentional modulation of early auditory processing by subjective metric strength, but it could alternatively represent an attention-independent P1 effect similar to that reported by Bouwer and Honing (Citation2015). In the current study, the direct investigation of the N1 ERP component separately from the P1 can be used to disambiguate these interpretations.
The Current Study
In the present study, we compared ERP responses to subjectively strong and weak tones in imagined metric hierarchies imposed on undifferentiated isochronous tone streams. The use of attended listening to physically identical, isochronously presented stimuli with no deviants or phenomenal accent cues optimized conditions for observing attentional modulation of early auditory processing as indexed by the N1 component, without interference from a concurrent MMN effect. Based on previous work examining the effects of metric strength on neural responses to attended standard sounds, we predict subjective metric strength will evoke at least two differentiable ERP responses: an increase in N1 negativity, and an increased negativity 250–450 ms after sound onset (i.e., LMN). Specifically, we predict that metrically strong tones will elicit a more negative anterior N1 than physically identical weak tones, which would clearly indicate that subjective metric strength guides attentional allocation to metrically strong times, and an LMN. We focus our hypotheses on the N1 and LMN strength effects because they are only observed during attentive listening, which maximizes the opportunity for predictive attentional allocation, unlike other ERP effects of metric strength (P2, P1, CNV) which have also been observed during passive listening.
Additionally, we investigate two metric listening patterns, ternary (metric groups of three) and quaternary (metric groups of four), at two different rates to assess the specificity of the N1 and LMN strength effects, and to facilitate comparisons among weak beats preceding and following metric strength. Assessing the N1 and LMN strength effects at different rates during directed subjective metric listening is critical for determining whether the rate specificity of the N1 and LMN strength effects we previously observed for stimulus-inherent meter (Fitzroy & Sanders, Citation2015) reflects fundamental limits of metric listening, or probabilistic constraints during natural metric listening. Based on our prior findings (Fitzroy & Sanders, Citation2015), we predict that the N1 and LMN responses will be larger when stimuli are presented more rapidly, but will not differ between ternary and quaternary metric hierarchies. Lastly, given prior evidence of differential responses among metrically weak beats that do and do not immediately precede a metrically strong beat (Fujioka et al., Citation2015; Schaefer et al., Citation2011), we predict that amplitude in the N1 and LMN time windows will differ among metrically weak beats.
Materials and Methods
Participants
Twenty-three young adults (18–24 years old, M = 20.65, SD = 1.75; 14 females) provided the data included in analyses. All participants were right-handed, native English speakers recruited from the University of Massachusetts, Amherst student population with normal hearing, normal or corrected vision, and no known neurological conditions, who had not taken any psychoactive medications within the prior six months. Data from an additional eight adults were collected but excluded from analyses due to poor performance on the behavioral task (n = 4), misunderstanding of the behavioral task (n = 2), recording equipment malfunction (n = 1), or failure to complete the EEG data collection session (n = 1).
Although musical expertise was not an experimental factor in the current study, we did collect information regarding musical experience. Participants who provided data included in analyses varied in musical experience from naïve to musically trained. Participants had 0–14 years of experience on their primary musical instrument (M = 5.85, SD = 4.46), and had taken 0–12 years of individual or group lessons on their primary instrument (M = 3.39, SD = 3.54). Fourteen of the 23 reported having no formal training in music theory, five had completed high-school level theory, and four had completed at least one college-level theory course. Raw tonal subscores on the Advanced Measures of Music Audiation (AMMA; Gordon, Citation1989) ranged from 20 to 32 (M = 25.61, SD = 3.41), raw rhythmic subscores on the AMMA ranged from 21 to 33 (M = 28.61, SD = 2.95).
Stimuli
The stimuli were isochronous tone streams consisting of repeated presentations of a 50 ms, 1000 Hz pure tone with 5 ms onset and offset ramps. This tone was stored as a single-channel 16-bit PCM format WAV audio file with a 44.1 kHz sampling rate and 5 ms of initial silence. The tone was presented at two rates: fast tempo (SOA = 450 ms; 2. Hz; 133.
beats per minute [bpm]) and slow tempo (SOA = 625 ms; 1.6 Hz; 96 bpm).
Procedure
After providing informed consent, participants answered questions about demographics and musical experience. Musical aptitude was assessed using a computer-based self-administered version of the AMMA test (Gordon, Citation1989; Gordon & Alvey, Citation2008). Participants were then moved to a different testing room where they were fitted with a 128-channel electrode net (EGI, Eugene, OR) for recording EEG and given instructions. The entire experiment took approximately two hours to complete.
During each approximately one-minute long trial participants were instructed to listen to an isochronous stream of tones as either repeating groups of three (ternary meter), or repeating groups of four (quaternary meter), while maintaining fixation at the center of a computer screen. Participants were specifically instructed to try to “feel” the tone stream in groupings of three or four without counting along out loud or internally, and to avoid any actual or imagined rhythmic motion (e.g., head nodding, foot tapping, finger tapping) during listening. Each participant completed 10 trials for each combination of metric listening pattern (ternary, quaternary) and presentation tempo (fast, slow), resulting in a total of 40 trials. Trials were presented in a different randomized order for each participant.
Each trial consisted of three sections: 1) entrainment, 2) listening, and 3) response. During the entrainment section the fixation marker increased in size with the onset of each tone and returned to its original size after 100 ms. This size increase was larger on the first tone of each intended group of three or four, indicating the intended phase of the instructed listening pattern. A visual cue to metric phase was used rather than an auditory cue to preclude possible echoic memory-driven effects on auditory processing of metrically strong tones. The entrainment section lasted for six beat groups, equivalent to 18 beats in the ternary condition and 24 beats in the quaternary condition. At the onset of the first tone in the seventh beat group, the fixation marker increased in size and did not return to its original size, indicating the listening section had begun.
During the listening section participants internally maintained the repeating pattern of beat groups indicated during the entrainment section. Participants pressed a button if they lost track of the listening pattern at any time during the listening section. Listening sections lasted between 30 and 31.05 seconds (48–69 beats), depending on metric listening pattern and presentation tempo. At the onset of a randomly chosen beat within the five beats following the listening section, the fixation marker changed color from white to green to indicate the beginning of the response section. Response section start time was randomized to avoid reminding the participants of the intended metric listening phase before assessing their accuracy in maintaining the metric pattern.
During the response section participants pressed a button along with the first beat in each subjective beat group. The trial ended after the participant had responded three times. Trials were considered correct if 1) the participant did not indicate losing track of the listening pattern at any time, and 2) all three responses during the response section were associated with the first beat of a group in the instructed listening pattern. To account for predictive responses, a response was considered associated with a given tone if it occurred between 100 ms prior to that tone onset and 200 ms prior to the following tone onset. Number of correct trials (out of 40) are reported, and were subjected to a two-way within-subjects ANOVA with the factors metric listening pattern (Meter: ternary, quaternary) and presentation tempo (Tempo: fast, slow).
EEG Recording and Analysis
Vertex-referenced EEG was recorded using a 128-channel geodesic electrode net (EGI, Eugene, OR) at a sampling rate of 500 Hz with a bandpass of 0.1–200 Hz. EEG processing and quantification were completed using EEGLAB (Delorme & Makeig, Citation2004) and ERPLAB (Lopez-Calderon & Luck, Citation2014) within MATLAB (The Mathworks, Inc.). Only correct trials were included in EEG analyses. Continuous EEG recorded during the listening section of each correct trial was filtered using a 60 Hz Parks-McClellan notch filter, then segmented into 700 ms epochs starting 100 ms prior to each tone onset. Epochs were baseline-corrected to the 100 ms prior to tone onset during segmentation. Epochs containing eyeblinks, eye movements, or other artifacts were automatically detected and excluded from further analyses as follows: eyeblinks were defined as peak-to-peak voltage change ≥ 150 μV within a 200 ms moving window (50 ms step) over vertical electrooculogram (EOG) channels, eye movements were defined as step-like voltage change ≥ 100 μV within a 400 ms moving window (50 ms step) over horizontal EOG channels, and other artifacts were defined as voltage exceeding ±170 μV at any recorded channel any time during the epoch. Artifact-free epochs from the listening sections of correct trials were averaged separately at each electrode for each participant by instructed metric listening pattern, presentation tempo, and ordinal position in the intended beat group. This resulted in at least 75 epochs per average for fast quaternary beats (M = 119.6, SD = 23.3), at least 72 epochs per average for fast ternary beats (M = 135.3, SD = 44.2), at least 52 epochs per average for slow quaternary beats (M = 89.4, SD = 20.5), and at least 30 epochs per average for slow triple beats (M = 114.1, SD = 27.5). Averaged waveforms were re-referenced to the average of the two mastoid electrode recordings. Prior work and visual inspection of the averaged waveforms indicated that 80–115 ms was the narrowest time window to characterize the auditory N1 waveform for all participants, and that 250–450 ms was an appropriate time window for characterizing the LMN.
Mean amplitude during the N1 and LMN time windows was measured at 81 electrodes distributed broadly across the scalp, then averaged into 9 groups of 9 electrodes each, arranged in a grid with 3 levels of electrode laterality and 3 levels of electrode anteriority. Mean amplitudes were entered into separate linear mixed-effects models for each combination of time window and metric listening condition (ternary, quaternary). Each model included the within-participant factors ordinal position in the intended beat group (Beat: 1, 2, 3 or 1, 2, 3, 4), presentation tempo (Tempo: fast, slow), electrode laterality (LR: left, medial, right), and electrode anteriority (AP: anterior, central, posterior), and all interactions between these factors, as fixed effects, and participant as a random effect.
Beat position was coded with a set of k – 1 orthogonal planned contrasts comparing levels of metric strength within each metric listening condition. For ternary listening, beat position was coded with one contrast comparing metrically strong to metrically weak beats (beat one vs. beats two and three), and one contrast comparing metrically weak beats that immediately precede a strong beat (beat three) to those that do not (beat two). For quaternary listening, beat position was coded with one contrast comparing metrically strong to potentially metrically intermediate beats (beat one vs. beat three), one contrast comparing potentially metrically intermediate to metrically weak beats (beat three vs. beats two and four), and one contrast comparing metrically weak beats that immediately precede a strong beat (beat four) to those that do not (beat two). The distinction between metrically strong and intermediate beats in the quaternary contrasts allowed us to account for the possibility that participants spontaneously subdivided their subjective groups of four into two groups of two (leading to primary stress on beat one and secondary stress on beat three), given prior evidence that quaternary meter is represented as temporally nested binary groupings in some individuals (Palmer & Krumhansl, Citation1990). In all models, electrode laterality and anteriority were coded with linear and quadratic contrasts to capture topographic change along the left-right/anterior-posterior axes and the lateral-medial/distal-central axes, respectively.
We report all main effects of ordinal beat position, and any interactions of ordinal beat position with presentation tempo, electrode laterality, or electrode anteriority. Significant interactions involving an ordinal beat position contrast and presentation tempo were followed-up with separate models for each tempo. If no main effect of an ordinal beat position contrast was observed but significant interactions involving that beat contrast and electrode position contrasts were observed, those interactions were followed-up with separate models for each level of the interacting electrode position factor. Statistical analyses were conducted in R (R Core Team, Citation2015; RStudio Team, Citation2014), using packages lme4 (Bates, Mächler, Bolker, & Walker, Citation2015), lmerTest (Kuznetsova, Brockhoff, & Christensen, Citation2017), reshape2 (Wickham, Citation2007), ggplot2 (Wickham, Citation2016), corrplot (Wei, Citation2013), and ez (Lawrence, Citation2013).
Results
Behavioral
Performance was accurate overall; participants responded correctly, meaning they both never indicated losing track of the listening pattern and also provided three responses associated with the instructed first beat during the response section, on 33.43 of 40 trials (SD = 4.92). Participants performed better on quaternary meter trials than ternary meter trials, F(1,22) = 13.94, p = 0.001. Additionally, performance was better on slow trials than fast trials, F(1,22) = 11.30, p = 0.003, especially for ternary listening (Meter x Tempo: F(1,22) = 6.24, p = 0.020). The main effect of tempo may reflect that there were fewer beats in the listening phase of slow trials, and therefore fewer opportunities to lose track of the entrained grouping. The interaction of tempo and listening pattern may reflect that performance was often at ceiling for both fast and slow quaternary meter trials.
ERPs: Ternary Meter
Strong Vs. Weak Beats
The hypothesis that listeners direct temporally selective attention to subjectively strong times in a manner that modulates early auditory processing predicts a larger N1 over anterior scalp for the first beat in subjective three-beat groups, compared to the second and third beats. Consistent with this prediction, beat one elicited a more negative N1 than beats two and three over the entire scalp, β = −0.279, t = −11.760, p < 0.001 (). The anteriority of this increased N1 negativity for beat one was modulated by tempo (Beat1vs23 x APlin x Tempo: β = 0.163, t = 2.795, p = 0.005; ). Follow-up comparisons by tempo demonstrated that on fast trials the increased N1 negativity for beat one was largest at medial central electrodes (Beat1vs23: β = −0.279, t = −12.724, p < 0.001; Beat1vs23 x LRquad: β = 0.175, t = 4.607, p < 0.001; Beat1vs23 x APquad: β = 0.116, t = 3.063, p = 0.002), but on slow trials this increased N1 negativity was largest at medial-left anterior electrodes (Beat1vs23: β = −0.240, t = −10.025, p < 0.001; Beat1vs23 x LRquad: β = 0.151, t = 3.641, p < 0.001; Beat1vs23 x LRlin: β = 0.106, t = 2.557, p = 0.011; Beat1vs23 x APlin: β = 0.141, t = 3.405, p = 0.001).
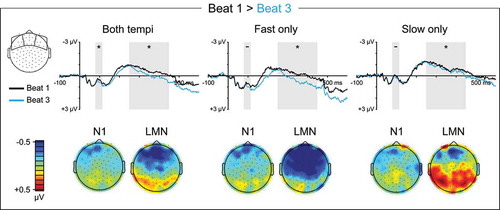
Figure 1. Ternary meter ERP measures. Left: Topographical scalp distributions of mean amplitude within the N1 (80–115 ms) and LMN (250–450 ms) time windows averaged across ordinal beat position. In the scalp map only, N1 amplitude is plotted using P1 amplitude (58–62 ms) as a baseline. Right: Mean amplitudes within the N1 (80–115 ms) and LMN (250–450 ms) time windows for each ordinal beat position, averaged across the entire scalp. Error bars represent standard errors across participants
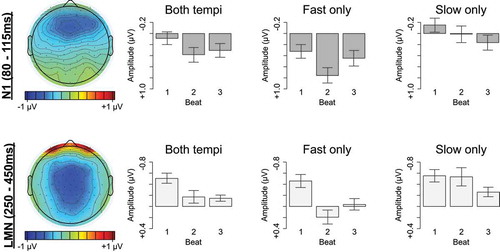
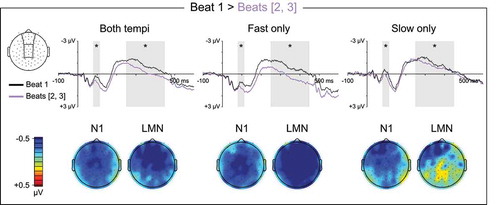
Figure 2. Ternary meter ERPs, strong vs. weak beats. Top: Grand average ERPs elicited by metrically strong beat one and metrically weak beats two and three. ERP waveforms are shown averaged over medial anterior and central electrode sites. ERPs to beats two and three were calculated separately and then averaged across beat such that they are weighted equally in the waveforms, as they are in statistical analyses. The N1 (80–115 ms) and LMN (250–450 ms) time windows are highlighted, and beat position main effect significance is indicated for each time window (* = p < 0.05, ns = p ≥ 0.05, – = test not motivated by higher-order tempo interaction). Bottom: Topographical contrast maps show the scalp distributions of beat one vs. beats two and three mean amplitude differences within the N1 and LMN time windows. All contrast maps are plotted using the same color axis range
During ternary listening, metrically strong beat one also elicited an LMN between 250 and 450 ms relative to weaker beats two and three over the entire scalp, β = −0.538, t = −20.385, p < 0.001 (). The LMN to beat one was larger on fast trials, β = 0.382, t = 10.246, p < 0.001. Follow-up comparisons by tempo demonstrated that on fast trials the LMN was largest at medial-right central and anterior electrodes (Beat1vs23: β = −0.538, t = −22.276, p < 0.001; Beat1vs23 x LRquad: β = 0.313, t = 7.485, p < 0.001; Beat1vs23 x LRlin: β = −0.122, t = −2.910, p = 0.004; Beat1vs23 x APquad: β = 0.193, t = 4.612, p < 0.001; Beat1vs23 x APlin: β = 0.115, t = 2.747, p = 0.006), and on slow trials the LMN was largest at left anterior electrodes (Beat1vs23: β = −0.156, t = −5.878, p < 0.001; Beat1vs23 x LRlin: β = 0.109, t = 2.370, p = 0.018; Beat1vs23 x APquad: β = −0.113, t = −2.468, p = 0.014; Beat1vs23 x APlin: β = 0.166, t = 3.624, p < 0.001).
Metrically Weak Beats
During ternary listening, the responses to metrically weak beats three and two differed in a tempo-dependent manner in both the N1 time window (Beat3vs2: β = −0.311, t = −11.330, p < 0.001; Beat3vs2 x Tempo: β = 0.462, t = 11.905, p < 0.001; ) and the LMN time window (Beat3vs2: β = −0.228, t = −7.467, p < 0.001; Beat3vs2 x Tempo: β = 0.503, t = 11.687, p < 0.001; ). On fast trials, a temporally broad negativity was evident for beat three, which immediately precedes a strong beat, relative to beat two, which does not, that was largest at medial central electrodes within the N1 time window (Beat3vs2: β = −0.311, t = −12.259, p < 0.001; Beat3vs2 x LRquad: β = 0.211, t = 4.804, p < 0.001; Beat3vs2 x APquad: β = 0.130, t = 2.955, p = 0.003), and at medial-left electrodes within the LMN time window (Beat3vs2: β = −0.228, t = −8.160, p < 0.001; Beat3vs2 x LRquad: β = 0.237, t = 4.912, p < 0.001; Beat3vs2 x LRlin: β = 0.134, t = 2.770, p = 0.006). Conversely, on slow trials beat three elicited an anterior and central positivity relative to beat two during the N1 time window (Beat3vs2: β = 0.151, t = 5.472, p < 0.001; Beat3vs2 x APquad: β = −0.143, t = −2.994, p = 0.003; Beat3vs2 x APlin: β = −0.165, t = −3.462, p = 0.001), and a medial central positivity relative to beat two during the LMN time window (Beat3vs2: β = 0.276, t = 9.033, p < 0.001; Beat3vs2 x LRquad: β = −0.130, t = −2.452, p = 0.014; Beat3vs2 x APquad: β = −0.212, t = −4.008, p < 0.001).
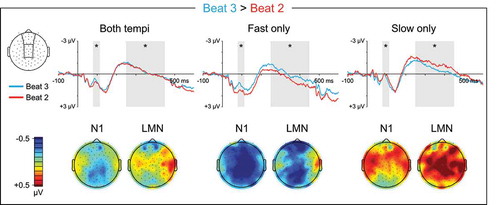
Figure 3. Ternary meter ERPs, weak beats. Top: Grand average ERPs elicited by metrically weak beat three, which immediately precedes a strong beat, and metrically weak beat two, which does not. ERP waveforms are shown averaged over medial anterior and central electrode sites. The N1 (80–115 ms) and LMN (250–450 ms) time windows are highlighted, and beat position main effect significance is indicated for each time window (* = p < 0.05, ns = p ≥ 0.05, – = test not motivated by higher-order tempo interaction). Bottom: Topographical contrast maps show the scalp distributions of beat three vs. beat two mean amplitude differences within the N1 and LMN time windows. All contrast maps are plotted using the same color axis range
ERPs: Quaternary Meter
Strong Vs. Intermediate Beats
The hypothesis that listeners direct temporally selective attention to subjectively strong times in a manner that modulates early auditory processing predicts a larger N1 over anterior scalp for the primary stress in subjective four-beat groups, which falls on beat one. Consistent with this prediction, beat one elicited a more negative N1 than beat three, especially at anterior electrodes (Beat1vs3: β = −0.072, t = −2.509, p = 0.012; Beat1vs3 x APlin: β = 0.158, t = 3.162, p = 0.002; ), that was unaffected by tempo (p’s > 0.3).
Figure 4. Quaternary meter ERP measures. Left: Topographical scalp distributions of mean amplitude within the N1 (80–115 ms) and LMN (250–450 ms) time windows averaged across ordinal beat position. In the scalp map only, N1 amplitude is plotted using P1 amplitude (58–62 ms) as a baseline. Right: Mean amplitudes within the N1 (80–115 ms) and LMN (250–450 ms) time windows for each ordinal beat position, averaged across the entire scalp. Error bars represent standard errors across participants
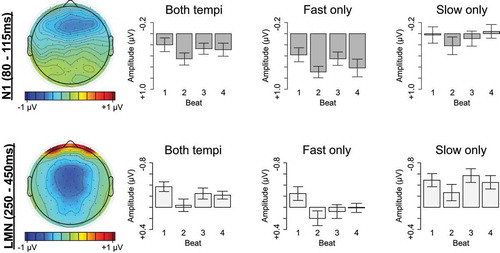
Figure 5. Quaternary meter ERPs, strong vs. intermediate beats. Top: Grand average ERPs elicited by metrically strong beat one and metrically intermediate beat three. ERP waveforms are shown averaged over anterior electrode sites. The N1 (80–115 ms) and LMN (250–450 ms) time windows are highlighted, and beat position main effect significance is indicated for each time window (* = p < 0.05, ns = p ≥ 0.05, – = test not motivated by higher-order tempo interaction). Bottom: Topographical contrast maps show the scalp distributions of beat one vs. beat three mean amplitude differences within the N1 and LMN time windows. All contrast maps are plotted using the same color axis range
During quaternary listening, beat one also elicited an LMN between 250 and 450 ms relative to beat three in a tempo-dependent manner (Beat1vs3: β = −0.323, t = −9.806, p < 0.001; Beat1vs3 x Tempo: β = 0.405, t = 8.695, p < 0.001; ). On fast trials, beat one elicited a clear LMN relative to beat three that was largest at medial anterior and central electrodes (Beat1vs3: β = −0.323, t = −10.945, p < 0.001; Beat1vs3 x LRquad: β = 0.192, t = 3.749, p < 0.001; Beat1vs3 x APlin: β = 0.379, t = 7.419, p < 0.001). On slow trials, beat one elicited a topographically restricted LMN relative to beat three at only anterior electrodes (Beat1vs3 x APlin: β = 0.230, t = 3.758, p < 0.001; Beat1vs3 x APquad: β = −0.189, t = −3.086, p = 0.002; Beat1vs3_Anterior: β = −0.158, t = −2.122, p = 0.034), and a relative positivity during the LMN time window at central and posterior electrodes (Beat1vs3_CentralPosterior: β = 0.202, t = 5.772, p < 0.001).
Intermediate Vs. Weak Beats
If listeners spontaneously subdivided the four-beat groups into two-beat subgroups during quaternary listening, the hypothesis that listeners direct attention to subjectively strong times in a manner that modulates early auditory processing additionally predicts a larger N1 over anterior scalp for beat three in subjective four-beat groups. Consistent with this prediction, beat three elicited a more negative N1 than beats two and four in a tempo-dependent manner (Beat3vs24: β = −0.202, t = −8.061, p < 0.001; Beat3vs24 x Tempo: β = 0.199, t = 5.624, p < 0.001; ). On fast trials, the increased N1 negativity for beat three was largest at medial-left central electrodes (Beat3vs24: β = −0.202, t = −8.710, p < 0.001; Beat3vs24 x LRquad: β = 0.123, t = 3.066, p = 0.002; Beat3vs24 x LRlin: β = 0.091, t = 2.261, p = 0.024; Beat3vs24 x APquad: β = 0.107, t = 2.662, p = 0.008). On slow trials, the increased N1 negativity for beat three did not reach significance (p’s > 0.1), but the topographic pattern of contrast estimates suggested a small effect at medial-left anterior electrodes ().
Figure 6. Quaternary meter ERPs, intermediate vs. weak beats. Top: Grand average ERPs elicited by metrically intermediate beat three and metrically weak beats two and four. ERP waveforms are shown averaged over medial anterior and central electrode sites. ERPs to beats two and four were calculated separately and then averaged across beat such that they are weighted equally in the waveforms, as they are in statistical analysis. The N1 (80–115 ms) and LMN (250–450 ms) time windows are highlighted, and beat position main effect significance is indicated for each time window (* = p < 0.05, ns = p ≥ 0.05, – = test not motivated by higher-order tempo interaction). Bottom: Topographical contrast maps show the scalp distributions of beat three vs. beats two and four mean amplitude differences within the N1 and LMN time windows. All contrast maps are plotted using the same color axis range
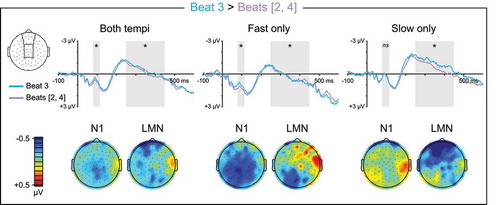
During quaternary listening, beat three also elicited an LMN relative to weaker beats two and four in a tempo-dependent manner (Beat3vs24 x Tempo: β = −0.184, t = −4.559, p < 0.001; ). On fast trials, the LMN for beat three was topographically restricted to only posterior electrodes (Beat3vs24 x APlin: β = −0.158, t = −3.574, p < 0.001; Beat3vs24_Posterior: β = −0.152, t = −4.576, p < 0.001), and was larger over medial-left posterior scalp (Beat3vs24_Posterior x LRquad: β = 0.184, t = 3.191, p = 0.001; Beat3vs24_Posterior x LRlin: β = 0.171, t = 2.963, p = 0.003). On slow trials, the LMN to beat three was evident over the entire scalp and largest at medial anterior electrodes (Beat3vs24: β = −0.214, t = −6.993, p < 0.001; Beat3vs24 x LRquad: β = 0.108, t = 2.035, p = 0.042; Beat3vs24 x APlin: β = 0.242, t = 4.568, p < 0.001).
Metrically Weak Beats
During quaternary listening, beat four, which immediately precedes a strong beat, elicited a negativity relative to beat two, which does not, during the N1 time window that differed in magnitude and topography with tempo (Beat4vs2: β = −0.036, t = −2.513, p = 0.012; Beat4vs2 x Tempo: β = −0.093, t = −4.556, p < 0.001; ). On fast trials, the early negativity to beat four was moderate in size and concentrated at medial and right electrodes (Beat4vs2: β = −0.036, t = −2.715, p = 0.007; Beat4vs2 x LRlin: β = −0.102, t = −4.411, p < 0.001), but did not differ with electrode anteriority (p’s > 0.05). On slow trials, the early negativity to beat four was large in size and concentrated at medial anterior electrodes (Beat4vs2: β = −0.129, t = −8.855, p < 0.001; Beat4vs2 x LRquad: β = 0.104, t = 4.107, p < 0.001; Beat4vs2 x APlin: β = 0.140, t = 4.508, p < 0.001).
Figure 7. Quaternary meter ERPs, weak beats. Top: Grand average ERPs elicited by metrically weak beat four, which immediately precedes a strong beat, and metrically weak beat two, which does not. ERP waveforms are shown averaged over medial anterior and central electrode sites. The N1 (80–115 ms) and LMN (250–450 ms) time windows are highlighted, and beat position main effect significance is indicated for each time window (* = p < 0.05, ns = p ≥ 0.05, – = test not motivated by higher-order tempo interaction). Bottom: Topographical contrast maps show the scalp distributions of beat four vs. beat two mean amplitude differences within the N1 and LMN time windows. All contrast maps are plotted using the same color axis range
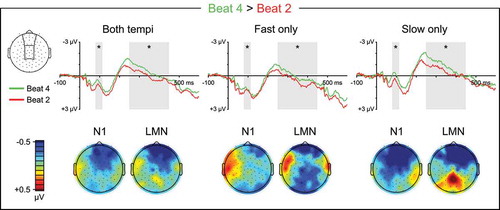
Beat four also elicited a negativity relative to beat two during the LMN time window that differed in topography with tempo (Beat4vs2: β = −0.093, t = −5.653, p < 0.001; Beat4vs2 x LRquad x Tempo: β = −0.122, t = −3.028, p = 0.002; Beat4vs2 x APlin x Tempo: β = 0.244, t = 6.050, p < 0.001; ). On fast trials, the later negativity to beat four was largest at medial electrodes (Beat4vs2: β = −0.093, t = −6.310, p < 0.001; Beat4vs2 x LRquad: β = 0.116, t = 4.525, p < 0.001), but did not differ with electrode anteriority (p’s > 0.05). On slow trials, the later negativity to beat four was largest at medial anterior electrodes (Beat4vs2: β = −0.092, t = −5.225, p < 0.001; Beat4vs2 x APlin: β = 0.203, t = 6.630, p < 0.001; Beat4vs2 x APlin x LRquad: β = −0.219, t = −4.125, p < 0.001).
Discussion
As predicted, subjective metric strength in an imagined metric hierarchy modulated the processing of physically identical sounds presented at different times. Moreover, multiple distinct effects of metric strength on neural responses were observed, indicating that the processing of subjective metric strength draws on multiple neurocognitive mechanisms. We consider the implications of each of these component responses separately below.
Early Auditory Processing (N1)
The hypothesis that listeners allocate more attention to metrically strong times predicts auditory stimuli will elicit a more negative N1 when presented on the first beat of a subjective group compared to all other beats in that group. The current results are consistent with this prediction. Using a subjective rhythmization paradigm, we observed a more negative N1 over anterior and central regions for physically identical tones presented on the first beat compared to all other beats in subjective three- and four-beat groupings on both fast and slow trials. This replicates and extends our prior finding that metrically strong notes elicit a more negative N1 than physically identical metrically weak notes in short melodies (Fitzroy & Sanders, Citation2015), providing further evidence that attention is preferentially allocated to moments of metric strength in a manner that modulates early auditory processing. Moreover, the anterior and central distribution of the N1 strength effects in the present study and Fitzroy and Sanders (Citation2015) is consistent with that previously reported for N1 effects of selectively attending to sound at specific locations (e.g., Hillyard et al., Citation1973) or moments in time (e.g., Lange, Rösler, & Röder, Citation2003), further supporting the hypothesis that metric structure guides the selective allocation of attention to moments in time.
The similarity of the N1 strength effects observed for completely imagined metric structure (in the current study) and for stimulus-inherent metric structure (in Fitzroy & Sanders, Citation2015) suggests that the allocation of attention to metrically strong times is automatic during natural listening, yet under some volitional control. The previously reported N1 strength effect for stimulus-inherent metric structure was only observed for fast trials, whereas the current N1 strength effect for imagined metric structure was observed for both fast and slow trials. This suggests that metric attention is only automatically engaged when stimulus information is temporally dense, but can be engaged under other conditions when directed. This is consistent with the broad interpretation of selective attention as a mechanism for allocating limited neurocognitive resources to more relevant sensory information when processing all sensory information becomes untenable, such as when information is presented rapidly in time (e.g., Nobre & Van Ede, Citation2018). This aspect of metric attention points to its potential utility during speech perception, given the high temporal information density of the speech signal. Additionally, the flexibility of metric attention when directed demonstrated by the current results points to its potential utility as a target of neurocognitive training paradigms designed to remediate disorders associated with atypical metric stress processing, such as developmental dyslexia and developmental language disorder (e.g., Goswami et al., Citation2013; Richards & Goswami, Citation2019).
In addition to increased N1 negativity for the unambiguously metrically strong beat one relative to all other beats, we observed increased N1 negativity for beat three relative to weak beats two and four during quaternary listening. It is likely that this effect indicates perception of a metrically strong beat three during quaternary metric listening, despite no direct instruction to do so. There are music-theoretical reasons to expect beat three to be automatically perceived as metrically strong during quaternary listening: metric structure in Western tonal music primarily consists of periodic groupings of two and three at multiple timescales (Cooper & Meyer, Citation1960; Dauer, Citation1983), and beat three in a group of four could alternately be considered beat one in the second of two groups of two. Additionally, goodness-of-fit judgments for rhythmic probes suggest that perceived metric strength for quaternary meter is a combination of periodic groupings of two at multiple timescales, including every two beats and every four beats, and that the relative contributions of these constituent periodicities to the perceived metric structure can vary among individuals (Palmer & Krumhansl, Citation1990). Given these observations it is likely that while listening to the tones as repeating groups of four, at least some participants automatically perceived nested periodic groupings every two beats as well.
The perception of nested groups of two-within-four beats leads to a metric structure with highest strength at beat one, intermediate strength at beat three, and weak strength at beats two and four. The clear gradient observed in N1 negativity from strong beat one to intermediate beat three to weak beats two and four during quaternary listening then suggests that metric attention was allocated in a graded manner along with hierarchical metric strength. This effect was larger and only met the statistical reliability threshold on fast trials, suggesting that hierarchically gradient metric attention is encouraged by or even dependent on high temporal information density of the tracked stimulus. The effects of selective attention on early auditory processing have previously been shown to follow a gradient across space (Teder-Sälejärvi & Hillyard, Citation1998), but our result represents the first potential evidence that the effects of selective attention on early auditory processing are hierarchically graded across time. If correct, this interpretation would highlight the particular utility of metric attention for tracking information in infant-directed speech, which has exaggerated hierarchical temporal structure (Falk & Kello, Citation2017). However, an alternate interpretation of the current results would be that the larger N1 strength effect for beat one compared to beat three is due to directed allocation of attention to beat one, but automatic allocation of attention to beat three. It may be that controlled direction of attention leads to larger or more reliable effects on early auditory processing, leading to a larger N1 strength effect for the task-directed beat one. Distinguishing these interpretations would require an altered task explicitly directing participants to perceive nested groups of two-within-four beats to compare controlled attentional allocation to metrically strong and intermediate moments in time.
Late Metric Negativity (LMN)
Consistent with multiple previous studies investigating the effects of metric strength on attentive processing of standard tones (Fitzroy & Sanders, Citation2015; Potter et al., Citation2009; Schaefer et al., Citation2011; Vlek et al., Citation2011), metrically strong beat one in subjective groups elicited a negativity between 250 and 450 ms (LMN) compared to metrically weaker beats regardless of metric listening pattern. While the specific cognitive mechanisms indexed by this component remain unclear, the observation of an LMN for beat one relative to all others in a subjective rhythmization paradigm provides further evidence that the LMN is related to attentive processing of metric strength in a hierarchy. The continued observation of the LMN under only attentive listening conditions suggests that the LMN indexes attention-dependent processing. Notably however, the topography and tempo sensitivity of the LMN did not mirror those of the N1 effect in the current study, providing further evidence that these effects are dissociable and that the LMN does not directly index attentional allocation.
Similar to previous findings for stimulus-inherent metric structure (Fitzroy & Sanders, Citation2015), the LMN elicited by beat one was larger and more topographically broad when tones were presented more rapidly. This larger LMN for rapidly presented tones may reflect a more stable metric percept under these conditions; inter-beat intervals for fast trials (450 ms) were slightly closer than slow trials (625 ms) to a previously reported optimal pulse perception interval of 500 ms (Van Noorden & Moelants, Citation1999). This interpretation of LMN reliance on metric percept stability would fit with previous findings that the LMN is evoked in musicians by strong notes occurring early and late in short melodies, but in nonmusicians only by strong notes occurring late in the melodies (Fitzroy & Sanders, Citation2015). Alternatively, attention may be more likely to be allocated to specific times when information is presented rapidly. It may be then that the tempo modulation of the LMN reflects an increase in attention-dependent downstream processing of metric strength due to more regular attentional allocation to metrically strong times under more demanding conditions.
As noted above, our N1 findings suggest that beat three in quaternary meter was perceived as having intermediate metric strength. Consistent with this interpretation, we additionally observed an LMN to beat three relative to weak beats two and four during quaternary listening. The hierarchical results pattern during quaternary listening of an LMN to beat one compared to beat three, along with an LMN to beat three compared to beats two and four, suggests that the LMN reflects attentive processing of graded metric strength, as opposed to only marking the peak metric strength in a temporal unit. Additionally, on fast trials the LMN for beat one compared to beat three was large while the LMN for beat three compared to beats two and four was small, but on slow trials the LMN for beat one compared to beat three was small while the LMN for beat three compared to beats two and four was large. This could suggest that the hierarchical two-within-four metric percept was more likely when tones were presented rapidly in time, whereas when tones were presented more slowly in time the metric distinction between beats one and three was lessened, giving a percept closer to simple binary listening. It is interesting to note then that for quaternary beat three, the tempo-dependence of the LMN, which was larger on slow trials, went in the opposite direction of the tempo-dependence of the N1 strength effect, which was larger on fast trials. This suggests that the cognitive mechanisms indexed by the LMN do not follow the hierarchical allocation of attention in a one-to-one manner, and that the perception of metric structure relies on interactions between multiple cognitive processes. Future work could clarify this issue by directly comparing the N1 strength effect and LMN responses under subjective listening that is expressly binary compared to expressly hierarchically quaternary at different tempi.
Contingent Negative Variation (CNV)
When comparing neural responses among metrically weak beats, an anterior negativity was observed following group-final weak beats (ternary beat three, quaternary beat four) compared to group-internal weak beats (beat two). This anterior negativity was evident across both the N1 and LMN time windows on fast quaternary, slow quaternary, and fast ternary trials. Based on the occurrence of this negativity prior to metrically strong beat one (i.e., following group-final weak beats), the temporal broadness of the negativity, and the anterior distribution, we interpret this negativity as a CNV response. The CNV is a slow negative shift in the ERP waveforms that builds over frontocentral scalp for hundreds of milliseconds prior to expected events (Kononowicz & Penney, Citation2016). This interpretation is consistent with previous reports of CNV-like negativities occurring prior to or immediately at strong beat onset (Bouwer & Honing, Citation2015; Escoffier et al., Citation2015; Potter et al., Citation2009), and may also explain the previously reported reduction in LMN when comparing a strong beat to the preceding weak beat vs. the following weak beat (Schaefer et al., Citation2011). Importantly, previous observation of this CNV-like negativity occurring prior to metrically strong times under inattentive conditions (Bouwer & Honing, Citation2015) distinguishes it from the LMN occurring after metrically strong events, which has only been observed under attentive conditions, indicating that the LMN is not a continuation of CNV-like preparatory activity.
It is unclear why the CNV-like anterior negativity observed preceding beat one on fast quaternary, slow quaternary, and fast ternary trials was not also observed on slow ternary trials. One possible explanation is beat group duration; at 1875 ms, the beat groups on slow ternary trials were the second longest across all trials, following only slow quaternary beat groups (2500 ms). Moreover, as noted above the LMNs elicited by beats one and three on slow quaternary trials were very similar, suggesting that beat three was considered the start of a nested binary group on these trials. If this is correct, this would have reduced effective beat group length on slow quaternary trials to 1250 ms, giving slow ternary trials the longest duration beat groups. Under this interpretation, it may be that a CNV is only elicited prior to beat group onset when beat groups do not exceed a duration threshold somewhere between 1250 and 1875 ms. Although this would not explain why amplitude following beat three was more positive than following beat two on slow ternary trials, which remains unclear, it would explain the lack of CNV-like anterior negativity preceding beat one on slow ternary trials when such a negativity was observed on all other trials. Future studies could test this hypothesis by systematically changing beat group duration while holding metric listening pattern constant to assess the effects of beat group duration on the occurrence of a CNV prior to metric strength.
Late Posterior Positivity
In addition to the CNV-like anterior negativity observed on both fast and some slow trials for group-final weak beats compared to group-internal weak beats, on fast trials only this negativity extended over posterior scalp as well. Given that this posterior effect was temporally broad, evident only on fast trials, and visually evident in the waveforms as early as stimulus onset, we interpret this effect as a posterior positivity elicited by metrically strong beat one with latency of approximately 450 ms, which therefore overlaps into the ERP epochs for beat two on fast trials (SOA = 450 ms) but not slow trials (SOA = 625 ms). Based on the posterior distribution and delayed onset latency of this positivity, we interpret it as a P300-like response elicited by metrically strong events. Deviant targets are known to elicit larger P300 responses when presented at times of objective and subjective metric strength (e.g., Abecasis et al., Citation2005; Brochard et al., Citation2003), demonstrating that the cognitive mechanisms indexed by the P300 are influenced by metric structure. Our observation of a P300-like positivity approximately 450 ms following metrically strong standard tones could help explain this metric strength effect on the P300 elicited by deviant targets. It is possible that the temporal expectancy provided by a metric context causes events occurring at metrically strong times to be considered temporal targets, which upon identification elicit a target recognition P300 response. This would result in an additive boost to the P300 response elicited by deviant targets at metrically predicted times, and would also result in a P300 response to standard events at metrically strong times as observed here.
Conclusions
In summary, our results demonstrate that processing subjective metric strength draws on multiple cognitive mechanisms, as evidenced by multiple differentiable neural responses in the scalp EEG. Increased N1 amplitude for sounds presented at subjectively metrically strong times clearly indicates that attention is allocated to subjectively metrically strong times, as has been previously demonstrated for metrically strong times cued by stimulus features (Fitzroy & Sanders, Citation2015). The N1 strength effect increases with metric strength in a multi-level metric hierarchy, suggesting that the allocation of attention to metrically strong times is hierarchically gradient. Additionally, subjectively metrically strong sounds elicit an LMN that is larger for rapidly presented stimuli, which could either index metric strength perception or identification of temporal boundaries demarcated by metrically strong events. Like the N1 strength effect, the LMN reflects increasing metric strength in a multi-level metric hierarchy, demonstrating that the underlying cognitive activity occurs in a graded or probabilistic manner with metric strength. Moreover, a CNV-like increased negativity following the final beats in subjective metric groups suggests additional group-level processing related either to closure of the current beat group or preparation for the following beat group. Lastly, a late posterior positivity to subjectively metrically strong tones suggests that these tones are to some extent considered temporal targets, which could explain previously observed effects of metric strength on the posterior positivity elicited by deviant sounds (e.g., Brochard et al., Citation2003).
The subjective rhythmization paradigm employed in this study represents one of the simplest metric perception tasks possible. Continued work is necessary to understand how the multiple cognitive processes observed here work in tandem to support metric perception under more complex conditions, such as during perception and production of natural music and speech, and to better understand which mechanisms of metric perception contribute to language and reading dysfunction (e.g., Huss et al., Citation2011; Richards & Goswami, Citation2019). Specifically, future work could investigate the developmental timecourses of the N1, LMN, CNV, and P300-like responses to subjective metric strength, and their association with typical and atypical reading skill acquisition, to better understand the cognitive mechanisms relating rhythmic processing and reading outcomes. This information could facilitate the development of neurocognitively targeted training paradigms to improve outcomes for struggling readers. Additionally, future work should assess the neural responses to metric strength in natural speech to determine whether the metric attentional allocation observed during directed subjective rhythmization also facilitates processing during everyday communication. The current results from a simple task focused solely on metric perception can serve as a baseline comparison for such future work, allowing event-related EEG/MEG designs to help disentangle specifically metric processing from phrase closure, syntactic processing, and other structural elements present in more complex stimuli.
Acknowledgments
The authors would like to thank Giorgio DiIorio for assistance with data collection, and Drs. Mara Breen, Kyle Cave, Alexandra Jesse, Joe Pater, and Matthew Schulkind for comments on versions of this manuscript. Portions of this work were supported by a Dissertation Research Grant from the University of Massachusetts, Amherst to ABF.
Disclosure Statement
The authors declare no conflicts of interest relevant to this work.
References
- Abecasis, D., Brochard, R., Del Río, D., Dufour, A., & Ortiz, T. (2009). Brain lateralization of metrical accenting in musicians. Annals of the New York Academy of Sciences, 1169(1), 74–78.
- Abecasis, D., Brochard, R., Granot, R., & Drake, C. (2005). Differential brain response to metrical accents in isochronous auditory sequences. Music Perception: An Interdisciplinary Journal, 22(3), 549–562.
- Bates, D., Mächler, M., Bolker, B., & Walker, S. (2015). Fitting linear mixed-effects models using lme4. Journal of Statistical Software, 67(1), 1–48.
- Bolger, D., Coull, J. T., & Schön, D. (2014). Metrical rhythm implicitly orients attention in time as indexed by improved target detection and left inferior parietal activation. Journal of Cognitive Neuroscience, 26(3), 593–605.
- Bolger, D., Trost, W., & Schön, D. (2013). Rhythm implicitly affects temporal orienting of attention across modalities. Acta Psychologica, 142(2), 238–244.
- Bouwer, F. L., & Honing, H. (2015). Temporal attending and prediction influence the perception of metrical rhythm: Evidence from reaction times and ERPs. Frontiers in Psychology, 6. doi:10.3389/fpsyg.2015.01094
- Bouwer, F. L., Van Zuijen, T. L., & Honing, H. (2014). Beat processing is pre-attentive for metrically simple rhythms with clear accents: An ERP study. Plos One, 9(5), e97467.
- Bouwer, F. L., Werner, C. M., Knetemann, M., & Honing, H. (2016). Disentangling beat perception from sequential learning and examining the influence of attention and musical abilities on ERP responses to rhythm. Neuropsychologia, 85, 80–90.
- Brochard, R., Abecasis, D., Potter, D., Ragot, R., & Drake, C. (2003). The “ticktock” of our internal clock: Direct brain evidence of subjective accents in isochronous sequences. Psychological Science, 14(4), 362–366.
- Cason, N., & Schön, D. (2012). Rhythmic priming enhances the phonological processing of speech. Neuropsychologia, 50(11), 2652–2658.
- Celma-Miralles, A., De Menezes, R. F., & Toro, J. M. (2016). Look at the beat, feel the meter: Top–down effects of meter induction on auditory and visual modalities. Frontiers in Human Neuroscience, 10. doi:10.3389/fnhum.2016.00108
- Cirelli, L. K., Spinelli, C., Nozaradan, S., & Trainor, L. J. (2016). Measuring neural entrainment to beat and meter in infants: Effects of music background. Frontiers in Neuroscience, 10. doi:10.3389/fnins.2016.00229
- Cooper, G., & Meyer, L. B. (1960). The rhythmic structure of music. University of Chicago Press.
- Corriveau, K., Pasquini, E., & Goswami, U. (2007). Basic auditory processing skills and specific language impairment: A new look at an old hypothesis. Journal of Speech, Language, and Hearing Research, 50(3), 647–666.
- Dauer, R. M. (1983). Stress-timing and syllable-timing reanalyzed. Journal of Phonetics, 11(1), 51–62.
- Delorme, A., & Makeig, S. (2004). EEGLAB: An open source toolbox for analysis of single-trial EEG dynamics including independent component analysis. Journal of Neuroscience Methods, 134(1), 9–21.
- Escoffier, N., Herrmann, C. S., & Schirmer, A. (2015). Auditory rhythms entrain visual processes in the human brain: Evidence from evoked oscillations and event-related potentials. NeuroImage, 111, 267–276.
- Escoffier, N., Sheng, D. Y. J., & Schirmer, A. (2010). Unattended musical beats enhance visual processing. Acta Psychologica, 135(1), 12–16.
- Falk, S., & Kello, C. T. (2017). Hierarchical organization in the temporal structure of infant-direct speech and song. Cognition, 163, 80–86.
- Fitzroy, A. B., & Sanders, L. D. (2015). Musical meter modulates the allocation of attention across time. Journal of Cognitive Neuroscience, 27(12), 2339–2351.
- Fujioka, T., Ross, B., & Trainor, L. J. (2015). Beta-band oscillations represent auditory beat and its metrical hierarchy in perception and imagery. Journal of Neuroscience, 35(45), 15187–15198.
- Fujioka, T., Zendel, B. R., & Ross, B. (2010). Endogenous neuromagnetic activity for mental hierarchy of timing. The Journal of Neuroscience, 30(9), 3458–3466.
- Geiser, E., Sandmann, P., Jäncke, L., & Meyer, M. (2010). Refinement of metre perception – Training increases hierarchical metre processing. European Journal of Neuroscience, 32(11), 1979–1985.
- Geiser, E., Ziegler, E., Jancke, L., & Meyer, M. (2009). Early electrophysiological correlates of meter and rhythm processing in music perception. Cortex, 45(1), 93–102.
- Gordon, E. (1989). Advanced measures of music audiation. G.I.A. Publications.
- Gordon, E., & Alvey, M. (2008). Advanced measures of music audiation (CD-ROM version 1.0). GIA Publications.
- Goswami, U., Mead, N., Fosker, T., Huss, M., Barnes, L., & Leong, V. (2013). Impaired perception of syllable stress in children with dyslexia: A longitudinal study. Journal of Memory and Language, 69(1), 1–17.
- Hillyard, S. A., Hink, R. F., Schwent, V. L., & Picton, T. W. (1973). Electrical signs of selective attention in the human brain. Science, 182(4108), 177–179.
- Huss, M., Verney, J. P., Fosker, T., Mead, N., & Goswami, U. (2011). Music, rhythm, rise time perception and developmental dyslexia: Perception of musical meter predicts reading and phonology. Cortex, 47(6), 674–689.
- Iversen, J. R., Repp, B. H., & Patel, A. D. (2009). Annals of the New York academy of sciences, 1169(the neurosciences and music III disorders and plasticity). Top-Down Control of Rhythm Perception Modulates Early Auditory Responses, 58–73. doi:10.1111/j.1749-6632.2009.04579.x
- Jones, M. R. (1976). Time, our lost dimension: Toward a new theory of perception, attention, and memory. Psychological Review, 83(5), 323–355.
- Jones, M. R., & Boltz, M. (1989). Dynamic attending and responses to time. Psychological Review, 96(3), 459–491.
- Jones, M. R., Boltz, M., & Kidd, G. (1982). Controlled attending as a function of melodic and temporal context. Perception & Psychophysics, 32(3), 211–218.
- Jongsma, M. L. A., Desain, P., & Honing, H. (2004). Rhythmic context influences the auditory evoked potentials of musicians and nonmusicians. Biological Psychology, 66(2), 129–152.
- Kiparsky, P. (1975). Stress, syntax, and meter. Language, 51(3) JSTOR, 576–616. .
- Kononowicz, T. W., & Penney, T. B. (2016). The contingent negative variation (CNV): Timing isn’t everything. Current Opinion in Behavioral Sciences, 8, 231–237.
- Kuznetsova, A., Brockhoff, P. B., & Christensen, R. H. B. (2017). lmerTest package: Tests in linear mixed effects models. Journal of Statistical Software, 82(1), 1–26.
- Ladinig, O., Honing, H., Háden, G., & Winkler, I. (2009). Probing attentive and preattentive emergent meter in adult listeners without extensive music training. Music Perception: An Interdisciplinary Journal, 26(4), 377–386.
- Lange, K., Rösler, F., & Röder, B. (2003). Early processing stages are modulated when auditory stimuli are presented at an attended moment in time: An event-related potential study. Psychophysiology, 40(5), 806–817.
- Large, E. W., & Jones, M. R. (1999). The dynamics of attending: How people track time-varying events. Psychological Review, 106(1), 119–159.
- Lawrence, M. A. (2013). ez: Easy analysis and visualization of factorial experiments. http://CRAN.R-project.org/package=ez
- Leong, V., Hämäläinen, J., Soltész, F., & Goswami, U. (2011). Rise time perception and detection of syllable stress in adults with developmental dyslexia. Journal of Memory and Language, 64(1), 59–73.
- Liégeois-Chauvel, C., Musolino, A., Badier, J. M., Marquis, P., & Chauvel, P. (1994). Evoked potentials recorded from the auditory cortex in man: Evaluation and topography of the middle latency components. Electroencephalography and Clinical Neurophysiology/Evoked Potentials Section, 92(3), 204–214.
- Lopez-Calderon, J., & Luck, S. J. (2014). ERPLAB: An open-source toolbox for the analysis of event-related potentials. Frontiers in Human Neuroscience, 8, 213.
- Mangun, G. R., & Hillyard, S. A. (1987). The spatial allocation of visual attention as indexed by event-related brain potentials. Human Factors, 29(2), 195–211.
- Mattys, S. L., & Samuel, A. G. (1997). How lexical stress affects speech segmentation and interactivity: Evidence from the migration paradigm. Journal of Memory and Language, 36(1), 87–116.
- Näätänen, R., Paavilainen, P., Rinne, T., & Alho, K. (2007). The mismatch negativity (MMN) in basic research of central auditory processing: A review. Clinical Neurophysiology, 118(12), 2544–2590.
- Näätänen, R., & Picton, T. W. (1986). N2 and automatic versus controlled processes. Electroencephalography and Clinical Neurophysiology. Supplement, 38, 169–186.
- Nobre, A. C., & Van Ede, F. (2018). Anticipated moments: Temporal structure in attention. Nature Reviews. Neuroscience, 19(1), 34–48.
- Nozaradan, S., Peretz, I., Missal, M., & Mouraux, A. (2011). Tagging the neuronal entrainment to beat and meter. The Journal of Neuroscience, 31(28), 10234–10240.
- Nozaradan, S., Peretz, I., & Mouraux, A. (2012). Selective neuronal entrainment to the beat and meter embedded in a musical rhythm. The Journal of Neuroscience, 32(49), 17572–17581.
- Palmer, C., & Krumhansl, C. L. (1990). Mental representations for musical meter. Journal of Experimental Psychology. Human Perception and Performance, 16(4), 728–741.
- Pantev, C., Lütkenhöner, B., Hoke, M., & Lehnertz, K. (1986). Comparison between simultaneously recorded auditory-evoked magnetic fields and potentials elicited by ipsilateral, contralateral and binaural tone burst stimulation. Audiology, 25(1), 54–61.
- Patel, A. D. (2008). Music, language, and the brain. Oxford University Press.
- Pitt, M. A., & Samuel, A. G. (1990). The use of rhythm in attending to speech. Journal of Experimental Psychology. Human Perception and Performance, 16(3), 564–573.
- Polich, J., & Kok, A. (1995). Cognitive and biological determinants of P300: An integrative review. Biological Psychology, 41(2), 103–146.
- Potter, D. D., Fenwick, M., Abecasis, D., & Brochard, R. (2009). Perceiving rhythm where none exists: Event-related potential (ERP) correlates of subjective accenting. Cortex, 45(1), 103–109.
- R Core Team. (2015). R: A language and environment for statistical computing. http://www.R-project.org/
- Repp, B. H. (2010). Do metrical accents create illusory phenomenal accents? Attention, Perception & Psychophysics, 72(5), 1390–1403.
- Richards, S., & Goswami, U. (2015). Auditory processing in specific language impairment (sli): Relations with the perception of lexical and phrasal stress. Journal of Speech, Language, and Hearing Research, 58(4), 1292–1305.
- Richards, S., & Goswami, U. (2019). Impaired recognition of metrical and syntactic boundaries in children with developmental language disorders. Brain Sciences, 9(2), 33.
- Schaefer, R. S., Vlek, R. J., & Desain, P. (2011). Decomposing rhythm processing: Electroencephalography of perceived and self-imposed rhythmic patterns. Psychological Research, 75(2), 95–106.
- Schröger, E., & Wolff, C. (1998). Behavioral and electrophysiological effects of task-irrelevant sound change: A new distraction paradigm. Cognitive Brain Research, 7(1), 71–87.
- Shields, J. L., McHugh, A., & Martin, J. G. (1974). Reaction time to phoneme targets as a function of rhythmic cues in continuous speech. Journal of Experimental Psychology, 102(2), 250–255.
- Snyder, J. S., & Large, E. W. (2005). Gamma-band activity reflects the metric structure of rhythmic tone sequences. Cognitive Brain Research, 24(1), 117–126.
- Team, R. (2014). RStudio: Integrated development for R. http://www.rstudio.org/
- Teder-Sälejärvi, W. A., & Hillyard, S. A. (1998). The gradient of spatial auditory attention in free field: An event-related potential study. Perception & Psychophysics, 60(7), 1228–1242.
- Tierney, A., & Kraus, N. (2013). Neural responses to sounds presented on and off the beat of ecologically valid music. Frontiers in Systems Neuroscience, 7. doi:10.3389/fnsys.2013.00014
- Van Noorden, L., & Moelants, D. (1999). Resonance in the perception of musical pulse. Journal of New Music Research. XXVIII/1 (March 1999): Foundations of Rhythm Perception, 28(1), 43–66.
- Vaughan Jr., H. G., & Ritter, W. (1970). The sources of auditory evoked responses recorded from the human scalp. Electroencephalography and Clinical Neurophysiology, 28(4), 360–367.
- Vlek, R. J., Schaefer, R. S., Gielen, C. C. A. M., Farquhar, J. D. R., & Desain, P. (2011). Shared mechanisms in perception and imagery of auditory accents. Clinical Neurophysiology, 122(8), 1526–1532.
- Vuust, P., Ostergaard, L., Pallesen, K. J., Bailey, C., & Roepstorff, A. (2009). Predictive coding of music – Brain responses to rhythmic incongruity. Cortex, 45(1), 80–92.
- Vuust, P., Pallesen, K. J., Bailey, C., Van Zuijen, T. L., Gjedde, A., Roepstorff, A., & Østergaard, L. (2005). To musicians, the message is in the meter: Pre-attentive neuronal responses to incongruent rhythm are left-lateralized in musicians. NeuroImage, 24(2), 560–564.
- Wei, T. (2013). corrplot: Visualization of a correlation matrix. http://CRAN.R-project.org/package=corrplot
- Wickham, H. (2007). Reshaping data with the reshape package. Journal of Statistical Software, 21(12), 1–20.
- Wickham, H. (2016). Ggplot2: Elegant graphics for data analysis (2nd ed.). Springer International Publishing. doi:10.1007/978-3-319-24277-4
- Woodruff Carr, K., Fitzroy, A. B., Tierney, A., White-Schwoch, T., & Kraus, N. (2017). Incorporation of feedback during beat synchronization is an index of neural maturation and reading skills. Brain and Language, 164, 43–52.
- Zhao, T. C., & Kuhl, P. K. (2016). Musical intervention enhances infants’ neural processing of temporal structure in music and speech. Proceedings of the National Academy of Sciences, 113( 19), 5212–5217.
- Zhao, T. C., Lam, H. T. G., Sohi, H., & Kuhl, P. K. (2017). Neural processing of musical meter in musicians and non-musicians. Neuropsychologia, 106, 289–297.