
 ?Mathematical formulae have been encoded as MathML and are displayed in this HTML version using MathJax in order to improve their display. Uncheck the box to turn MathJax off. This feature requires Javascript. Click on a formula to zoom.
Abstract
Rosmarinic acid is a polyphenolic phytoconstituent isolated from the leaves of Plectranthus amboinicus and its structure was established by analysis of its 1H, 13C and HRMS. The effect of rosmarinic acid was evaluated by deranged plasma and tissues glycoprotein components in diabetic rats. Rosmarinic acid was administered to diabetic rats for 30 days significantly declined the levels of blood glucose and glycosylated haemoglobin with elevation of plasma insulin and haemoglobin levels. Rosmarinic acid administration improved the glycogen content in liver and muscle tissue by reinstating the altered glycogen metabolic enzymes such as glycogen synthase and glycogen phosphorylase. Further, the altered levels of plasma and tissue glycoprotein components were restored to near normal upon treatment with rosmarinic acid. In addition, rosmarinic acid treatment prevented body weight loss and excessive intake of food and water. The effect produced by the rosmarinic acid on various parameters was comparable to that of metformin.
Introduction
Diabetes mellitus is a metabolic disorder affecting millions of individuals worldwide and characterized by absolute or relative deficiencies in insulin secretion and/or insulin action associated with chronic hyperglycaemia and disturbances of carbohydrate, lipid and protein metabolism (Sundaram et al. Citation2013a). The number of patients with type 2 diabetes mellitus will be more than 300 million by the year 2045 (Cho et al. Citation2018). Hyperglycaemia, due to uncontrolled glucose regulation is considered as the causal link between diabetes and diabetic complications that affects the functions of various organs such as eyes, kidneys, nerves, heart and blood vessels (Mahmoud et al. Citation2012).
Glycoproteins, a carbohydrate linked protein macromolecules found in the cell surface, serves as hormones, enzymes, blood group antigens and constituents of extracellular membranes (Veeramani et al. Citation2012). The principle types of sugar present are hexose, hexosamine, fucose, and sialic acid which encode the diverse biological functions of glycoproteins. Protein-bound hexose imparts hydrophilic nature to the cell membrane and hexosamine through its cationic charges makes the cell membrane more polar (Gomathi et al. Citation2013). Sialic acid is an abundant terminal monosaccharide of glycoconjugates. About 70% of total sialic acid is found on the cell surface, where it plays a pivotal role in cell-to-cell and cell to matrix interactions (Mahmoud et al. Citation2012). Fucose, a deoxyhexose is a component of many N- and O-linked glycoproteins and participates in biological recognition events (Pari and Saravanan Citation2015). Under physiological conditions, the levels of serum and tissue glycoproteins are maintained in a narrow range. Profound alterations in the metabolism of glycoproteins are noticed in diabetes and cardiovascular diseases (Gomathi et al. Citation2013). Such changes are also implicated in the pathogenesis of liver and kidney diseases in diabetes mellitus (Pari and Saravanan Citation2015). Aberrations in glycoprotein metabolism are observed in naturally occurring and in experimental diabetes (Pari and Ashokkumar Citation2006; Saravanan et al. Citation2010; Sundaram et al. Citation2012a).
Insulin and other oral hypoglycaemic agents are available to manage diabetes but it remains a challenge in preventing the onset of diabetic complications (Sundaram et al. Citation2012b). Therefore, there is an imperative need for novel therapeutic agents that can overcome the demerits of existing therapeutic modalities. Plants are an exemplary source of drugs. A wide range of plant-derived active principles are commonly used in the treatment of diabetes that are easily available, economical and free from adverse side effects.
Plectranthus amboinicus (Lamiaceae), a perennial plant has been used as a traditional herbal medicine for the treatment of inflammation-related diseases, particularly for skin, infective, digestive and respiratory problems (Lukhoba et al. Citation2006; Arumugam et al. Citation2016). Considering wide pharmacological activity of this plant, we have chosen and planned to isolate rosmarinic acid from leaves of P.amboinicus. The rosmarinic acid (RA) was confirmed by its 1H, 13C and HRMS spectral analysis. Recently, studies examining the utility of RA to treat diabetic conditions have suggested that RA may reduce diabetes-induced disorders and complications. In diabetic animals, initial studies have shown that RA may control plasma glucose by modulating SGLT1 trafficking to the intestinal brush-border membrane and carbohydrate metabolic enzymes (Azevedo et al. Citation2011; Jayanthy and Subramanian Citation2014). Moreover, RA has been shown to protect endothelial functions and prevent diabetes-induced sexual disorders by elevating serum testosterone levels primarily via its antioxidative effects (Farzadi et al. Citation2011; Sotnikova et al. Citation2013). Furthermore, RA protects against diabetic glomerular deterioration, nephropathy and neuropathy (Tavafi et al. Citation2011; Jiang et al. Citation2012; Hasanein and Mohammad Zaheri Citation2014) and it confers neuroprotective effect under ischemic conditions (Luan et al. Citation2013). Additionally, it mitigates oxidative stress-induced brain damage by diabetes and inhibits activities of bacterial growth, tyrosinase and α-glucosidase in vitro and also suppresses lipid accumulation in vivo (Lin et al. Citation2011; Mushtaq et al. Citation2014; Zhu et al. Citation2014, Citation2019). RA also protects pancreatic cells from glucolipotoxicity (Govindaraj and Sorimuthu Pillai Citation2015). Rosmarinic Acid Amides also acted as an antioxidant and hypoglycaemic agent in vitro (Cardullo et al. Citation2019). However, no scientific reports are available on the protective effect of rosmarinic acid on plasma and tissue glycoprotein moiety in diabetes. Therefore, the present study investigated the ameliorative potential of rosmarinic acid on the levels of glycoprotein components in high-fat diet and streptozotocin-induced diabetic rats. The efficacy of the RA was compared with that of metformin, a standard oral antidiabetic drug.
Chemicals
Streptozotocin, high-fat diet components such as cholesterol, bile salt and egg yolk powder were obtained from Sigma Chemical Company (St. Louis, MO, USA), Sisco Research Laboratories Pvt. Ltd., Mumbai, India, Central Drug House Pvt. Ltd., New Delhi, India and SKM Egg Products Export (India) Limited, Erode, Tamil Nadu, India, respectively. The lard was obtained from the local market in Chennai, Tamil Nadu, India. All other chemicals used were of analytical grade.
Plant materials
In the month of June, garden-fresh leaves of Plectranthus amboinicus were obtained from a local fresh market in Chennai, Tamilnadu, India. The plant was authenticated by Dr. K.N Sunil Kumar, Siddha Central Research Institute (Central Council for Research in Siddha Chennai, Ministry of AYUSH, Government of India) (Voucher no: P17112902A). Garden-fresh Plectranthus amboinicus leaves were shade-dried at room temperature for 30 days and rumpled to a grainy powder. The powder was then sieved for collecting fine powder.
Extraction and isolation of rosmarinic acid
Plectranthus amboinicus leaf powder (500 g) was soaked in 2 L of methanol and kept in the refrigerator for three days, shaking and stirring occasionally. The whole blend was roughly filtrated by a piece of white sterile cotton. Then the filtrate was filtered through Whatman filter paper No 1 and this was repeated three to four times with the same solvent until clear colourless solvent is obtained and then the filtrate was concentrated using vacuum rotary evaporator at 40°C. The methanol concentrate was checked on thin layer chromatography with hexane and ethyl acetate in the ratio of 8:2, which showed four spots (compounds). The methanolic concentrate was chromatographed on a silica gel column (Merck60-120 mesh size) and eluted with hexane and ethyl acetate (80:20 ratios). Fractions were collected at an interval of 10 mL each and monitored by thin-layer chromatography (pre-coated silica gel Merck-60F254 0.25 mm thick plate). Single spotted fraction (yellow colour) was collected in a clean conical flask and concentrated using a vacuum rotary evaporator at 40°C. This process was repeated until getting satisfactory yield of each compound. The yield of rosmarinic acid was 500mg/kg. The structure of the compound was confirmed as rosmarinic acid based on its 1HNMR, 13C NMR and HRMS spectral data. The molecular weight of rosmarinic acid was m/z: 360.08 and the molecular formula was C18H16O8 [M+H]. The spectral data of rosmarinic acid acquired from this investigation was similar to the literatures (Exarchou et al. Citation2001; Lin et al. Citation2011; Zhu et al. Citation2014, Citation2019 Cardullo et al. Citation2019).
The rest of the three spots (three compounds) are under the purification process and they are not involved in the present study. Spectroscopic description of rosmarinic acid was given in Table and the structure of rosmarinic acid was given in Figure .
Figure 1. Structure of rosmarinic acid.
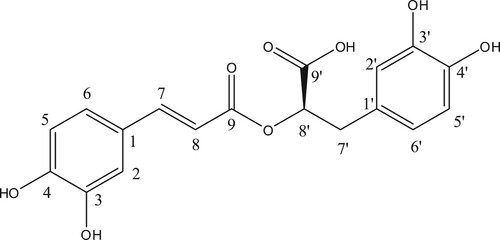
Table 1. 1H and 13C- NMR data for isolated compound rosmarinic acid (500 MHz, Acetone).
Animals
Male albino Wistar rats weighing 180–200 g body weight were procured from the Central Animal House Facility, University of Madras, Taramani Campus, Chennai, Tamil Nadu, India. They were maintained at an ambient temperature of 25 ± 2°C and 12 h of light/dark cycle. Animals were given standard commercial rat chow and water ad libitum and housed under standard environmental conditions throughout the study. The experiments were conducted according to the ethical norms approved by the Ministry of Social Justices and Empowerment, Government of India and Institutional Animal Ethics Committee Guidelines (IAEC No. 32/02/2014).
Induction of type 2 diabetes in rat
The rats were fed with high-fat diet consisting of 84.3% standard laboratory chow, 5% lard, 10% yolk powder, cholesterol 0.2%, 0.5% bile salt for 2 weeks (Xie et al. Citation2005). After 2 weeks, the animals were kept in an overnight fast and injected with low dose of streptozotocin (40 mg/kg, dissolved in 0.1 M sodium citrate buffer, pH 4.5) (Wu et al. Citation2012). Fasting blood glucose was measured three days after the injection. The rats with fasting blood glucose levels above 250 mg/dL were considered diabetic and those animals exhibited massive glycosuria (determined by Benedict's qualitative test).
The diabetic rats were again fed on the high-fat diet for another 4 weeks for induction of dyslipidaemia and insulin resistance.
Experimental design
In this experiment, 30 rats (18 diabetic surviving rats 12 normal rats) were divided into 5 groups of 6 rats in each.
Group I: Normal control (received 0.5 mL of distilled water).
Group II: Drug control (normal healthy control rats received intra gastrically rosmarinic acid (100 mg/kg b.wt.)) dissolved in 0.5 mL of distilled water for 30 days.
Group III: Diabetic control.
Group IV: Diabetic rats received intra gastrically rosmarinic acid (100 mg/kg b.wt.) dissolved in 0.5 mL of distilled water for 30 days (Jayanthy and Subramanian Citation2014).
Group V: Diabetic rats received intra gastrically Metformin (500mg/kg b.wt.) dissolved in 0.5 mL of distilled water for 30 days (Sundaram et al., Citation2013b).
Sample collection
After 30 days of treatment, the animals were deprived of food overnight and sacrificed by decapitation. Blood was collected in two different tubes such as one with a mixture of potassium oxalate and sodium fluoride (1:3) for estimation of plasma insulin and glucose and another with ethylene diamine tetra acetic acid (EDTA) for the estimation of glycated haemoglobin and plasma glycoproteins. Liver, kidney and muscle were dissected out from control and experimental rats and then washed them in ice-cold saline to remove the blood. Plasma proteins were precipitated by adding 95% ethanol and the precipitate was used for the estimation of glycoprotein components. For extraction of glycoproteins from the tissues, the tissues were defatted by the method of Folch et al. (Citation1957) and hydrolyzed with 0.1N H2SO4 at 80°C for 1 h and aliquots were used for the estimation of glycoprotein components. Body weights of all the animals were recorded prior to the treatment and sacrifice. Food and water intake of all groups of animals were monitored on a daily basis for 30 days at a fixed time. Fixed amount of rat chow and fluid was given to each rat and replenished the next day.
Extraction of glycoproteins in plasma and tissue
Hexose was estimated by the method of Niebes (Citation1972). The reaction mixture contained 0.5 ml of tissue homogenate/plasma, 0.5 ml of 5% phenol and 2.5 ml of conc. H2SO4 and boiled for 20 min and absorbance was read at 490 nm.
Hexosamine was estimated by the method of Wagner (Citation1979). Briefly, the reaction mixture contained 0.5 ml plasma/1.0 ml tissue homogenate and 2.5 ml of 3N HCl. It was boiled for 6 h and neutralized with 6N NaOH. To 0.8 ml of the neutralized sample added 0.6 ml of acetyl acetone reagent and boiled for 30 min. The mixture was treated with 2.0 ml of Ehrlich’s reagent. The colour developed was read at 540 nm calorimetrically.
Sialic acid (SA) was determined by the method of Warren (Citation1959). In brief, 0.5 ml of tissue homogenate/ plasma was treated with 0.5 ml of de-ionized water and 0.25 ml of periodic acid and incubated at 37°C for 30 min. 0.2 ml of sodium meta-arsenate and 2.0 ml of thiobarbituric acid were added to the reaction mixture which was heated for 6 min. 5.0 ml of acidified butanol was then added and the absorbance was read at 540 nm.
Fucose was estimated by the method of Dische and Shettles (Citation1948). Briefly, 0.5 ml of tissue homogenate/ plasma was treated with 4.5 ml of H2SO4and boiled for 3 min. 0.1 ml of cysteine hydrochloride reagent was then added. After 75 min in the dark, the absorbance was read at 430 nm. The glycoprotein levels were expressed as mg/100 g for defatted tissue and mg/dl for plasma.
Biochemical analysis
Plasma glucose, insulin, glycosylated haemoglobin assay
Plasma glucose was estimated by the method of Trinder using a reagent kit (Trinder Citation1969). Plasma insulin was assayed with an ELISA kit by the method of Burgi et al. (Citation1988). The glycosylated haemoglobin level was estimated according to the method of Nayak and Pattabiraman (Citation1981) with modifications according to Bannon (Citation1982).
Glycogen content, glycogen synthase and glycogen phosphorylase enzyme assay
Glycogen content, glycogen synthase and glycogen phosphorylase were estimated by the methods of Morales et al. (Citation1973), Leloir and Goldemberg (Citation1962) and Cornblath et al. (Citation1963) respectively.
Statistical analysis
The results are expressed as mean ± SD. Differences between groups were assessed by ANOVA using the SPSS software package for windows. Post hoc testing was performed for inter-group comparisons using the least significance difference (LSD) P-values <0.05 were considered as significantly altered.
Results
Effects of rosmarinic acid on plasma glucose, insulin levels and HOMA-IR index
Blood glucose, plasma insulin levels and homeostatic model assessment of insulin resistant of normal and experimental rats are given in Table . The diabetic rats showed a significant increase in blood glucose and a significant decrease in plasma insulin levels. Administration of rosmarinic acid (100 mg/kg b.w.) to diabetic rats caused a significant decrease in blood glucose levels and a significant increase in plasma insulin when compared with diabetic untreated rats. In the same context, diabetic rats showed a significant increase in HOMA-IR when compared with the control rats. Rosmarinic acid administration significantly decreased the HOMA-IR index in diabetic rats. The effect produced by rosmarinic acid on these parameters was comparable to that of metformin but in the case of normal rats treated with rosmarinic acid alone showed no significant changes in these parameters.
Table 2. Effect rosmarinic acid on the changes in plasma glucose, insulin levels and HOMA-IR index in control and experimental animals.
Effects of rosmarinic acid on changes in the body weight, food, water intake, liver weight and urine sugar
The change in body weight, food intake, water intake, liver weight, and urine sugar of control and experimental rats are represented in Table . Body weight and the liver weight was significantly decreased whereas food intake, water intake and urine sugar levels were significantly increased in diabetic rats compared with the normal control rats in the present study. No significant changes were observed in normal control and rosmarinic acid alone treated rats. All these changes observed in diabetic rats were significantly improved on the oral administration of rosmarinic acid and metformin.
Table 3. Effect of rosmarinic acid on body weight, fluid intake, food intake, liver weight and urine sugar of control and experimental animals.
Effects of rosmarinic acid on the levels of Hb and HbA1c
The levels of haemoglobin and HbA1c in control and experimental animals were depicted in Table . The diabetic rats showed significant decrease in the level of total haemoglobin and significant increase in the levels of HbA1C when compared to control rats. The levels of total haemoglobin and HbA1C were significantly reversed by the administration of rosmarinic acid and metformin to diabetic rats. Normal rats treated with rosmarinic acid did not show any significant changes in haemoglobin and HbA1C levels.
Table 4. Effects of rosmarinic acid on haemoglobin and gycosylated haemoglobin levels in control and experimental animals.
Effects of rosmarinic acid on the levels of glycogen synthase, glycogen phosphorylase and glycogen content in liver
The levels of glycogen synthase and glycogen content were significantly increased whereas the levels of glycogen phosphorylase were significantly increased in diabetic rats when compared to normal rats. Oral administration of rosmarinic acid to diabetic rats reinstated the glycogen content and the activities of glycogen synthase and glycogen phosphorylase to near normal levels when compared to untreated diabetic rats. Normal rats treated with rosmarinic acid and metformin did not show any significant changes in the glycogen content as well as in the glycogen synthase and glycogen phosphorylase (Table ).
Table 5. Effects of rosmarinic acid on the levels of glycogen content, glycogen synthase and glycogen phosphorylase in control and experimental animals.
Effects of rosmarinic acid on the levels of glycoproteins in plasma and tissues
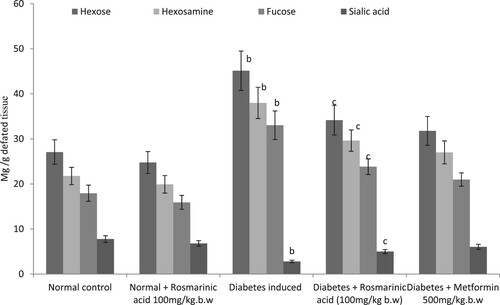
Glycoproteins (hexose, hexosamine, fucose, and sialic acid) are presented in Figures –. Significantly, higher levels of these glycoproteins were observed in the plasma and tissue of diabetic control rats when compared with normal rats. Treatment with rosmarinic acid and metformin to diabetic rats for a period of 30 days resulted in a significant reduction of hexose, hexosamine, fucose, and sialic acid in plasma and sialic acid level is significantly increased in tissues when compared with diabetic control rats. Normal rats treated with rosmarinic acid did not show significant changes in the parameters tested.
Figure 2. Changes in the levels of plasma glycoproteins in control and experimental animals. Values are given as mean ± SD for six animals in each group. Values are considered significantly different at P < 0.05 with post hoc LSD test *P < 0.05. (a) Control vs. Rosmarinic acid alone treated control rats. (b) Control rats vs. diabetic rats. (c) Diabetic rats vs. Rosmarinic acid treated diabetic rats. (d) Rosmarinic acid treated diabetic rats vs. Metformin treated diabetic rats.
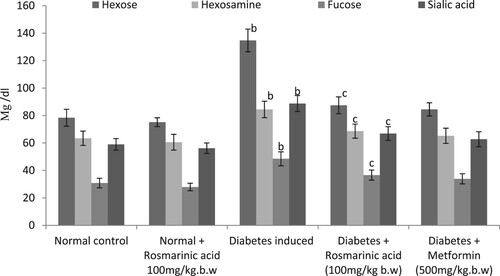
Figure 3. Changes in the levels of liver glycoproteins in control and experimental animals. Values are given as mean ± SD for six animals in each group. Values are considered significantly different at P < 0.05 with post hoc LSD test *P < 0.05. (a) Control vs. Rosmarinic acid alone treated control rats. (b) Control rats vs. diabetic rats. (c) Diabetic rats vs. Rosmarinic acid treated diabetic rats. (d) Rosmarinic acid treated diabetic rats vs. Metformin treated diabetic rats.
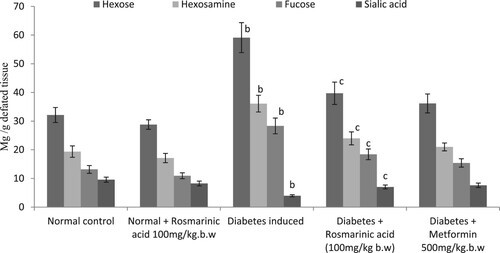
Figure 4. Changes in the levels of kidney glycoproteins in control and experimental animals. Values are given as mean ± SD for six animals in each group. Values are considered significantly different at P < 0.05 with post hoc LSD test *P < 0.05. (a) Control vs. Rosmarinic acid alone treated control rats. (b) Control rats vs. diabetic rats. (c) Diabetic rats vs. Rosmarinic acid treated diabetic rats. (d) Rosmarinic acid treated diabetic rats vs. Metformin treated diabetic rats.
Discussion
In HFD/STZ-induced diabetic animals, the levels of blood glucose and homeostatic model assessment of insulin resistance (HOMA-IR) were significantly increased whereas the levels of plasma insulin were significantly decreased. However, upon treatment with rosmarinic acid and metformin the levels of blood glucose, plasma insulin and HOMA-IR were brought back to near normal. These results clearly indicate that rosmarinic acid not only bring about glucose lowering action by stimulating the surviving β-cells of Islets of Langerhans to release more insulin and also lowering HOMA-IR indices which confirm the restoration of insulin sensitivity through its antioxidant potential because flavonoids and polyphenols are devoted compounds for antioxidant (Pieta Citation2000; Govindaraj and Sorimuthu Pillai Citation2015; Mahmoud et al. Citation2015; Sundaram et al. Citation2015). Low dose streptozotocin is known to induce rapid destruction of pancreatic β-cells leading to impaired glucose-stimulated insulin release and insulin resistance, both of which are marked features of type 2 diabetes (Sundaram et al. Citation2013a). The elevated blood glucose is a result of reduced glucose uptake in muscle and adipose tissue and increased gluconeogenesis, hepatic glucose production and glycogen breakdown (Guignot and Mithieux Citation1999; Sundaram et al. Citation2013a). The HFD/STZ-induced diabetic rats revealed signs of polyphagia, polyuria and polydipsia with concomitant reduction of body weight. The decrease in body weight observed in HFD/STZ-induced diabetic rats was due to an increase in muscle destruction or degradation of structural proteins (Eliza et al. Citation2009; Pari and Sankaranarayanan Citation2009; Sundaram et al. Citation2014). Treatment with rosmarinic acid and metformin increased body weight, decreased food intake, water intake and urine sugar in diabetic rats. An increase in the body weight of HFD/STZ-induced diabetic rats treated with rosmarinic acid might be due to an enhancement in glycaemic control and increased synthesis of structural proteins. A decrease in the liver weight observed in HFD/STZ-induced diabetic rats might be due to increased breakdown of glycogen or pronounced gluconeogenesis (Al-Shamaony et al. Citation1994; Sundaram et al. Citation2013b). Rosmarinic acid and metformin treatment increased liver weight in HFD/STZ-induced diabetic rats by reversing gluconeogenesis.
Analysis of glycated haemoglobin (HbA1c) in blood provides evidence about an individual’s average blood glucose levels during the previous two to three months which is the predicted half-life of red blood cells (RBCs). The HbA1c is now recommended as a standard of care for testing and monitoring diabetes, specifically type 2 diabetes. The marked increase in HbA1c levels observed in diabetic animals is in accordance with a previous report (Pari and Sankaranarayanan Citation2009; Sundaram et al. Citation2013b). However, upon treatment with rosmarinic acid and metformin decreased the elevation of HbA1c, thereby increasing the level of total Hb in diabetic rats. The decrease in HbA1c levels and increase in total Hb levels might be due to improved glycaemic control by rosmarinic acid.
Glucose is stored in the form of glycogen in the liver and skeletal muscle. The metabolism of glycogen is regulated by glycogen synthase and glycogen phosphorylase (Golden et al. Citation1979; Vats et al. Citation2004; Pari and Saravanan Citation2005; Sundaram et al. Citation2014). Reduced hepatic glycogen content in HFD/STZ-induced diabetic rats has been attributed to reduced activity of glycogen synthase and increased activity of glycogen phosphorylase. Moreover, glycogen synthesis depends on insulin due to its stimulatory effect. Low insulin and insulin resistance observed in diabetic patients can contribute to decrease in glycogen levels (Jensen et al. Citation2011). Our results showed that rosmarinic acid and metformin treatment produces more insulin from pancreatic β-cells and increase glycogen content in the liver and skeletal muscle of HFD/STZ-induced diabetic rats by increasing the activity of glycogen synthase and inhibiting the activity of glycogen phosphorylase.
In the diabetic state, glucose is redirected through insulin-independent pathways resulting in enhanced production of carbohydrate moieties of glycoproteins. Therefore, there is an elevation in the levels of protein-bound hexose, hexosamine, fucose, and sialic acid in plasma and tissue of diabetic animals (Sundaram et al. Citation2012a; Pari and Saravanan Citation2015). Several studies have suggested that an alteration in glycoprotein components could be a consequence of impaired carbohydrate metabolism, insulin deficiency and high levels of plasma glucose in diabetic condition may result in an increased synthesis of glycoproteins (Pari and Rajarajeswari Citation2010; Sankaranarayanan and Pari Citation2011; Veeramani et al. Citation2012). The altered levels of plasma and tissue glycoprotein components in the diabetic rats were brought back to near normal upon treatment with rosmarinic acid and metformin. Jayanthy and Subramanian (Citation2014) have reported earlier that administration of rosmarinic acid has ameliorated the hyperglycaemia by modulating carbohydrate metabolic enzymes in high fat diet-STZ induced experimental diabetes rats which could be a possible reason for restoring the disturbed glycoprotein components in plasma and tissues of diabetic animals to near normal levels.
Conclusion
Based on the results obtained from this study, this can be concluded that rosmarinic acid has the potential for antidiabetic action as evident by the increased level of insulin in diabetic rats treated with rosmarinic acid which may be responsible for the reversal of glycoprotein changes. These results show that rosmarinic acid may be used as an antidiabetic drug.
Supplemental Material
Download MS Word (434.3 KB)Disclosure statement
No potential conflict of interest was reported by the author(s).
Related Research Data
References
- Al-Shamaony L, Al-Khazraji SM, Twaiji HA. 1994. Hypoglycemic effect of Artemisia herba alba II: effect of a valuable extract on some blood parameters in diabetic animals. J Ethnopharmacol. 43(3):167–171. doi: https://doi.org/10.1016/0378-8741(94)90038-8
- Arumugam G, Swamy MK, Sinniah UR. 2016. Plectranthus amboinicus (Lour.) Spreng: botanical, phytochemical, pharmacological and nutritional significance. Molecules. 21:369. doi: https://doi.org/10.3390/molecules21040369
- Azevedo MF, Lima CF, Fernandes-Ferreira M, Almeida MJ, Wilson JM, Pereira-Wilson C. 2011. Rosmarinic acid, major phenolic constituent of Greek sage herbal tea, modulates rat intestinal SGLT1 levels with effects on blood glucose. Mol Nutr Food Res. 55(1):S15–S25. doi: https://doi.org/10.1002/mnfr.201000472
- Bannon P. 1982. Effect of pH on the elimination of the labile fraction of glycosylated haemoglobin. Clin Chem. 28:2183. doi: https://doi.org/10.1093/clinchem/28.10.2183a
- Burgi W, Briner N, Franken ACH, Kessler G. 1988. One step sandwich enzyme immunoassay for insulin using monoclonal antibodies. Clin Biochem. 21:311–314. doi: https://doi.org/10.1016/S0009-9120(88)80087-0
- Cardullo N, Catinella G, Floresta G, Muccilli V, Rosselli S, Resci_na A, Bruno M, Tringali C. 2019. Synthesis of rosmarinic acid amides as antioxidative and hypoglycemic agents. J Nat Prod. 82(3):573–582. doi: https://doi.org/10.1021/acs.jnatprod.8b01002
- Cho NH, Shaw JE, Karuranga S, Huang Y, da Rocha Fernandes JD, Ohlrogge AW, Malanda B. 2018. IDF diabetes Atlas: global estimates of diabetes prevalence for 2017 and projections for 2045. Diabetes Res Clin Pract. 138:271–281. doi: https://doi.org/10.1016/j.diabres.2018.02.023
- Cornblath M, Randle P, Parmeggiani JA, Morgan HE. 1963. Regulation of glycogenolysis in muscle. effects of glucagon and anoxia on lactate production, glycogen content, and phosphorylase activity in the perfused isolated rat heart. J Biol Chem. 238:1592–1597.
- Dische Z, Shettles LB. 1948. A specific color reaction of methylpentoses and a spectrophotometric micro method for their determination. J Biol Chem. 75:595–603.
- Eliza J, Daisy P, Ignacimuthu S, Duraipandiyan V. 2009. Normoglycemic and hypolipidemic effect of costunolide isolated from Costus speciosus (Koen ex. Retz.) Sm. in streptozotocin-induced diabetic rats. Chem Biol Interact. 179:329–334. doi: https://doi.org/10.1016/j.cbi.2008.10.017
- Exarchou V, Troganis A, Gerothanassis IP, Tsimidou M, Boskou D. 2001. Identification and quantification of caffeic and rosmarinic acid in complex plant extracts by the use of variable-temperature two-dimensional nuclear magnetic resonance spectroscopy. J Agric Food Chem. 49:2–8. doi: https://doi.org/10.1021/jf990928e
- Farzadi L, Khaki A, Ghasemzadeh A, Ouladsahebmadarek E, Ghadamkheir E. 2011. Effect of rosmarinic acid on sexual behavior in diabetic male rats. Afr J Pharm Pharmacol. 5(16):1906–1910.
- Folch J, Lees M, Solane SG. 1957. A simple method for isolation and purification of total lipids from animal tissues. J Biol Chem. 26:497–509.
- Golden S, Wals PA, Okajima F, Katz J. 1979. Glycogen synthesis by hepatocytes from diabetic rats. Biochem J. 182:727–734. doi: https://doi.org/10.1042/bj1820727
- Gomathi D, Ravikumar G, Kalaiselvi M, Devaki K, Uma C. 2013. Protective effect of the whole plant extract of Evolvulus alsinoides on glycoprotein alterations in streptozotocin induced diabetic rats. J Acute Disease. 148–150.
- Govindaraj J, Sorimuthu Pillai S. 2015. Rosmarinic acid modulates the antioxidant status and protects pancreatic tissues from glucolipotoxicity mediated oxidative stress in high-fat diet:streptozotocin-induced diabetic rats. Mol Cell Biochem. 404(1–2):143–159. doi: https://doi.org/10.1007/s11010-015-2374-6
- Guignot L, Mithieux G. 1999. Mechanisms by which insulin, associated or not with glucose may inhibit hepatic glucose production in the rat. Am J Physiol. 277:984–989.
- Hasanein P, Mohammad Zaheri L. 2014. Effects of rosmarinic acid on an experimental model of painful diabetic neuropathy in rats. Pharm Biol. 52(11):1398–1402. doi: https://doi.org/10.3109/13880209.2014.894090
- Jayanthy G, Subramanian S. 2014. Rosmarinic acid, a polyphenol, ameliorates hyperglycemia by regulating the key enzymes of carbohydrate metabolism in high fat diet–STZ induced experimental diabetes mellitus. Biomed Prev Nutr. 4(3):431–437. doi: https://doi.org/10.1016/j.bionut.2014.03.006
- Jensen J, Rustad PI, Kolnes AJ, Lai YC. 2011. The role of skeletal muscle glycogen breakdown for regulation of insulin sensitivity by exercise. Front Physiol. 2:1–11. doi: https://doi.org/10.3389/fphys.2011.00112
- Jiang WL, Xu Y, Zhang SP, Hou J, Zhu HB. 2012. Effect of rosmarinic acid on experimental diabetic nephropathy. Basic Clin Pharmacol Toxicol. 110(4):390–395. doi: https://doi.org/10.1111/j.1742-7843.2011.00828.x
- Leloir LF, Goldemberg SH. 1962. Glycogen synthetase from rat liver: (Glucose)n+(UDPG)→(Glucose)n+1+UDP. In: Colowick SP, Kalpan NO, editors. Methods in enzymology; vol. 5. New York: Academic Press; p. 145–147.
- Lin L, Dong Y, Zhao H, Wen L, Yang B, Zhao M. 2011. Comparative evaluation of rosmarinic acid, methyl rosmarinate and pedalitin isolated from Rabdosia serra (MAXIM.) HARA as inhibitors of tyrosinase and α-glucosidase. Food Chem. 129:884–889. doi: https://doi.org/10.1016/j.foodchem.2011.05.039
- Luan H, Kan Z, Xu Y, Lv C, Jiang W. 2013. Rosmarinic acid protects against experimental diabetes with cerebral ischemia: relation to inflammation response. J Neuroinflammat. 10:28. doi: https://doi.org/10.1186/1742-2094-10-28
- Lukhoba CW, Simmonds MS, Paton AJ. 2006. Plectranthus: a review of ethnobotanical uses. J Ethnopharmacol. 3:1–24. doi: https://doi.org/10.1016/j.jep.2005.09.011
- Mahmoud AM, Ahmed OM, Ashour MB, Abdel-Moneim A. 2015. In vivo and in vitro antidiabetic effects of citrus flavonoids: a study on the mechanism of action. Int J Diabetes Dev Ctries. 35:250–263. doi: https://doi.org/10.1007/s13410-014-0268-x
- Mahmoud AM, Ashour MB, Abdel-Moneim A, Ahmed OM. 2012. Hesperidin and naringin attenuate hyperglycemia-mediated oxidative stress and proinflammatory cytokine production in high fat fed/streptozotocin-induced type 2 diabetic rats. J Diabetes Its Complicat. 26:483–490. doi: https://doi.org/10.1016/j.jdiacomp.2012.06.001
- Morales MA, Jabbagy AJ, Terenizi HR. 1973. Mutations affecting accumulation of glycogen. Neurospora Newsl. 20:24–25.
- Mushtaq N, Schmatz R, Pereira LB, Ahmad M, Stefanello N, Vieira JM, Abdalla F, Rodrigues MV, Baldissarelli J, Pelinson LP, et al. 2014. Rosmarinic acid prevents lipid peroxidation and increase in acetylcholinesterase activity in brain of streptozotocin-induced diabetic rats. Cell Biochem Funct. 32(3):287–293. doi: https://doi.org/10.1002/cbf.3014
- Nayak SS, Pattabiraman TN. 1981. A new colorimetric method for the estimation of glycosylated haemoglobin. Clin Chem Acta. 109:267–274. doi: https://doi.org/10.1016/0009-8981(81)90312-0
- Niebes P. 1972. Determination of enzymes and degradation products of glycosaminoglycan metabolism in the serum of healthy and varicose subjects. Clin Chim Acta. 42:399–408. doi: https://doi.org/10.1016/0009-8981(72)90105-2
- Pari L, Ashokkumar N. 2006. Glycoprotein changes in non-insulin dependent diabetic rats: effect of N–benzoyl-D-phenylalanine and metformin. Therapie. 61:125–131. doi: https://doi.org/10.2515/therapie:2006022
- Pari L, Rajarajeswari N. 2010. Protective role of coumarin on plasma and tissue glycoprotein components in streptozotocin-nicotinamide induced hyperglycemic rats. Int J Biol Med Res. 13:61–65.
- Pari L, Sankaranarayanan C. 2009. Beneficial effects of thymoquinone on hepatic key enzymes in streptozotocin-nicotinamide induced diabetic rats. Life Sci. 85:830–834. doi: https://doi.org/10.1016/j.lfs.2009.10.021
- Pari L, Saravanan R. 2005. Succinic acid monoetheyl ester and metformin regulatescarbohydrate metabolic enzymes and improves glycemic control instreptozotocin-nicotinamide induced type 2 diabetic rats. Iran J Pharmacol Ther. 4:132–137.
- Pari L, Saravanan S. 2015. Thymol, a monoterpene phenolic compound ameliorates deranged glycoprotein metabolism in HFD-induced diabetic in c57bl/6j mice. Indo–Asian J Multidiscip Res. 1(3):196–204.
- Pieta PG. 2000. Flavonoids as antioxidants. J Nat Prod. 63:1035–1042. doi: https://doi.org/10.1021/np9904509
- Sankaranarayanan C, Pari L. 2011. Influence of thymoquinone on glycoprotein changes in experimental hyperglycemic rats. Int J Nutr Pharmacol Neurol Diseases. 1:51–55. doi: https://doi.org/10.4103/2231-0738.77532
- Saravanan G, Ponmurugan P, Senthil Kumar GP, Rajarajan T. 2010. Antidiabetic effect of S-allylcysteine: effect on plasma and tissue glycoproteins in experimental diabetes. Phytomedicine. 17(14):1086–1089. doi: https://doi.org/10.1016/j.phymed.2010.04.008
- Sotnikova R, Okruhlicova L, Vlkovicova J, Navarova J, Gajdacova B, Pivackova L, Fialova S, Krenek P. 2013. Rosmarinic acid administration attenuates diabetes–induced vascular dysfunction of the rat aorta. J Pharm Pharmacol. 655:713–723. doi: https://doi.org/10.1111/jphp.12037
- Sundaram R, Naresh R, Ranadevan R, Shanthi P, Sachdanandam P. 2012a. Effect of iridoid glucoside on streptozotocin induced diabetic rats and its role in regulating carbohydrate metabolic enzymes. Eur J Pharmacol. 674:460–467. doi: https://doi.org/10.1016/j.ejphar.2011.10.039
- Sundaram R, Naresh R, Shanthi P, Sachdanandam P. 2012b. Antihyperglycemic effect of iridoid glucoside, isolated from the leaves of Vitex negundo in streptozotocin-induced diabetic rats with special reference to glycoprotein components. Phytomedicine. 19:211–216. doi: https://doi.org/10.1016/j.phymed.2011.10.006
- Sundaram R, Naresh R, Shanthi P, Sachdanandam P. 2013a. Effect of iridoid glucoside on plasma lipid profile, tissue fatty acid changes, cytokines and GLUT4 expression in skeletal muscle of streptozotocin induced diabetic rats. Mol Cell Biochem. 380:43–55. doi: https://doi.org/10.1007/s11010-013-1656-0
- Sundaram R, Naresh R, Shanthi P, Sachdanandam P. 2013b. Modulatory effect of green extract on hepatic key enzymes of glucose metabolism in streptozotocin and high fat diet induced diabetic rats. Phytomedicine. 20:577–584. doi: https://doi.org/10.1016/j.phymed.2013.01.006
- Sundaram R, Shanthi P, Sachdanandam P. 2014. Effect of tangeretin, a polymethoxylated flavone on glucose metabolism in streptozotocin–induced diabetic rats. Phytomedicine. 21:793–799. doi: https://doi.org/10.1016/j.phymed.2014.01.007
- Sundaram R, Shanthi P, Sachdanandam P. 2015. Tangeretin, a polymethoxylated flavone, modulates lipid homeostasis and decreases oxidative stress by inhibiting NF-κB activation and proinflammatory cytokines in cardiac tissue of streptozotocin-induced diabetic rats. J Funct Foods. 16:315–333. doi: https://doi.org/10.1016/j.jff.2015.03.024
- Tavafi M, Ahmadvand H, Khalatbari A, Tamjidipoor A. 2011. Rosmarinic acid ameliorates diabetic nephropathy in uninephrectomized diabetic rats. Iran J Basic Med Sci. 143:275–283.
- Trinder P. 1969. Determination of glucose in blood using glucose oxidase with an alternative oxygen acceptor. Ann Clin Biochem. 6:24–27. doi: https://doi.org/10.1177/000456326900600108
- Vats V, Yadav SP, Grover JK. 2004. Ethanolic extract of Ocimum sanctum leaves partially attenuates streptozotocin-induced alterations in glycogen content and carbohydrate metabolism in rats. J Ethnopharmacol. 90:155–160. doi: https://doi.org/10.1016/j.jep.2003.09.034
- Veeramani C, Al-Numair KS, Alsaif MA, Chandramohan G, Al-Numair NS, Pugalendi KV. 2012. Protective effect of Cardiospermum halicacabum leaf extract on glycoprotein components on STZ–induced hyperglycemic rats. Asian Pac J Trop Med. 5(12):939–944. doi: https://doi.org/10.1016/S1995-7645(12)60178-3
- Wagner WD. 1979. A more sensitive assay discriminating galactosamine and glucosamine in mixtures. Anal Biochem. 94:394–396. doi: https://doi.org/10.1016/0003-2697(79)90379-8
- Warren L. 1959. The thiobarbituric acid assay of sialic acids. J Biol Chem. 234:1971–1975.
- Wu D, Wen W, Li C, Qi R, Xia Zhao J, Hua Lu C, Yan Zhong Y. 2012. Ameliorative effect of berberine on renal damage in rats with diabetes induced by high–fat diet and streptozotocin. Phytomedicine. 19:712–718. doi: https://doi.org/10.1016/j.phymed.2012.03.003
- Xie W, Xing D, Sun H, Wang W, Ding Y, Du L. 2005. The effects of Ananas comosus L. leaves on diabetic-dyslipidemic rats induced by alloxan and a highfat/high-cholesterol diet. Am J Chin Med. 33:95–105. doi: https://doi.org/10.1142/S0192415X05002692
- Zhu F, Asada T, Sato A, Koi Y, Nishiwaki H, Tamura H. 2014. Rosmarinic acid extract for antioxidant, antiallergic, and α-glucosidase inhibitory activities, isolated by supramolecular technique and solvent extraction from Perilla leaves. J Agric Food Chem. 62:885–892. doi: https://doi.org/10.1021/jf404318j
- Zhu F, Wang J, Takano H, Xu Z, Nishiwaki H, Yonekura L, Yang R, Tamura H. 2019. Rosmarinic acid and its ester derivatives for enhancing antibacterial,α-glucosidase inhibitory, and lipid accumulation suppression activities. J Food Biochem. 43(2):12719. doi: https://doi.org/10.1111/jfbc.12719