 ?Mathematical formulae have been encoded as MathML and are displayed in this HTML version using MathJax in order to improve their display. Uncheck the box to turn MathJax off. This feature requires Javascript. Click on a formula to zoom.
Abstract
Personalized educational interventions have been shown to facilitate successful and inclusive statistics, mathematics, and data science (SMDS) in higher education through timely and targeted reduction of heterogeneous training disparities caused by years of cumulative, structural challenges in contemporary educational systems. However, the burden on the institutions and instructors to provide personalized training resources to large groups of students is also formidable, and often unsustainable. We present Individualized Pathways and Resources to Adaptive Control Theory-Inspired Scientific Education (iPRACTISE), a free, publicly available web app that serves as a tool to facilitate personalized trainings on SMDS and related topics through provision of personalized training recommendations as informed by computerized assessments and individuals’ training preferences. We describe the resources available in iPRACTISE, and some proof-of-concept evaluation results from deploying iPRACTISE to supplement in-person and online classroom teaching in real-life settings. Strengths, practical difficulties, and potentials for future applications of iPRACTISE to crowdsource and sustain personalized SMDS education are discussed.
1 Introduction
A pervasive problem in education has been that students from disadvantaged backgrounds and traditionally underrepresented groups have not had access to the trainings, preparations, and support amenable for success in rigidly structured academic programs in areas such as Statistics, Mathematics, and Data Science (SMDS) (Ferrini-Mundy Citation2013). Success in first-year college SMDS classes has been shown to be a strong predictor of persistence and retention of students in Science, Technology, Engineering and Mathematics (STEM) majors, and subsequent pursuit of related careers (X. Chen Citation2014). Strong SMDS trainings are also a must for strengthening the rigor of scientific practices in the social and behavioral sciences (Aiken, West, and Millsap Citation2008; Gelman Citation2013; Gelman and Loken Citation2016; Ioannidis Citation2005; Nosek, Spies, and Motyl Citation2012).
Contrary to common student misconceptions, the pre-requisite training needed for success in SMDS education is often specific, circumventable (Brent and Mueller Citation1998; Peck, Gould, and Utts Citation2017; Shiffler and Adams Citation1995), and can be greatly facilitated by many freely available online resources, such as those from the Khan Academy (Khan Academy Citation2017). Unfortunately, knowledge of the specific prerequisites they have not mastered and how to access relevant resources often evades students whose interests and career aspirations can readily benefit from such trainings. In addition, illustrations and examples used in foundational SMDS courses rarely resonate with or have a direct connection to applied science students’ research questions and data. As a result, students in many applied SMDS disciplines often find it challenging to translate concepts and phenomena relevant to their lives into mathematical concepts and procedures.
Research on andragogy, or adult learning (Knowles Citation1973), has revealed that adult students learn best when: (a) they understand why something is important to know or do; (b) they have the freedom to learn their own way; (c) learning is experiential; and (d) the instructional plans build upon the students’ previous experiences, backgrounds, and diversity (Bryan, Kreuter, and Brownson Citation2009; Knowles, Holton, and Swanson Citation2011; Shahidian, Lashgari, and Goodarzi Citation2011). The increased prevalence of interdisciplinary study programs and career opportunities also underscores the need for a next generation of students from diverse educational backgrounds to be trained on traditional SMDS topics. Given the heterogeneity in students’ backgrounds and training goals across disciplines, uniform, “one-size-fits-all” training is insufficient, inefficient, and does not serve any one student well (Rose Citation2016). Personalized training interventions are effective at pinpointing and reducing students’ training deficiencies, especially when delivered in a timely, “just-in-time” manner. However, the burden on the institutions and instructors to provide personalized trainings to large groups of students is also formidable, and often unsustainable.
2 iPRACTISE: Innovations and Design Principles
We present an online digital platform, Individualized Pathways and Resources to Adaptive Control Theory-Inspired Scientific Education (iPRACTISE), that can be accessed at https://ipractise.net. iPRACTISE was written using Shiny (Chang et al. Citation2022), an R package that facilitates building of interactive web apps. To address the aforementioned obstacles to quantitative training in SMDS, iPRACTISE is designed to supplement traditional classroom teaching in a personalized, adaptive, and scaffolded way by providing: (a) digitally facilitated trainings; (b) a control theory-inspired training framework that modifies training recommendations based on ongoing fit between students and training resources; and (c) computerized adaptive assessments that help automate design and implementation of individualized training pathways as informed by students’ past learning experiences. The proof-of-concept case examples included in the present article focus on topics in SMDS. However, the platform can also be used for personalizing educational resources and pathways in other domain areas.
2.1 Digitally Facilitated Design, Development, and Delivery of Educational Contents
The burden on instructors to provide multiple “personalized” training pathways can be heavy. Fortunately, the emergence of technology supporting automated, digital delivery of educational contents makes such student-tailored learning paradigms viable (Hiltz and Turoff Citation2005; Kafai and Resnick Citation1996). There are several advantages to adopting digitally-facilitated or related hybrid approaches to education over traditional classroom approaches. The electronic format: (a) opens participation to students and scholars who otherwise do not have access to traditional courses; (b) eliminates the “warm-up” period typically needed in traditional SMDS courses to review pre-requisite topics; (c) allows participants with varying levels of prior knowledge to gain the background and skills electronically, and then get the most out of the in-person experience; and (d) provides a healthy environment for both delivery and receipt of real-time, personalized feedback in a nonevaluative environment.
The didactic contents of the iPRACTISE system are designed in digital form. They consist both of crowd-sourced digital contents from YouTube and other widely known free educational platforms such as Khan Academy and Massachusetts Institute of Technology OpenCourseWare (MIT OCW), as well as resources developed by our investigator team. Among these in-house resources include the growing collection of over 60 Shiny Apps produced by Penn State’s BOAST project (BOAST Book Of Apps for Statistics Teaching) covers statistics learning objectives from the introductory level to upper division courses for majors (Wang et al. Citation2021). Apps in the collection include expository materials on prerequisites, contextual examples, simulation-based explorations of concepts, and game-based assessments. The BOAST apps integrate well with iPRACTISE since they are open source (https://github.com/EducationShinyAppTeam/BOAST), developed under a consistent style-guide supporting users with visual disabilities, and programmed, with faculty supervision, by undergraduate students who choose topics that they and their classmates find challenging. Thus, students around the world can make use of these modules freely.
2.2 Control Theory-Guided Training Pathways
In engineering, control theory is used to steer a system to stay as close as possible to a desired reference state (Åström and Murray Citation2008; Bellman Citation1964; Rivera, Pew, and Collins Citation2007; Wang et al. Citation2014). Education can be viewed as a control theory problem (see ) in which students seek ongoing input—in the forms of classes, electronic training modules, etc.—to minimize the discrepancies between their actual and target (reference) performance levels. Preliminary promise of using control systems in education has been illustrated in a simulation study conducted within the context of a web-based computer adaptive practice and monitoring system, called the Math Garden (Klinkenberg, Straatemeier, and van der Maas Citation2011), in which person- and time-specific training dosages obtained from a linear quadratic controller were found to yield increased training benefits at reduced costs compared to students’ actual observed training durations, and a fixed-duration training scheme (e.g., training for a constant amount of 14 min per week; Chow et al. Citation2022). The overarching aim of using controllers to accelerate accomplishment of training targets also coincides broadly with the goal of using adaptive assessments to steer the difficulty levels of the test items presented to students in a direction and magnitude that can reveal the students’ true ability levels with high precision and efficiency (Weiss and Kingsbury Citation1984; Park et al. Citation2019).
Fig. 1 Conceptualization of iPRACTISE as a control theory-inspired cruise control system that can be used by students, instructors, and program administrators to recommend optimal training pathways to minimize discrepancies between each student’s current and target ability levels.
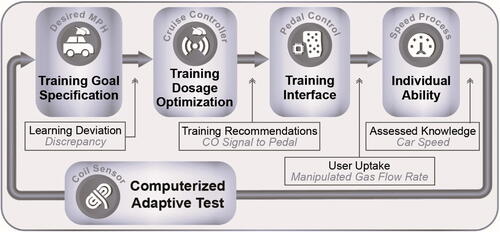
The iPRACTISE system was designed to emulate the purposes of a car’s cruise control system in educational settings by automating, whenever possible, the design and implementation of personalized educational pathways through provision of: (a) a training goal specification interface that allows each user to specify their target ability level; (b) a training dosage optimization algorithm and corresponding training interface that select and deliver the training material that helps bring the user closer to their target ability levels, taking into consideration the user’s current ability level; (c) ongoing evaluations of users’ ability levels via computerized adaptive tests; and (d) repeated iterations through these processes. Training is made cost- and time-efficient by providing students with person-specific recommendations for contents in need of further exposure. Control theory principles have also been infused into iPRACTISE’s training material selection algorithm, as we describe in the next section.
2.3 Individualized Pathways to Learning That Capitalize on Students’ past Learning Experiences
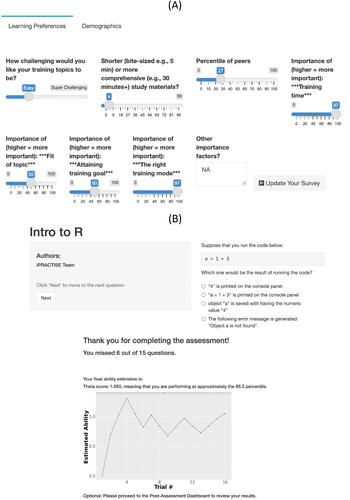
A comprehensive but inefficient training model would require that all students work linearly through a fixed pathway of designated training materials. In contrast, an individualized pathways model leverages and expands students’ existing strengths (Flint and Jaggers Citation2021) The iPRACTISE system automates design and implementation of individualized training pathways in the following ways. Upon initial login, each iPRACTISE user is asked to take a user preference survey that records and evaluates the user’s selected course, training preferences on dimensions such as preferred difficulty level, preferred training modes (e.g., passive vs. interactive tutorial), and preferred length for a given training session (see (A)). Then, the student is asked to take an assessment for the selected course, with the ability estimate of the student provided at the end of the assessment (see (B) for a course on Introduction to R, a statistical software package) and later used to rank training materials in the order that best fits each student’s needs.
Fig. 2 Summary of survey questions designed to help users specify their training goals and preferences; (B) a sample assessment question and progression of a hypothetical student’s estimated ability level during the assessment.
Computerized adaptive testing (CAT) is a method of delivering computerized assessments that capitalizes on pre-calibrated item pool, psychometric models, and test termination criteria to improve both measurement quality and efficiency at all trait levels (Weiss Citation1982). Assessments within iPRACTISE are implemented and administered using the R package, Computerized Adaptive Testing with Multidimensional Item Response Theory (mirtCAT; Chalmers Citation2016). MirtCAT provides tools to generate a web-based interface for creating, administering, providing results, and estimating properties as well as results of educational and psychological tests. The tests may be adaptive or nonadaptive (i.e., traditional fixed-length), and used for evaluating unidimensional or multidimensional constructs. Within the mirtCAT, the Metropolis-Hastings Robbins-Monro (MHRM; Cai Citation2010) algorithm, among a few other possible algorithms, is available for simultaneous item parameter and person ability estimation.
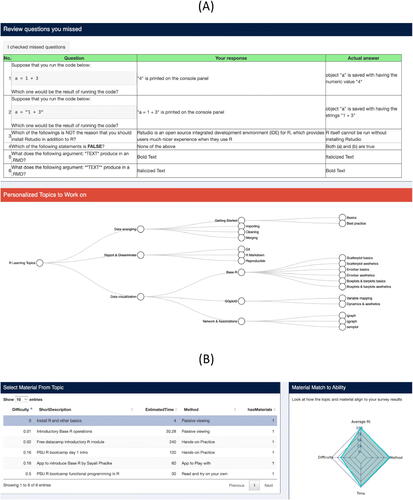
Drawing on information from the assessment, iPRACTISE provides for each user a summary of the missed questions, a personalized course tree that displays the topics on which each student has not mastered (see ), a table of training materials for each training topic ranked in descending order of fit to the student (see ) across three dimensions: the easiness level of the material relative to the user’s current ability, the estimated training time involved (in minutes) relative to the user’s preference, and fit of the method of delivery relative to the user’s preference. We compute an average fit as the Euclidean distance between the user’s specified target levels and attributes of each training material as
(1)
(1) where i indexes person, t indexes time, h indexes training material, and k indexes attribute. Person Attributeitk represents person i’s attribute along the k = 1, …, 3 dimensions, including the person’s projected ability level at the current time t, preferred training time on each training material in minutes, and preferred method of training delivery. Material Attributehk represents the corresponding attribute of material h. Relative fit of each training material to the user on each of these three attributes is also computed and displayed graphically as a radar plot (see (B)).
Fig. 3 Personalized post-assessment dashboard for a hypothetical student on Introduction to R, with: (A) a summary of the questions missed by the student and the correct responses; and (B) training materials ranked in descending order of fit to the student, with fit information across attributes (in terms of difficulty level, method of delivery, and estimated training time).
The iPRACTISE system is designed to recommend training materials that are close to, but slightly more difficult than the individual’s current ability level. We refer to this recommended level of difficulty as the person’s projected ability level. This attribute is computed as
(2)
(2) where θit denotes person i’s current ability level at time t as available from a computerized assessment (adaptive or fixed-length), weighti represents a scalar weight, currently set to an arbitrary constant of 0.5, that determines the intensity of the user’s training progression, and may be altered in the future to be empirically based as more data become available. Target ability
represents person i’s target ability as assessed using the standard normal quantile (z-score) of each student’s sliding scale response to the survey question, “What is your training goal? To be as good as or better than what percentage of people pursuing education on the same topic?” In other words, iPRACTISE determines a person’s projected ability level either based on a small projected increase as proportionate to the person’s ability level, or as proportionate to the person’s current deviation in ability level compared to their specified target ability level, both controlled by weighti.
To provide a pseudo-numeric (i.e., ordinal) scaling to the attribute of training delivery method, we rank the four types of delivery method, namely, “stuff to read,” “try as you read,” “video to watch,” and “app to play with,” based on their increasing engagement of distinct sensorimotor channels for information acquisition, namely, with visual, visual + audio, and visual + audio + motor inputs, respectively (Petty 2010).
We did not standardize each of these attributes prior to calculating the Euclidean distances between the training materials and the users’ attributes. Given these attributes’ original scales, the average fit measure tends to weigh deviations in training time from the user’s specified more heavily than other attributes. In addition to this overall fit measure, we also provide users with a percentage of fit measure across each of the training attributes, as summarized in the radar plot shown in (B). Given these choices, the user then has the option to follow the system’s recommendations, or browse other training materials of choice.
3 Proof-of-Concept Studies
We present three proof-of-concept studies aimed at illustrating some of the hurdles, challenges, and solutions encountered by the iPRACTISE team in developing, using, and evaluating the strengths and weaknesses of the system in supporting SMDS trainings. Studies that provided data for these case examples were approved by the lead institution’s Institutional Review Board under study numbers STUDY00009286 and STUDY00018662. All participants provided consent for use of their de-identified data for the purposes of enhancing the design and educational goals of iPRACTISE.
3.1 Study 1: Development and Evaluation of Personalized Assessments in iPRACTISE Using CATs
In this study, we describe the challenges encountered in developing and delivering a personalized CAT via iPRACTISE to evaluate students’ mastery of training resources from the BOAST project (Wang et al. Citation2021). The specific Shiny apps we used as training resources provided expository materials on characteristics of different discrete and continuous probability. We summarize some proof-of-concept results validating the utility of using CAT as an assessment tool even under limited historical data for item calibration purposes, and delineate some of the instructor utility and resources available in iPRACTISE for educators interested in using iPRACTISE to design and deliver their own adaptive assessments in the future.
Consistent with common procedures of adaptive test developments (Thompson and Weiss Citation2011), we used historical nonadaptive student performance data from n = 53 users of the BOAST shiny apps recruited from a probability theory class. Using these students’ responses to the items, we estimated the parameters of the items (e.g., item difficulty levels) using a Rasch model (Rasch Citation1960), one of the simplest item response theory (IRT) models, expressed as
(3)
(3) where
1 indicates that student i’s response to item j is correct at time t(and 0 otherwise), θit corresponds to student’s i ability on a unidimensional construct at time t, and ψj is an intercept, commonly referred to as the easiness level of item j. The items spanned four major topics (basics, univariate models, multivariable techniques, and limit theorems) as designed by the course instructor. Even though other more complex (e.g., unidimensional models with item-specific discrimination parameters, multidimensional models) are available in mirtCAT, we chose the Rasch model for its relative simplicity under the constraints of limited data available for calibration purposes. We estimated parameters of the Rasch model using the MH-RM algorithm (Cai Citation2010; see details of the MHRM algorithm and the code used in the study examples can be accessed at: osf.io/vr43t).
Previous simulation studies on CAT designs and corresponding estimation of item properties often suggested desired sample sizes that are challenging to attain in real-life instructional settings, especially for more complicated item response models (Flaugher 2000). For example, Yoes (Citation1995) suggested that 500–1000 examinees are needed per item for the three-parameter IRT model. More practical perspectives have also been brought up by others. For instance, Linacre (Citation1994) reported that when the Rasch model was assumed, with a reasonably targeted sample of 50 persons and 10 or more items, there is 99% confidence that the estimated item difficulty is within ± 1 logit of its stable value—an uncertainty level that is arguably satisfactory, or useful enough for most practical purposes. With 200 persons, there is 99% confidence the estimated value is within ± 0.5 logit.
We fitted the Rasch model to the BOAST calibration data from 53 users on 120 test items. Each student took a test set consisting of overlapping and a subset of distinct items selected from the total item pool, where the number of assessment items varied (min 4, max
56, mean
18.23, median
14, SD
14.39). Of these items, 23 of them were not administered to any students, and were thus excluded in the item parameter estimation process. The course instructor provided supplementary expert ratings of the easiness levels of these 23 items to build up a CAT module for the complete item bank. We then designed and implemented an adaptive test with a pool of 120 items, with item easiness levels comprising a mixture of the instructor’s expert ratings of 23 items, as well as 97 items with properties estimated using the calibration sample. We obtained a new test sample of
49 students who completed the new adaptive test.
Scoring of the person-specific ability estimates, θi, at fixed (based on estimates from the calibration sample and instructors’ expert ratings) values of θi was performed by finding the maximum of the posterior distribution of θ (MAP). Delivery of the CAT test also required determination of the item selection criteria and a stopping rule. We used the default option in mirtCAT, the maximum information criterion, as the item selection criterion. This dictated that the system sequentially choose the next most informative item for individual i (i.e., an item that maximizes the Fisher information, , or equivalently, minimizes the standard error around the ability estimate for that person). Other available item selection criteria (for details see (Chalmers Citation2016)) included random selection of items, selection of items based on the Kullback-Leibler information, and other criteria that are relevant for multidimensional IRT models (e.g., the D-rule, which selects an item that maximizes the determinant of the joint Fisher information matrix; and the T-rule, which maximizes the trace of the joint Fisher information matrix). Finally, we specified a stopping rule such that the adaptive test would terminate for each user when the minimum standard error (min_SEM) for the user’s ability estimate was less than 0.3, or when the change in ability estimate for the user (delta_thetas) was less than 0.1 in successive items. Using these criteria led to adaptive tests that consisted of an average of 10.86 (median
11; range
9–13, SD
0.78) items for each student. As a contrast, allowing students in the calibration sample to access the BOAST trainings and subsequent assessments led to use of 17.32 items (median
13, range
4–54, SD
13.82). We adopted the default options in mirtCAT for other adaptive test estimation details (see Chalmers Citation2016).
A scatterplot comparing the initial item easiness ratings used in the adaptive test (based on estimates from the calibration sample and instructor’s expert ratings) and the updated item easiness estimates after combining all available data across samples are shown in (A). The plot indicated generally strong correlation between the two sets of item easiness estimates (r = 0.73), with more notable discrepancies among items in the mid-range difficulty levels.
Fig. 4 (A) Scatterplot of the updated item easiness estimates compared to item easiness used initially in the BOAST adaptive test, which consisted of a combination of estimates from the calibration sample and instructor’s expert ratings; and (B) histogram plots showing the distributions of standard errors (SEs) in ability estimates in the adaptive as compared to the calibration groups. Students who were exposed to a similar range of number of items (between 8 and 10 items) across the two test groups were highlighted with a darker shade, and their respective averages in SE estimates are depicted in text.
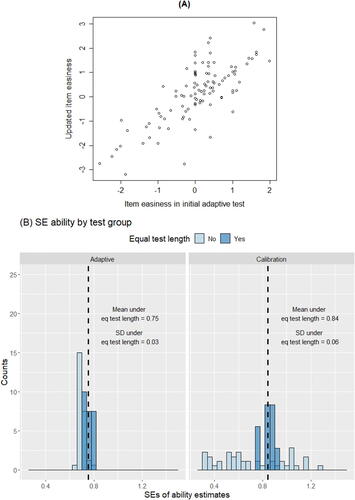
In terms of precision (SE) of the ability estimates (see (B)), the precision in ability estimates obtained in this study was commensurate with that reported by Linacre (Citation1994) at a similar sample size. Higher precision in ability estimates was observed in the adaptive (mean SE in ability estimates 0.71; SD
0.04) than the calibration sample (mean SE
0.74; SD
0.26). These summary statistics suggested that the adaptive test gave rise to more homogeneous (SD of the SE
0.04 compared to 0.26) levels of precision (or conversely, uncertainty) across different values of student ability. To further highlight the effects of the adaptive test, we compared a subset of students from the calibration and adaptive samples who were exposed to a similar range of test lengths (8–10 items). We found that ability estimates based on the adaptive test were consistently characterized by higher precision (i.e., lower SEs) in student ability estimates (mean SE in ability estimates
0.84 and SD
0.06 in the calibration sample; mean SE
0.75 and SD
0.03 in the adaptive sample). Thus, unlike standard fixed-length tests that are designed to target the “typical” students (e.g., students at the median performance level in a class), adaptive tests deliver specialized items to reduce the uncertainty around each student’s ability estimate even under similar test lengths.
Admittedly, substantial variability in person ability estimates was still present given the limited sample size and number of items for item calibration and person scoring purposes. Nevertheless, the study provided some proof-of-concept results on the feasibility and utility of adding adaptive tests to existing online SMDS training and assessment tools even under finite sample and item sizes. Ongoing efforts are underway to update item easiness estimates as new data become available. For instance, the BOAST project has, since the conclusion of the adaptive test, accumulated data from n = 1179 diverse users from around the world across a broader array of test items. These data were not available as “historical data” for item pre-calibration purposes during the adaptive testing phase for the comparisons to fixed-length test described in this study, but will be used to update the model and item parameters in iPRACTISE in future iterations. For the overlapping items, updated item easiness estimates based on this new, expanded dataset were found to correlate moderately strongly (r = 0.51) with the item easiness estimates in the previous iteration of item bank in iPRACTISE combining data from the calibration and adaptive samples.
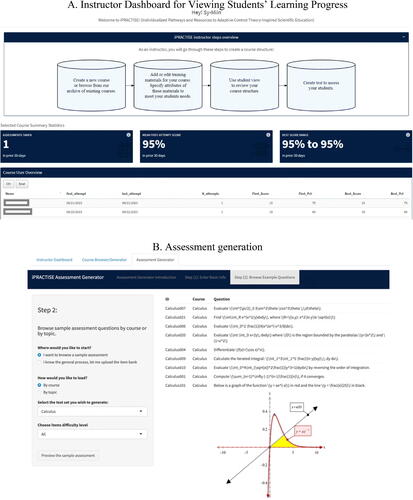
In summary, the proof-of-concept results from this study underscored the utility of using CAT as an assessment tool even under limited historical data for item calibration purposes, but also the need to make adaptive test design, implementation, and delivery more accessible to instructors and educators across multiple domains. To facilitate efforts along this line, iPRACTISE is now equipped with an instructor module to allow instructors to design and implement their own adaptive tests, and a dashboard to inspect student progress and learning deficiencies (see screenshots in ). The iPRACTISE system does not currently automate test item creation and content balancing. Rather, it provides course and test design interfaces to allow instructors to specify the structure of topics and subtopics for a new course based on existing examples in our course archive, upload new test items that map onto these specified topics and subtopics, and customize other assessment settings, for instance, as a fixed-length or adaptive test. In the case of the latter, if a pre-calibrated model (such as the Rasch model used and calibrated in the present example) does not exist, the instructor is encouraged to work collaboratively with the developer team to specify the nature of the model and other adaptive test settings (e.g., for alternatives to the default options) to be adopted for real-time estimation of students’ ability levels.
Fig. 5 Screenshots of selected instructor functionalities in iPRACTISE, including: (A) a dashboard for viewing students’ progress; and (B) an assessment portal for browsing through and selecting existing assessment items from the test archive, as well as adding new items.
3.2 Study 2: Insights from Using iPRACTISE to Support R Learning
This study describes our work in crowd-sourcing training and assessment contents for a course on Introduction to R, and share insights from a psychometric analysis of the assessment items used to support R learning. R is a programming language that has gained tremendous traction and usage across multiple scientific disciplines. Across institutions, such as those to which the coauthors and other collaborators are affiliated, R is being taught independently and as separate classes across multiple departments. Elsewhere, introductory R workshops are routinely offered with simplified data (e.g., no missingness), or on specialized topics with discipline-specific examples. In high demand but clearly lacking are efforts to crowd-source and consolidate training contents in ways that help instructors and students connect R programming skills with individual courses.
The authors engaged in collaborative crowd–sourcing of key topics of importance, and assembled training and selected assessment contents thought to fulfill specific training purposes across several graduate-level departmental courses on introductory statistics. Examples of these key topics, as shown in the sample course tree in , include data wrangling, reporting and dissemination, and data visualization. Data wrangling, for example, includes subtopics such as getting started, importing, cleaning, and merging data. For reporting and dissemination, the team suggested Git, R Markdown, and best practices for reproducibility as among the topics that are relevant for introductory R courses across disciplines. In terms of data wrangling and visualization, the team discussed some of the growing divergence in data display trends, practices, as well as corresponding didactic materials using Base R as compared to those using newer packages such as ggplot2 (Wickham Citation2016) and dplyr (Wickham et al. Citation2022).
We collected student performance data on a subset of R assessment items from students recruited from SMDS-related workshops and courses that used R to some extent, and Amazon Mechanical Turk (MTurk). Of these participants, those who did not show sufficient variability in their assessment responses were excluded from the analysis, yielding a total of n = 104 participants whose responses were used for estimating characteristics of the test items. Approximately 50% of the retained participants (n = 52) were participants recruited from MTurk. MTurk is an online marketplace that can be used to collect data online quickly and affordably. We used CloudResearch, a third-party website that allowed us to specify targeted screening criteria reflecting our interest in recruiting participants with English as their primary language, had reliable internet connection, were comfortable with computerized assessments, and showed interest in obtaining digital educational trainings. Past studies have shown that respondents on MTurk tended to be young, well educated, and frequent technology users (Hitlin Citation2016). Thus, participants recruited through this channel, comprising predominantly of novice R users who were comfortable with digital assessment and didactic environments, offered a helpful complement to our remaining sample, which consisted of relatively skilled participants with prior exposure to R through their enrolled courses and workshops.
Items for which the students scored an average of above 0.95 or below 0.05 across all items (i.e., 95% or more of the students answered those items correctly or incorrectly, respectively) were excluded from all analyses. Results from fitting the Rasch model suggested that items on topics related to data wrangling, reporting, and dissemination tended to have higher difficulty levels. We examined the local dependence (LD) pairwise statistic between each pair of items, which is very similar to a signed value (Chen and Thissen Citation1997). Several items with local dependence statistics that exceeded the
(0.99) critical value were evaluated in detail for potential violation of the unidimensional assumption of the Rasch model. A closer inspection of these items revealed that some of these dependencies might stem from similarly worded items (e.g., between one item that asked the user how to install a package in R and another one that asked how to load a package in R, which involve distinct commands in R but are typically performed sequentially in practice), and among some of the test items based on specialized packages such as dplyr or R Markdown. We found high local dependence among several, basic base R-related questions that were geared toward novices to the R language, and a subset of overly difficult items that yielded relatively limited response variability.
We compared the fit of the Rasch model (denoted as Model 1 in ) to other alternatives (see ), including a 2-parameter logistic (2PL) model (Model 2), a unidimensional model in which the slope of θi (a re-parameterized version of the discrimination parameter in the item response modeling literature) was allowed to vary by item as opposed to fixed at unity as in (3). Inspection of fit measures such as the Akaike Information Criterion (AIC; Akaike Citation1973), Bayesian Information Criterion (BIC; Schwarz Citation1978), sample size-adjusted BIC (SABIC; Sclove Citation1987; Tofghi and Enders Citation2007), and R , as well as estimates of the item easiness and slopes from the 2PL model suggested that this model, though satisfying conventional criteria for convergence and showing evidence of improved fit and effect size based on the AIC, SABIC, and R
, led to extreme item parameter estimates (item easiness and slope values that were <–10 and >10) for a subset of 17 items that might be too easy or difficult for the sample to yield sufficient response variability for meaningful identification of item parameters. We proceeded by imposing equality constraints, respectively, on the subsets of overly easy and difficult items, leading to Model 3. Model 3 was found to yield better fit compared to the Rasch model in terms of AIC, and SABIC, in contrast to only slight reduction in R2 (R
) compared to the full 2PL model (Model 2; R
). Finally, a bi-factor model was fitted as an alternative way to capture lingering covariations among the residuals associated with the overly easy or difficult items. This model and other related extensions (e.g., a two-factor model) did not show evidence of improved fit compared to the simpler 2PL variations assuming unidimensionality. Thus, even though some individual differences were observed in the estimated ability levels of student participants enrolled in SMDS courses/workshops (mean ability estimate
0.70, SD
0.69; mean SE in ability estimate
0.36) in comparison to those recruited from MTurk (mean ability estimate
, SD
0.82; mean SE in ability estimate
0.37), there was no systematic evidence favoring a multidimensional than a unidimensional model for R learning.
Table 1 Comparisons of fit across several alternative Item Response Theory models of individuals’ response patterns in the Introduction to R course.
Capitalizing on results from the item response analysis, we have now updated the parameters in the item bank of iPRACTISE to use estimates from the preferred 2PL model with equality constraints. Calibration results from this study are by no means an end but rather, reflect our ongoing efforts to refine item parameters in our test bank to support future SMDS training and testing needs.
3.3 Study 3: Survey Results Evaluating Features of iPRACTISE
The third study presents results from a follow-up user survey administered to a subset of participants from Study 2 as well as newly recruited participants to evaluate their perceived utility of several key features of iPRACTISE. The participants were asked to complete within iPRACTISE a brief learning preference survey, followed by general training resources (i.e., not personalized based on the user’s current ability and learning preferences), and a computerized assessment on Introduction to R, which provided calibration data for Study 2. Following the assessment, participants were directed to the student post-assessment dashboard in iPRACTISE, on which they were presented with a summary of their assessment results, topics they have not mastered, and choices to browse through personalized (based on their newly available ability estimates and learning preferences) training materials. Following approximately 50 min of assessment/training time in iPRACTISE, the participants were asked to complete an online survey to share their feedback on iPRACTISE. Our questions specifically targeted the participants’ perceived relative importance of different training material attributes in guiding the participants’ selection choices, and their perceived usefulness of a list of iPRACTISE features.
The participants indicated a range of 0–5+ years of experience of using R (Mean 0.37, SD
1.06). Following data cleaning and exclusion of participants who provided data with limited variability across questions, data from a sample of n = 73 users (77.7% or n = 52 of whom were recruited from MTurk to reflect more heavily the learning preferences of novice users, the primary target audience of iPRACTISE) were retained for data analysis. Training material attributes the participants were asked to rate (on a scale of 0–100) included: fit of the difficulty level of a material relative to the participant’s ability (abilityFit), fit of the method of delivery of the material (method), fit of the topic (topicFit), training time (trainingTime), and visual appeal of the training material (visual appeal). shows the summary statistics for these participants’ ratings. Across attributes, we found that fit of the material to the participant’s ability level and fit of the topic were found to be the most important determinants of the participants’ choices of training materials, followed by delivery method and training time. Visual appeal was rated relatively low (mean
51.22 on a scale of 0–100).
Table 2 Summary statistics for the rated importance (on a scale of 0–100) of attributes hypothesized to help participants select training materials.
The iPRACTISE features that the participants were asked to rate on a scale of 0–100 (see ) included the availability of computerized assessment (TimelyAssessment), the course tree that summarized key topic of interest (CourseTree), personalized version of the course tree (PersonanlizedCourseTree), table summary of the missed responses with correct answers (SummaryMissedQs), radar plot depicting fit of the materials (GraphicalFit), rank ordering of the training materials in terms of fit to each participant (RankOrder), and training resources provided to the participants (TrainingResource). In general, the average ratings of usefulness were higher than 59 out of a scale of 0–100 across all of the features considered. The most useful features were the collection of training resources and table of missed responses. The personalized course tree (M 70.56, SD
26.16) was rated to be more helpful than the general course tree (M
59.51, SD
28.16). Results from the rank-ordering algorithm and the assessment itself were also rated relatively high, even though the visual display of fit (the radar plot), while still generally rated as useful, was perceived to add relatively little incremental value.
Table 3 Summary statistics for the rated usefulness (on a scale of 0–100) of selected iPRACTISE features.
In general, some individual differences were found in the attributes and features reported to be most useful or important to the individuals. We found that across participants, ratings of usefulness and importance across all training attributes tended to correlate negatively with the participants’ years of experience of R, suggesting (unsurprisingly) that the contents and resources in the Introduction to R course were likely better tailored to novices and users relatively new to R. In addition, there were notable positive associations between abilityFit and topicFit ( 0.34), signifying that individuals who valued fit of topic in selecting training materials also tended to value materials geared toward their ability levels. In contrast, participants who rated the visual appeal of training materials as important in guiding their own selection decisions also rated the delivery method of training materials to be more important (
0.48) and described the radar plot provided by iPRACTISE as more useful (
0.36). Overall, we found that some of students’ biggest struggles in obtaining training on a topic such as R are lack of insights targeted, resources, and didactic tools that help them identify and improve their person-specific training deficiencies.
3.4 Summary of Study Results
We presented three proof-of concept studies to illustrate the current utility functions and resources in iPRACTISE, and ongoing efforts for future extensions. Study 1 provided some proof-of-concept results to support the utility of using CAT as an assessment tool even under limited historical data for item calibration purposes, thus highlighting the rationale for our ongoing efforts to expand iPRACTISE’s instructor support functionalities to make adaptive test design, implementation, and delivery more accessible to educators across multiple domains. Study 2 shared results from a psychometric analysis of assessment items from a crowd-sourced course on Introduction to R, and suggested a 2 PL model with equality constraints on the slope parameters for overly easy and difficult items, respectively, to be the preferred model for data from participants with a diverse range of mastery levels. Study 3 presented survey results that helped identify the most useful features of iPRACTISE to be its training resources, table of missed responses, and personalized course tree, which, when used in combination, provide users with targeted, personalized recommendations for training pathways and resources.
4 Discussion
In this article, we described the features, resources, and some evaluation results associated with iPRACTISE, a free publicly available web app that serves as a tool to facilitate personalized trainings on SMDS and related topics through provision of personalized training recommendations as informed by computerized assessments and individuals’ training preferences.
Generally, the rich and widespread availability of training topics on SMDS already in the public domain provides great resources for designing and implementing iPRACTISE modules. The sorting algorithms in iPRACTISE provide several possible options to align users with training materials. Future extensions should consider further refinements of these algorithms. Aside from SMDS training, examples of other educational applications that may benefit from use of control theory principles include educational apps targeting other learning domains such as reading, and mobile health devices providing user-initiated, just-in-time recommendations on intervention strategies and dosages.
Our training recommendations could be further personalized. For example, a student with prior training in probability theory and matrix algebra but no prior exposure to R would ideally receive waivers or rapidly progress through the former topics, and spending time, instead, to learn R and practice mapping technical concepts to empirical applications using R. Conversely, a student with the desire to pursue a master’s degree in SMDS may already have some prior training in R and be well versed in ways to connect scientific thinking to empirical applications, but show limited understanding of concepts such as random variables and calculus, which prevents them from “hitting the ground running” in a traditional introduction to probability class. This student can benefit from targeted exposure to selected foundational topics to fill these learning gaps.
Another aspect of iPRACTISE in need of further developments is that the app, while inspired by control theory principles, did not capitalize on control theory algorithms (Bellman Citation1964; Chow et al. Citation2022; Goodwin, Seron, and Doná Citation2005; Kwon and Han Citation2005; Wang et al. Citation2014) to provide recommendations on optimal training dosages and intervals. One such way, as evaluated in Chow et al. (Citation2022), is to use empirical data to provide evidence-based estimates of recommended practice durations that are proportionate to each student’s ongoing negative deviations in ability level compared to that student’s target performance level. Other possibilities include expansion of iPRACTISE usage in broader settings and over time to collect longitudinal student data needed to better characterize learning progression, and engagement in collaborative efforts to crowd-source data, resources, and insights to enhance future developments of evidence-centered online educational tools (Choi and Mislevy Citation2022).
The feasibility and utility of the heuristic approach investigated in study 1 to jump-start CATs for a probability theory course depend heavily on the quality of the instructor’s ratings of item easiness levels. Even though instructors may be the best experts on subject matter for their particular student audience, what is difficult in one educational context may be easy in another context. Thus, the desired peer percentiles expressed by users in their initial survey of preferences, as implemented in the current version of iPRACTISE, can show disconnect compared both to the instructors’ ratings of item characteristics, and/or to the calibrated item properties obtained from the sample of users accumulated to date. Allowing instructors or program administrators to specify the target training goals for students may help reduce students’ training disparities relative to objective outcomes, and should be considered in future versions of iPRACTISE. In a similar vein, our current setting of allowing students to specify their own training preferences (e.g., preferred training time and method) may not provide the most effective and timely recommendations to circumvent students’ training disparities. Further integration of instructor input, ongoing assessments of students’ training disparities, and evidence-based training recommendations is critical for ensuring optimal training results. In the future, we hope to use well-established Integrative Data Analysis (IDA) frameworks for conducting simultaneous analysis of item response data pooled across multiple classrooms and schools with similar training goals, and pursue multilevel modeling extensions whenever possible to directly model inter-individual differences (e.g., age, gender, ethnicity, field of study) within and across classrooms/schools (Curran and Hussong Citation2009; McArdle et al. Citation2009).
Our design and development of iPRACTISE were motivated by the current scarcity of educational tools to support higher education and lifelong learning in a personalized, adaptive, and scaffolded way. Most students in this digital age are fortunate to have ready access to a repertoire of digital learning resources. Still, despite the convenience offered by digital and online educational tools, these technological advances may not be readily available or accessible to those who can readily benefit from them. We wholeheartedly acknowledge that iPRACTISE is an emerging product and much remains to be done. Our version of a more “mature” version of iPRACTISE requires further improvements in the precision of the item and user ability level estimates pre-calibrated with data from more participants (e.g., n > 1000), inclusion of more diverse training resources to enable true personalization of training pathways and contents, improved algorithms for pinpointing optimal training materials for students and instructors, and greater integration of students’ and instructors functionalities to allow ongoing customizations of iPRACTISE training settings based on changes in student performance. We hope that this first version of iPRACTISE can serve as an initial proof-of-concept platform that helps promote collaborations with partnering institutions, which, in turn, provide national data to evaluate and improve the efficacy and scalability of iPRACTISE as a platform for screening training deficiencies; delivering personalized just-in-time training interventions; crowdsourcing SMDS training and test materials; and building and fostering a sustainable faculty community to support each other in using iPRACTISE to meet the learning goals of diverse student populations.
Acknowledgments
Programming and other test construction activities have been facilitated by Ryan Voyack, Dongyun You, Anno Zhang, Yang Gao, Thomas Schaeffer, and Molly Gill; and recommendations on training resources by Drs. Timothy R. Brick, Kelly Rullison, Matthew Beckman, Rick Gilmore, Puiwa Lei, Kathryn Drager, Guangqing Chi, David Hunter, Michael Russell, Andrea McCloskey, Michael Rutter, Niel Hatfield, Priyangi Bulathsinhala, and other faculty and students of QuantDev. Instructors and educators interested in using the iPRACTISE may contact the iPRACTISE team at [email protected] to request an instructor account.
Data Availability Statement
Data analysis scripts and de-identified data for which students have given consent to share their data to enhance the designs, developments, and delivery of statistics, mathematics, and data science education are openly available in the Open Science Framework at osf.io/vr43t. Other historical data collected in previous classes and used for calibration of assessment items within iPRACTISE are not shared when student consent was not obtained previously and the data could contain identifying information.
Disclosure Statement
The authors report there are no competing interests to declare.
Additional information
Funding
References
- Aiken, L. S., West, S. G., and Millsap, R. E. (2008), “Doctoral Training in Statistics, Measurement, and Methodology in Psychology: Replication and Extension of Aiken, West, Sechrest, and Reno’s (1990) Survey of PhD Programs in North America,” The American Psychologist, 63, 32–50. DOI: 10.1037/0003-066x.63.1.32.
- Akaike, H. (1973), “Information Theory and an Extension of the Maximum Likelihood Principle,” in Second International Symposium in Information Theory, eds. B. N. Petrov, and F. Csáki, pp. 267–281, Budapest: Akadémiai Kiadó. DOI: 10.1007/978-1-4612-1694-0_15.
- Åström, K. J., and Murray, R. M. (2008), Feedback Systems: An Introduction for Scientists and Engineers, New Jersey: Princeton University Press. DOI: 10.2307/j.ctvcm4gdk.
- Bellman, R. (1964), “Control Theory,” Scientific American, 211, 186–200. DOI: 10.1038/scientificamerican0964-186.
- Brent, R. I., and Mueller, G. (1998), Just the Basics, Please: A Quick Review of Math for Introductory Statistics, Boston, MA: Addison-Wesley, Longman.
- Bryan, R. L., Kreuter, M. W., and Brownson, R. C. (2009), “Integrating Adult Learning Principles into Training for Public Health Practice,” Health Promotion Practice, 10, 557–563. DOI: 10.1177/1524839907308117.
- Cai, L. (2010), “Metropolis-Hastings Robbins-Monro Algorithm for Confirmatory Item Factor Analysis,” Journal of Educational and Behavioral Statistics, 35, 307–335. DOI: 10.3102/1076998609353115.
- Chalmers, R. P. (2016), “Generating Adaptive and Non-Adaptive Test Interfaces for Multidimensional Item Response Theory Applications,” Journal of Statistical Software, 71, 1–39. DOI: 10.18637/jss.v071.i05.
- Chang, W., Cheng, J., Allaire, J. J., Sievert, C., Schloerke, B., Xie, Y., et al. (2022), Shiny: Web Application Framework for R [Computer Software Manual] R package version 1.7.2.
- Chen, W. H., and Thissen, D. (1997), “Local Dependence Indices for Item Pairs Using Item Response Theory,” Journal of Educational and Behavioral Statistics, 22, 265–289. DOI: 10.2307/1165285.
- Chen, X. (2014), “STEM Attrition: College Students’ Paths into and out of STEM Fields (NCES 2014-001),” Technical Report, National Center for Education Statistics, Institute of Education Sciences, U.S. Department of Education. Washington, DC
- Choi, Y., and Mislevy, R. J. (2022), “Evidence Centered Design Framework and Dynamic Bayesian Network for Modeling Learning Progression in Online Assessment System,” Frontiers in Psychology, 13, 742956. DOI: 10.3389/fpsyg.2022.742956.
- Chow, S., Lee, J., Hofman, A., van der Maas, H. L. J., Pearl, D. K., and Molenaar, P. C. M. (2022), “Control Theory Forecasts of Optimal Training Dosage to Facilitate Children’s Arithmetic Learning in a Digital Educational Application,” Psychometrika, 87, 559–592. DOI: 10.1007/s11336-021-09829-3.
- Curran, P. J., and Hussong, A. M. (2009), “Integrative Data Analysis: The Simultaneous Analysis of Multiple Data Sets,” Psychological Methods, 14, 81–100. DOI: 10.1037/a0015914.
- Ferrini-Mundy, J. (2013), “Driven by Diversity,” Science, 340, 278–278. DOI: 10.1126/science.1235521.
- Flaugher, R. L., (2000), “Item Pools,” in Computerized Adaptive Testing: A Primer (2nd ed.), ed. H. Wainer, pp. 61–84, Mahwah, NJ: Lawrence Erlbaum. DOI: 10.4324/9781410605931-11.
- Flint, A. S., and Jaggers, W. (2021), “You Matter Here: The Impact of Asset-Based Pedagogies on Learning,” Theory into Practice, 60, 254–264. DOI: 10.1080/00405841.2021.1911483.
- Gelman, A. (2013), “Ethics and Statistics: It’s Too Hard to Publish Criticisms and Obtain Data for Republication,” CHANCE, 26, 49– 52. DOI: 10.1080/09332480.2013.845455.
- Gelman, A., and Loken, E. (2016), “The Statistical Crisis in Science,” in The Best Writing on Mathematics, ed. M. Pitici, pp. 305–318, Princeton: Princeton University Press. DOI: 10.1515/9781400873371-028/.
- Goodwin, G., Seron, M. M., and Doná, J. A. (2005), Constrained Control and Estimation: An Optimisation Approach (1st ed.), London: Springer-Verlag. DOI: 10.1007/b138145/.
- Hiltz, S. R., and Turoff, M. (2005), “Education Goes Digital: The Evolution of Online Learning and the Revolution in Higher Education,” Communications of the ACM, 48, 59–64. DOI: 10.1145/1089107.1089139.
- Hitlin, P. (2016), Research in the Crowdsourcing Age, a Case Study, Washington DC: Pew Research Center. Available at http://www.pewinternet.org/2016/07/11/research-in-the-crowdsourcing-age-a-case-study/
- Ioannidis, J. P. A. (2005), “Why Most Published Research Findings Are False,” PLoS Medicine, 2, e124. DOI: 10.1371/journal.pmed.0020124.
- Kafai, Y. B., and Resnick, M., eds. (1996), Constructionism in Practice: Designing, Thinking, and Learning in a Digital World, Mahwah, NJ Lawrence Erlbaum Associates. DOI: 10.4324/9780203053492.
- Khan Academy. (2017), “Khan Academy,” available at https://www.khanacademy.org/ (accessed 20-October-2017).
- Klinkenberg, S., Straatemeier, M., and van der Maas, H. L. J. (2011), “Computer Adaptive Practice of Maths Ability Using a New Item Response Model for on the Fly Ability and Difficulty Estimation,” Computers & Education, 57, 1813–1824. DOI: 10.1016/j.compedu.2011.02.003.
- Knowles, M. S. (1973), The Adult Learner: A Neglected Species (1st ed.), Houston, TX: Gulf Publishing.
- Knowles, M., Holton, E., and Swanson, R. (2011), The Adult Learner, London Routledge. DOI: 10.4324/9780080964249.
- Kwon, W. H., and Han, S. H. (2005), Receding Horizon Control: Model Predictive Control for State Models, London Springer. DOI: 10.1007/b136204.
- Linacre, J. (1994), “Sample Size and Item Calibration Stability,” Rasch Measurement Transactions, 7, 328.
- McArdle, J. J., Grimm, K. J., Hamagami, F., Bowles, R. P., and Meredith, W. (2009), “Modeling Life-Span Growth Curves of Cognition Using Longitudinal Data with Multiple Samples and Changing Scales of Measurement,” Psychological Methods, 14, 126–149. DOI: 10.1037/a0015857.
- Nosek, B., Spies, J., and Motyl, M. (2012), “Scientific Utopia: II. Restructuring Incentives and Practices to Promote Truth over Publishability,” Perspectives on Psychological Science, 7, 615–631. DOI: 10.1177/1745691612459058.
- Park, J. Y., Joo, S. H., Cornillie, F., van der Maas, H. L., and Van den Noortgate, W. (2019), “An Explanatory Item Response Theory Method for Alleviating the Cold-Start Problem in Adaptive Learning Environments,” Behavior Research Methods, 51, 895–909. DOI: 10.3758/s13428-018-1166-9.
- Peck, R., Gould, R., and Utts, J. (2017), “Mathematics Prerequisites for Success in Introductory Statistics,” Technical Report, Charles A. Dana Center.
- Petty, N. W. (2010). “Creating YouTube Videos That Engage Students and Enhance Learning in Statistics and Excel,” in Data and Context in Statistics Education: Toward an Evidence-Based Society. Proceedings of the Eight International Conference Conference on Teaching Statistics (ICOTS-8), ed. C. Reading, Ljubljana, Slovenia: International Statistical Institute.
- Rasch, G. (1960), Probabilistic Models for Some Intelligence and Attainment Tests, Copenhagen: Danmarks Paedagogiske Institut.
- Rivera, D. E., Pew, M. D., and Collins, L. M. (2007), “Using Engineering Control Principles to Inform the Design of Adaptive Interventions: A Conceptual Introduction,” Drug and Alcohol Dependence, 88, S31–S40. DOI: 10.1016/j.drugalcdep.2006.10.020.
- Rose, T. (2016), The End of Average: How We Succeed in a World that Values Sameness, San Francisco, CA: HarperOne. Available at http://www.harpercollins.com/9780062358363/the-end-of-average
- Schwarz, G. (1978), “Estimating the Dimension of a Model,” The Annals of Statistics, 6, 461–464. DOI: 10.1214/aos/1176344136.
- Sclove, L. S. (1987), “Application of Model-Selection Criteria to Some Problems in Multivariate Analysis,” Psychometrika, 52, 333–343. DOI: 10.1007/BF02294360.
- Shahidian, A., Lashgari, K., and Goodarzi, S. (2011), “Adult Teaching: Methods and Principles,” Nature and Science, 9, 94–97.
- Shiffler, R. E., and Adams, A. J. (1995), Just Enough Algebra for Students of Statistics.,” Pacific Grove, CA Duxbury Press.
- Thompson, N. A., and Weiss, D. J. (2011), “A Framework for the Development of Computerized Adaptive Tests,” Practical Assessment, Research and Evaluation, 16, 1–9. DOI: 10.7275/wqzt-9427.
- Tofghi, D., and Enders, C. K. (2007), “Identifying the Correct Number of Classes in Mixture Models,” in Advances in Latent Variable Mixture Models, eds. G. R. Hancock and K. M. Samulelsen, pp. 317–341, Greenwich, CT: Information Age.
- Wang, Q., Molenaar, P., Harsh, S., Freeman, K., Xie, J., Gold, C., Rovine, M., and Ulbrecht, J. (2014), “Personalized State-Space Modeling of Glucose Dynamics for Type 1 Diabetes Using Continuously Monitored Glucose, Insulin Dose, and Meal Intake: An Extended Kalman Filter Approach,” Journal of Diabetes Science and Technology, 8, 331–345. DOI: 10.1177/1932296814524080.
- Wang, S., Zhang, A., Messer, S., Wiesner, A., and Pearl, D. K. (2021), “Student Developed Shiny Applications for Teaching Statistics,” Journal of Statistics and Data Science Education, 29, 218–227. DOI: 10.1080/26939169.2021.1995545.
- Weiss, D. J. (1982), “Improving Measurement Quality and Efficiency with Adaptive Testing,” Applied Psychological Measurement, 6, 473–492. DOI: 10.1177/014662168200600408.
- Weiss, D. J., and Kingsbury, G. G. (1984), “Application of Computerized Adaptive Testing to Educational Problems,” Journal of Educational Measurement, 21, 361–375. DOI: 10.1111/j.1745-3984.1984.tb01040.x.
- Wickham, H. (2016), ggplot2: Elegant Graphics for Data Analysis, New York: Springer-Verlag. Available at https://ggplot2.tidyverse.org.
- Wickham, H., François, R., Henry, L., and Müller, K. (2022), “Dplyr: A Grammar of Data Manipulation [Computer Software Manual],” available at https://dplyr.tidyverse.org, https://github.com/tidyverse/dplyr.
- Yoes, M. (1995), “An Updated Comparison of Micro-Computer Based Item Parameter Estimation Procedures Used with the 3-Parameter IRT Model,” Technical Report, Saint Paul, MN Assessment Systems Corporation.