
 ?Mathematical formulae have been encoded as MathML and are displayed in this HTML version using MathJax in order to improve their display. Uncheck the box to turn MathJax off. This feature requires Javascript. Click on a formula to zoom.
ABSTRACT
Drying is a complicated phenomenon involving a combination of transport, deformation, and chemical kinetics. It is an energy intensive lengthy process and results in deterioration of food quality. The glass transition temperature (GTT) significantly affects the internal mass transfer mechanism and hence significantly affects the drying kinetics. Moreover, the rheological and transport characteristics of food materials are remarkably impacted by GTT, which has an influence on the energy consumption and quality of food products during drying. Similarly, molecular weight and drying conditions also affect the GTT. This comprehensive review uncovers the fundamental understanding of GTT and demonstrates its crucial relationship with physio-structural and transport properties of food items. It has been demonstrated that a clear understanding of the glass transition temperature may help in determining appropriate drying conditions while ensuring great food quality.
Introduction
The glass transition phenomenon (GTP) is a thermodynamic phase transition from brittle glassy to flexible rubbery[Citation1].[Citation2,Citation3] This second-order phase transition is generally viewed as a continuous phase transition, as contrasted to a first-order transition such as melting. At the glass transition zone, there is no discontinuity in thermodynamic variables like volume, enthalpy, or free energy. However, because of the coefficient of expansion and heat capacity shift by a few degrees in the glass transition zone, chemical reactions, and molecule mobility slowdown while increasing above the glass transition region.[Citation4]
The GTP plays a vital role when food products are under thermal treatment such as drying, frying, or cooking. This controls crucial phenomena, such as case hardening, cell collapse, oxidation reactions, non-enzymatic browning, and microbiological stability.[Citation5] Moreover, the physio-chemical properties of food items, such as Young's modulus, coefficient of thermal expansion, and specific heat capacity, are significantly altered by the GTP. On the other hand, Tg can be influenced by a multitude of factors, which include moisture content, processing conditions, composition, and the presence of plasticizers in food.
Drying is one of the most energy-intensive industrial processes, accounting for almost 15% of the total energy use.[Citation6] Depending on the drying procedure, 1-kg moisture loss from food during drying consumes 14.53 MJ to 90 MJ energy.[Citation7] As a result, research into drying energy efficiency is required for sustainability in the food drying business. The purpose of this study is to investigate the link between glass transition temperature and drying process parameters to increase energy efficiency. This paper summarizes the impacts of glass transition temperature on the thermo-chemical characteristics and heating parameters of biological materials, as well as presenting a critical assessment of the elements that influence Tg.
Section 2 describes the established theory and mathematical model relating to the glass transition temperature. Section 3 briefly discusses various methods for determining the glass transition temperature. Section 4 focuses on how process variables and food qualities impact the glass transition temperature. Finally, sections 5 and 6 examine the potential influence of the glass transition on properties and quality of food materials during drying.
Theory and mathematical modeling of glass transition
To determine the glass transition temperature in materials and to explain the effect of various factors on the glass transition temperature, several mathematical models have been developed. It is worth mentioning that all the mathematical models are empirical, and therefore they cannot be applied universally. However, these models demonstrate the important relationship between different influential parameters and glass transition temperature. Commonly used glass transition temperature mathematical models are discussed below.
The Gordon-Taylor model can be used to determine the glass transition temperature of composite food materials. This takes into consideration the glass transition temperatures of individual components and the mole fraction of the components.[Citation8]
where w=weight fraction concentration in the mixture and k= a parameter that depends on the component’s thermal expansion coefficient when it transitions from a glassy to a rubbery state during the glass transition.
This model can be used to predict the value of Tg in a composite mixture, predict the effect of moisture content on Tg, explain the effect of plasticizer on Tg, and can be applied to a polymer blend. However, it requires a lot of experimental data and is not suitable for a mixture in which any component has a negligible Tg response[Citation9–11]
The Couchman-Karasz model assumes that the entropy of mixing is a continuous function in the glass transition region.[Citation9]
where x= mole fraction concentration and ∆CP = heat capacity.
To predict Tg, this mathematical model takes only a modest amount of experimental data. Only ideal mixing systems with no component variability operate well with this equation. This model explains the influence of plasticizers on Tg, aids in understanding the effect of molecular weight on Tg, and has been used in multi-component systems, such as water, glucose, and sucrose, as well as ternary, quaternary, and higher-order systems[Citation9–12]
The William-Landel-Ferry (WLF) model is useful for viscous and viscoelastic food materials .This model considers viscosity is the main influential factor of molecule motion.[Citation13]
where µ= viscosity; µg= viscosity at Tg; C1 = 17.44 & C2 = 51.6 K are universal constants.
The influence of drying conditions and water content on transformation kinetics and rheological properties is not explained by this model. However, it explains the dependency of viscosity on temperature above Tg, and it applies roughly over the temperature range from Tg to Tg+100 K. It also explains why chemical reactions are slow below Tg[Citation9,Citation10,Citation14,Citation15]
In the context of cooling processes, the Kwish model can give insight into how the cooling rate affects the glass transition temperature of food materials.[Citation16]
where k& q are the fitting parameters that depend on the intermolecular interaction between the components of the polymer mixture and x= mole fraction.
This model is used to examine water solute interaction and explains the effect of hydrogen bonding on the glass transition temperatures of polymers[Citation16,Citation17]
Pinal’s Prediction model considers the effect of entropy on the glass transition temperature of a mixing. The model demonstrated that the Tg is shifted as a result of gaining entropy.[Citation10]
where x= mole fraction; ∆CP = heat capacity difference between the liquid and crystalline form.
∆sm = configurational entropy of mixing.
This model helps to explain how the entropy of mixing affects the Tg of the amorphous mixtures.[Citation9,Citation10]
The Mandelkern, Martin, and Quinn Equation model considers chemical structure.[Citation18,Citation19]
where R is a parameter that considers volume–temperature coefficients of the liquid state of homopolymers.
All the above-mentioned mathematical models for determining the glass transition temperature are empirical models. Prior to applying any of these models to food materials, experimental validation is crucial to ensure the accuracy of the model.
Glass transition temperature measurement techniques
Since the glass transition does not involve latent heat, the second-order phase change is identified by observing changes in a variety of properties, including dielectric properties like the dielectric constant, mechanical properties, such as viscosity, and thermodynamics characteristics like heat capacity, free volume, enthalpy, and thermal expansion coefficient. There are the ways to calculate the glass transition temperature based on observational properties. Individual methods detect glass transition temperature depending on the glass transition’s distinct features in response to varied conditions. Different methods are helpful in measuring the Tg of various materials. As illustrated in , the main methods for evaluating glass transition including thermal, thermo-mechanical, volumetric, and spectroscopic approaches.
Figure 1. Glass transition temperature measurement techniques.
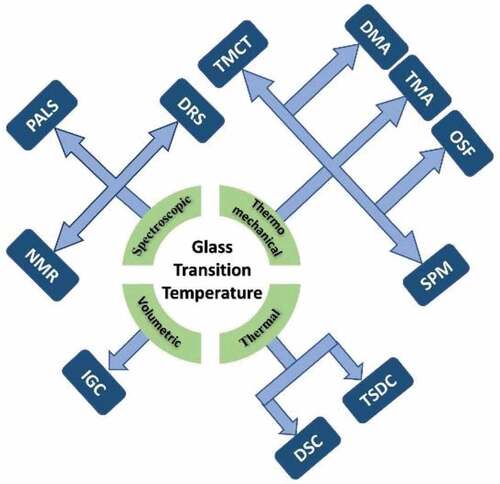
In the thermo-mechanical approach, thermal and mechanical properties of materials are used to determine the value of Tg. Many instruments are used including TMCT, DMA, TMA, OSF, SMP and TMCT to evaluate Tg using the measured thermo-mechanical properties of material. Some devices such as DSC and TSDC use only the thermal characteristics of the material to determine the Tg value of a given material.
Unlike the mentioned approach, the volumetric-based approach quantifies interaction energies of polar and nonpolar molecules within the polymers. This estimation method is sensitive to the properties of the bulk polymer above the glass transition temperature (Tg) and used to determine interactions at polymer surfaces below Tg. Two significant boundaries in IGC are the retention volume and peak width or peak broadening. The starting point of retention volumes and peak broadening is broadly known at above and close to the glass transition temperature (Tg).
Moreover, many spectroscopic methods including NMR, PALS, and DRS are used to determine Tg of different materials. The reader interested in more insight on the determination procedure of Tg by using these techniques can consult numerous other sources available, such as those listed in the references. The different glass transition measuring techniques are summarized in .
Table 1. Comparisons among different measurement techniques of glass transition.
It is clear from that diverse methods are available to determine Tg for different food materials. However, a single method is not applicable to all materials for measuring Tg. Moreover, each method has its specific advantages and disadvantages. For example, dielectric relaxation spectroscopy (DRS) is less frequently used for determining Tg of food materials.
Factors affecting glass transition temperature
The phase change from glassy to rubbery associates the value of Tg of a food material is influenced by several factors including composition, chemical structure, thermo-physical properties, and even drying conditions. Tg values of food materials vary from that of water (−135οC) to those of polysaccharides (approximately 243οC).
Compositions
Composition of food including water, sugar, and fat content can significantly affect glass transition temperature. Depending on which solvents are present in the material, the glass transition temperature is impacted differently. Therefore, Tg of a pure polymer is not the same as the Tg of a composite.[Citation53] It can be said that glass transition temperature of a food material is significantly affected by its composition and accompanying microstructure.[Citation54] The modified Gibbs-DiMarzio law explains how it changes with the chemical composition.
where β is a parameter fitted from the experimental data, <r> is the average coordination number defined as, <r≥r, where r is the maximum number of covalent bonds that an atom can generate. The occurrence of each sort of atom in the glass is represented by Xr and the maximum coordination among all-atom species is Zmax.[Citation55]
Moisture content
In most food materials, there are two forms of water: free and bound water.[Citation56] In the literature, the overall water content is used to connect Tg with moisture content. The influence of moisture content on the glass transition temperature Tg is explained by the Gordon–Taylor equation shown below[Citation8]:
where are the weight fraction of solids and water, respectively.
are the glass transition temperature of bone-dry solid and water (−135οC), respectively.[Citation57] Whereas k is the fitting parameter.
The glass transition temperature (Tg) rises as the moisture content decreases, as shown in .[Citation59,Citation60] Many researchers have tried to figure out why this happens, and their findings can be summarized as follows.
Figure 2. Effect of moisture content on glass transition temperature[Citation58].
![Figure 2. Effect of moisture content on glass transition temperature[Citation58].](/cms/asset/cd588b42-c0c3-46af-894a-f03d0cb91ca7/lfri_a_2204131_f0002_oc.jpg)
Plasticizing effect of water: Water functions as a plasticizer when moisture content increases, it lowers the glass transition temperature.[Citation61] When moisture level rises, the water functions as a plasticizer.[Citation62,Citation63] When water is used as a plasticizer, the inter-and intra-macromolecular forces are reduced, lowering Tg.[Citation11,Citation58,Citation64]
Weakening intermolecular hydrogen bonds: Due to the attractive force of the water molecule bond, water weakens intermolecular hydrogen bonds, allowing chain mobility and lowering Tg.[Citation58]
Increase in mobility: Moisture occupies the free volume within the polymer chain, causing it to become more mobile, and eventually lowering the Tg.[Citation65]
Decrease in viscosity: The viscosity increases when the moisture content decreases as migration of moisture causes increase of solute density.
In general, the glass transition temperature of any food material increases with the decrease of moisture content. Therefore, the amount of water is vital in thermo-physical aspects of food materials during drying.
Cellulose, hemicellulose, lignin, and pectin
Cellulose, hemicellulose, lignin, and pectin are the fundamental building blocks of plant cell wall. Therefore, their proportion in food significantly affects the overall Tg of food materials as the Tg of those individual components are different than each other. shows the glass transition temperature of building blocks of plant cells.
Table 2. Glass transition temperature of fundamental building blocks of plant cell wall.
It is hypothesized that the effective glass transition temperature of plant-based food materials can be estimated from the proportion of the basic components including water, cellulose, hemicellulose, lignin, and pectin. Due to the plasticizing nature of food material, individual building blocks can affect the overall Tg. Hemicellulose and pectin can affect the value of Tg as these have plasticizing properties.[Citation65–69]
Plasticizer
The presence of plasticizers improves the softness, flexibility, and extensibility of food materials.[Citation4] The impact of plasticizer is explained by two mechanisms: the plasticizer molecule reduces the attractive force between the molecules of the substance and increases the space between them.[Citation9,Citation70]
The glass transition temperature is inversely related to plasticization, as shown in .[Citation72]
Figure 3. Effect of plasticizer on the glass transition temperature[Citation71].
![Figure 3. Effect of plasticizer on the glass transition temperature[Citation71].](/cms/asset/96a4327f-3681-45fc-9071-30e07e344d72/lfri_a_2204131_f0003_b.gif)
When a plasticizer is applied, it gets stuck between the polymer chains and keeps them apart. As a result, plasticizer lowers inter- and intra-macromolecular interactions, allowing segmental mobility and lowering internal friction in polymers.[Citation11,Citation64] Besides that, plasticizers reduce mechanical properties, increasing workability, flexibility, and distensibility.[Citation64] As a result, low-temperature polymer-chain movement is feasible, resulting in a drop in a polymer’s Tg.[Citation73] Water is the most effective plasticizer for food and biological materials out of all of the plasticizers.[Citation64,Citation74]
Molecular weight
The glass transition temperature of a polymer is directly related to its molecular weight. The relationship between molecular weight (MW) and Tg may be simply understood using the Fix-Flory equation, which is,
where Tg (∞) is the glass transition temperature for an ideal chain of infinity length and B is a polymer-specific constant. The glass transition temperature rises with the increase of molecular weight (MW), as shown by EquationEquation (9)(9)
(9) .[Citation57,Citation75,Citation76] Tg values increased with increasing molecular weight as the increased size of molecules causes more points of engagement with the adjacent molecules as demonstrated in .[Citation47,Citation76,Citation77]
Table 3. Effect of Molecular Weight on Tg[Citation25].
The specific volume reduces as the molecular weight increases.[Citation25] According to the free volume theory,[Citation78–80] this decrease in specific volume reduces chain mobility, causing Tg to rise.[Citation81] Plasticizer reduces with increasing molecular weight, and the decreased effect of plasticizer raises Tg.[Citation9]
Physical properties
Physical properties of food significantly affect the value of Tg. The effects of different physical properties of Tg have been discussed in the following section.[Citation81]
Porosity
Porosity refers to the presence of free spaces within a total volume of food samples. Porous materials have a porosity greater than 0.4, while nonporous materials have a porosity of less than 0.25.[Citation82] Porosity affects the physical, mechanical, and textural properties of food.[Citation82,Citation83] The glass transition temperature of food is affected by porosity, and it lowers as porosity increases.[Citation84,Citation85] Higher porosity causes less restriction of solid food matrix or polymer chains. According to samples with higher porosity had a wider Tg range than samples with lower porosity[Citation83]..
Figure 4. (A) Correlation between porosity and Tg in dehydrated plant-base sample,[Citation84] (b) contribution of porosity on the change of Tg.
![Figure 4. (A) Correlation between porosity and Tg in dehydrated plant-base sample,[Citation84] (b) contribution of porosity on the change of Tg.](/cms/asset/87febaa6-6b69-43d1-9d78-489d34dadac6/lfri_a_2204131_f0004_oc.jpg)
When porosity increases, free space also increases, which eventually decreases Tg. Porosity is inversely related to thermal conductivity of multiphase materials such as plant-based food materials, higher porosity levels result in lower Tg.[Citation83]
Flexibility
Flexibility is defined as the ability to twist without breaking.[Citation83,Citation86] The glass transition temperature is influenced by the flexibility of the polymer’s main chain.[Citation87] Flexibility of the material allows the polymer chain to move more easily. As a result, the flexibility is inversely proportional to the glass transition temperature. On the other hand, the Tg of polymers rises as the chain stiffness rises.[Citation88] The glass transition temperature (Tg) increases as the chain stiffness increases.[Citation89]
Free volume at microlevel
In the context of amorphous polymers at microlevel, the term “free volume” refers to the empty space in the polymer chain, which is not occupied by atoms or molecules. Free volume is the amount of internal space available within a polymer matrix.[Citation90] The glass transition temperature (Tg) rises as the free volume decreases,[Citation75] as shown in (b). More free volume is associated with a short polymer chain. As a result, the shorter chain’s glass transition temperature is lower than the longer chains.[Citation23] Free volume diminishes as pressure rises, resulting in a high glass transition temperature (Tg).[Citation73] When the polymer is heated above Tg, separated polymer chains create more free volume.[Citation91]
A cross-link is a bond that connects two polymer chains. Because of the polymer’s limited chain mobility, the glass transition temperature is directly proportional to the degree of cross-linking. Increased cross-linking reduces polymer-chain mobility and free volume, increasing Tg.[Citation73] Furthermore, chain length and branching have a big impact on the glass transition temperature. When polymers have more branching and chain ends, they have more free volume, which lowers Tg. Glass transition temperature rises in larger groupings where branches hinder rotations. The glass transition temperature of polyethylene decreased as the degree of branching increased.[Citation92] As a result, branching lowers the temperature of the glass transition.[Citation93]
Drying conditions
The glass transition temperature (Tg) is one of the most important techniques for quantifying water mobility in biological materials and managing product shelf life. Temperature and moisture content influence the mechanical and other barrier qualities of biological materials.[Citation94] A rubbery state exists in dried biological products when they are above the glass transition temperature, which accelerates the molecular mobility of the product, resulting in a faster rate of physiochemical change in the dried product.[Citation39] Drying conditions including drying temperature and heat transfer rate affect changes in the morphology and water distribution, which eventually affect the glass transition temperature. Therefore, a sample with the same moisture content but at different drying temperatures and heat transfer rates can have different glass transition temperatures.
Heating rate
The glass transition temperature of a dried product is affected by its heating rate, and it rises as the heating rates rise.[Citation95,Citation96] When calculating the glass transition temperature of processed or stored biological materials and pharmaceuticals, the effect of heating and cooling rate is critical.[Citation25,Citation97] This factor is important in the case of volumetric heating such as microwave heating, which causes a nonuniform temperature distribution. The following equation shows a high degree of dependency of the glass transition temperature (Tg) on heating under specified conditions.
Where Tr, is a temperature in the middle of the transition range, * is the activation enthalpy for the relaxation time controlling the structural enthalpy or volume relaxation, and R is the ideal gas constant.[Citation98]
illustrates how the heating rates affect the glass transition temperature. The molecular motions involved in structural relaxation are generally thought to be rough, similar to those involved in viscous flow.[Citation98] Another study discovered that the heating and cooling speeds of dried products affect the beginning and end temperatures of the glass transition, and enthalpy[Citation99]
Figure 5. Effect of drying temperature and heat transfer rate on Tg during drying.
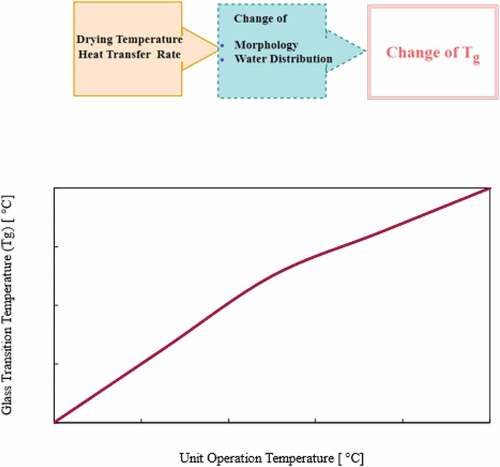
Drying temperature
Unit operations in food processing include freezing, dehydration, flaking, sheeting, baking, and drying process.[Citation100–102] The conditions need to be maintained carefully during drying. demonstrated how the glass transition temperature (Tg) changes due to drying temperature. This is because the higher the unit’s operating temperature,[Citation103] the less time it takes to reach a higher glass transition temperature (Tg).[Citation104] Amorphous supercooled liquid with exceptionally high viscosity is defined as glass in this[Citation105] context (between 1010 and 1013 Pa.s).[Citation75,Citation106] In certain circumstances, the drying temperature is higher than the glass transition temperature (Tg), and raising the temperature or moisture content causes the system to shift from a glassy to a rubbery state.[Citation107]
From the above discussion, a combination of factors affects the value of Tg. Eventually, there is not always a clear correlation between a given characteristic and the glass transition temperature (TG), as other factors usually have an impact.
Effect of Tg on food properties
Drying kinetics is affected by both drying conditions and food properties. Transport and physical properties and morphology are the main properties that significantly influence the drying kinetics of food materials. It is well established that these properties evolve spontaneously during heat and mass transfer. GTT plays an important role in determining the nature of the evolution of these properties during drying, and this is an area that requires extensive research. In the following section, we present evidence of the effects of Tg on different properties of food materials, which eventually affect drying kinetics.
Mechanical properties and relaxation times
Mechanical properties of food materials are important in both energy consumption in food drying and quality aspects of food. Young’s modulus and stress relaxation are the most important mechanical properties of food materials. The role of Tg on these mechanical properties is described below.
Young’s modulus
Glass transition temperature rises with stiffness in polymers and plant-based biomaterials.[Citation88] The two main mechanisms that cause a material’s Young’s modulus to increase are crystallization and the transformation to the glassy phase.[Citation108] The material’s flexibility affects the reduction in Young’s modulus.[Citation109] When a food substance transitions from brittle to rubbery at the glass transition, its mechanical properties also change.[Citation110] When the material is heated above the glass transition temperature, however, the amplitude of the effect may decrease by four to five orders. Glass transition occurs around −20°C in a starch–glucose water film, resulting in a modulus reduction of more than 103 Nm−2.[Citation111]
Stress relaxation
Relaxation times are the rates at which mechanical properties change. Creep and stress relaxation are time-dependent mechanical qualities. The material’s viscoelastic or viscoplastic behavior manifests itself in a variety of ways, including creep under constant load, time-dependent creep rupture, stress relaxation under constant deformation, and time-dependent deformation recovery after load removal.[Citation77,Citation112] Under applied stress, creep is a time-dependent extension. Stress relaxation is the complementary effect under continual expansion. The duration and rate of loading have a significant impact on polymeric material deformation, which becomes increasingly important as the temperature approaches the glass transition point.[Citation77,Citation113,Citation114]
Morphology change
Food morphology has an impact on food production and transformation. All food products have three morphological characteristics.[Citation115] The first is the geometric, topological, and symmetry levels of describable configuration. The glass transition temperature (Tg) affects food texture as well as dry food storage stability.[Citation116] The Tg of amorphous food systems regulates changes in food structure and texture. Amorphous structures are stable below Tg in the solid glassy state.[Citation117] The solid-state is changed into a supercooled liquid state around and above Tg with time-dependent flow.[Citation116,Citation118] Dehydrated, glassy meals, for example, have a firm, brittle consistency, but at Tg, the materials may flow or become mushy.[Citation116] Understanding the glass transition phenomenon can reveal the causes of the cohesiveness of many essential powders, and it has an impact on new product development attributes such as wettability and solubility.[Citation119]
Shrinkage occurs when water migrates from the intercellular space of the food material to the surrounding environment during drying, reducing the volume of the material.[Citation120] By influencing the mechanical and textural aspects of food, shrinkage has a significant impact on the quality of the dried product.[Citation121]
Molecular diffusivity decreases dramatically below the glass transition temperature due to high viscosity and as a result, water and other organic components cannot travel freely,[Citation122,Citation123] resulting in a stiff product.[Citation124,Citation125] The mobility rate of the solid matrix is directly related to the temperature difference between the product and its glass transition temperature for a certain moisture content.[Citation126] Drying at a temperature above the glass transition temperature keeps the product rubbery, allowing for a larger shrinkage rate due to the mobile solid matrix.
Transport properties
Food solids are plasticized by water and other low molecular weight hydrophilic solvent components. Water is a mobility enhancer because its low molecular weight results in a significant improvement in mobility, lowering local viscosity and increasing free volume. The glass transition temperature is reduced as a result of plasticization, and this is related to the moisture concentration.[Citation39]
Diffusivity
In the drying phenomena, moisture diffusion is crucial.[Citation127] Diffusivity has an impact on food reactions, flavor loss, and a variety of other alterations. The dependence of diffusivity in amorphous materials can be demonstrated in two ways, the first being the use of the Arrhenius equation.
Where ED is the activation energy for diffusion (Jkg−1K−1), D is the diffusivity at temperature T (m2s−1), D0 is the pre-exponential factor, R is the gas constant and T is the absolute temperature (K).
The activation energy differential above and below the glass transition temperature is determined by diffusant size and amorphous matrix packing density.[Citation128] The diffusion coefficient of the polymer chain decreased when Tg was raised as shown in .[Citation129] This trend is generally observed for homogeneous medium, which relates to Fikcian diffusion.
Figure 6. Different zone of diffusion, function of the temperature (K) and penetrant concentration (kg/m3).
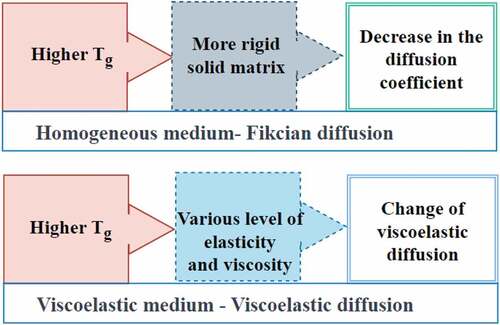
On the other hand, the effect of glass transition temperature on diffusion is not straightforward for viscoelastic materials, such as plant-based food materials. Besides Tg, diffusivity depends on solid matrix composition, morphology, and water distribution within the food sample.[Citation130]
Permeability
The capacity of a material to enable vapor to pass through it is measured by its vapor permeability. The glass transition temperature (Tg) and the transport properties of dense membranes have a decent relationship.[Citation131] The permeability of gas and vapor is much higher in the rubbery state than in the glassy state.[Citation132] The double mode sorption and mobility model predicts a reduction in permeability with increasing pressure in glassy polymers, as demonstrated by CO2 in polycarbonate.[Citation133] Permeability decreases when polymers become more crystalline below Tg. Permeability increases as polymers become more amorphous above Tg. Permeability is calculated by multiplying the diffusion and solubility coefficients.[Citation134]
From the above discussion, it is demonstrated that glass transition temperature has significant effect on different aspects of food properties and qualities. Contribution of glass transition temperature in reaction kinetics, transport phenomena, and deformation may be vital as Tg significantly affects thermo-physical properties of food materials. It can be concluded that Tg should be taken into consideration during the selection of drying conditions.
Effect of Tg on food quality
There are many factors that directly affect both food quality and energy consumption of food drying. Tg of the food materials directly and indirectly contributes to changing of food quality and energy consumption in food drying. In the following sections, a detailed explanation of the influence of Tg on energy consumption and food quality is presented. As discussed in the earlier section, Tg significantly affects physio-chemical, mechanical, and transport properties; eventually, Tg has both direct and indirect influences on drying energy consumption and quality of the food.
The quality of food is affected when it is dried at a temperature greater than its glass transition temperature (Tg).[Citation135] Glass transitions can cause physical and chemical changes in food during processing and storage.[Citation136] After drying, many dried foods become glassy, and this physical state has an impact on chemical alterations. Water content has a considerable effect on raising the reaction rate, which is equivalent to the effect of increasing temperature.[Citation31]
Sensory properties
People base their food purchases on a variety of sensory factors.[Citation137] The five major sensory qualities of food are appearance, texture, fragrance, taste, and irritation.[Citation138] For example, crispiness is an essential quality for food with low-moisture quantity such as cereal. Crispiness can be affected by both moisture content and Tg. Therefore, storage at a temperature lower than Tg can significantly affect the crispness.
Colour
The colour of the dried food product is frequently used by the consumer to choose or reject it. As a result, colour is a significant quality characteristic of dried foods. Chemical and biological interactions modify the colour of food throughout the drying process and non-enzymatic browning degrades food quality.
Tg affects the physical state of the food matrix and eventually influences the perception of food color.
shows the impact of Tg on browning reaction. From this figure, it is clear that below the glass transition temperature, slow browning occurs, leading light color of the dried food.[Citation14]
Figure 7. Relation between browning (absorbance at 420 nm) reaction and T-Tg(K)[Citation14] .
![Figure 7. Relation between browning (absorbance at 420 nm) reaction and T-Tg(K)[Citation14] .](/cms/asset/e3248d99-bd86-4e92-b9af-85039c5b6654/lfri_a_2204131_f0007_oc.jpg)
Deformation
Deformation takes place during drying as food undergoes cell collapse and tissue shrinkage. There is a subtle distinction between shrinkage and collapse; shrinkage refers to a reversible reduction in the volume of the food sample, whereas collapse signifies an irreversible breakdown of the structure at either the cellular or tissue level. Due to transport processes, structural changes in the cellular level occur during the drying period.[Citation139] The evolution of porosity and shrinkage during drying has a considerable impact on the transport process as well as several quality aspects. As a result, accurate structural deformation prediction is required for proper characterization of transport processes and quality aspects. Numerous empirical and theoretical approaches to deformation during drying are available in the literature. Some literature shows significant effect of Tg on the trend of deformation. Recently, Joardder and Karim[Citation140] developed a deformation prediction model using Tg based shrinkage velocity equation as mentioned below:
Where vs is the shrinkage velocity in ms−1 and l is the half thickness of the sample. Doff=Effective gas diffusivity. T and T0 are instantaneous and initial temperature of the sample (K), respectively. Tg , Tg0 are instantaneous and initial glass transition temperature of the sample (K); = density of water and solid materials, respectively.
Texture
Food texture is one type of feature that can be detected with the touch of the mouth or hand. The crispiness is a prominent textural attribute for dried food products including crackers, popcorn, potato chips, and breakfast cereals.[Citation141,Citation142] Tg can affect the texture of dried food significantly. Crispness is linked to a brittle, low-density cellular structure that produces a high-pitched noise when broken. The decline in rigidity modulus associated with the glass rubber transition in polymers was blamed for the loss of brittleness as shown in .
Figure 8. Glass transition and crispness as a function of water content[Citation142].
![Figure 8. Glass transition and crispness as a function of water content[Citation142].](/cms/asset/ab8ca538-981b-47eb-915f-66a1951040d0/lfri_a_2204131_f0008_oc.jpg)
Some food items, such as potato chips, with higher glass transition temperature offers crispier texture at room temperature. On the other hand, foods having lower Tg means that it will transition to rubbery state from glassy at lower temperature.
Flowability
Flowability is an important property of fruits and vegetable powder. Sticky and its consequential caking effect is observed in the powder at low flowability. Tg of the powder materials is the key factor that determines the degree of flowability of the powder material. If the Tg of the powder material is less than the ambient temperature, the caking effect takes place.[Citation143] Therefore, storing powder of fruits and vegetables below the Tg is recommended to prevent the caking effect.
Food stability
During food processing and storage, several variables, including the amount of water, the composition of the food, the preservation method used, the P-H level of the food a, and processing variables like temperature and pressure, can strongly influence microbial death, growth dynamics, and deteriorate physical, chemical, and biological changes. As a result, it might be challenging to assess the stability of food ingredients. Water activity is a concept for determining the stability of food, it was put forth in the 1950s. The glass transition concept, however, was put forth in the 1980s as a result of the water activity theory’s shortcomings.[Citation143]
Since diffusion-controlled reactions are relatively slow at or below Tg, food is most stable at or below the glass transition point. Diffusion-controlled reaction kinetics significantly rise at a temperature above in Tg. The stability of food will eventually be affected by slight changes in storage temperature near the Tg, determining whether a product will be stable for tens or hundreds of days. Food with a higher Tg is more stable as they are less susceptible to moisture absorption and other degradation. Furthermore, glassy state is more stable in response to reactive species. For instance, glucose crystals can remain stable for months in dry air at room temperature.[Citation5]
Conclusion
Understanding the mechanics involved in drying necessitates the knowledge of some critical parameters including the glass transition temperature and moisture content. This review reveals how Tg significantly impacts the transport and physio-structural properties of food products. Modifications to transport and other features then influence drying kinetics. The understanding of Tg can be used to choose the ideal drying conditions to minimize energy usage and quality changes during drying. On the other hand, the composition, water content, and process conditions are all factors that affect Tg. Furthermore, it is crucial to have a thorough understanding of the relationships between Tg and changes in food properties. Taking all of these into consideration, knowledge of Tg fresh and dried food can offer important insight for designing a sustainable drying system and prediction of dried food qualities. Further investigation of these connections will be beneficial in identifying the ideal drying conditions that ensure high food quality while using the least amount of energy.[Citation71,Citation144]
Disclosure statement
The authors do not have any conflicts of interest.
Correction Statement
This article has been corrected with minor changes. These changes do not impact the academic content of the article.
References
- Červenka, L.; Stępień, A.; Frühbauerová, M.; Velichová, H.; Witczak, M. Thermodynamic Properties and Glass Transition Temperature of Roasted and Unroasted Carob (Ceratonia Siliqua L.) Powder. Food Chem. 2019, 300, 125208. DOI: 10.1016/j.foodchem.2019.125208.
- Mahato, S.; Zhu, Z.; Sun, D. W. Glass Transitions as Affected by Food Compositions and by Conventional and Novel Freezing Technologies: A Review. Trends Food Sci. Technol. 2019, 94, 1–11. Elsevier Ltd. DOI: 10.1016/j.tifs.2019.09.010.
- Nastasović, A. B.; Onjia, A. E. Determination of Glass Temperature of Polymers by Inverse Gas Chromatography. J. Chromatography. A. 2008, 1195(1–2), 1–15. DOI: 10.1016/j.chroma.2008.05.009.
- Rahman, M. S. (Ed.). (2009). Food Properties Handbook, 2nd ed.; CRC Press. DOI: 10.1201/9781420003093.
- Noel, T. R.; Ring, S. G.; Whittam, M. A. Glass Transitions in Low-Moisture Foods. Trends Food Sci. Technol. 1990, 1(C), 62–67. DOI: 10.1016/0924-2244(90)90048-4.
- Masud, M. H.; Karim, A.; Ananno, A. A.; Ahmed, A. Sustainable Food Drying Techniques in Developing Countries: Prospects and Challenges; Springer International Publishing, 2020
- Joardder, M. U.; Mourshed, M.; Hasan Masud, M. State of Bound Water: Measurement and Significance in Food Processing; Springer International Publishing, 2019
- Gordon, M.; Taylor, J. S. Ideal Copolymers and the Second-Order Transitions of Synthetic Rubbers. I. Noncrystalline Copolymers. J. Appl. Chem. 1952, 26(2), 493–500. DOI: 10.1002/jctb.5010020901.
- Balasubramanian, S.; Devi, A.; Singh, K. K.; Bosco, S. J. D.; Mohite, A. M. Application of Glass Transition in Food Processing. Crit. Rev. Food Sci. Nutr. 2016, 56(6), 919–936. DOI: 10.1080/10408398.2012.734343.
- Pinal, R. Entropy of Mixing and the Glass Transition of Amorphous Mixtures. Entropy. 2008, 10(3), 207–223. DOI: 10.3390/entropy-e10030207.
- Matveev, Y. I.; Grinberg, V. Y.; Tolstoguzov, V. B. The Plasticizing Effect of Water on Proteins, Polysaccharides and Their Mixtures. Glassy State of Biopolymers, Food and Seeds. Food Hydrocoll. 2000, 14(5), 425–437. DOI: 10.1016/S0268-005X(00)00020-5.
- Couchman, P. R. The Effect of Molecular Weight on Glass-Transition Temperatures (Compositional Variation of Glass-Transition Temperatures 3). J. Appl. Phys. 1979, 50(10), 6043–6046. DOI: 10.1063/1.325792.
- Williams, M. L.; Landel, R. F.; Ferry, J. D. The Temperature Dependence of Relaxation Mechanisms in Amorphous Polymers and Other Glass-Forming Liquids. Temp. Depend. Relax. Mech. 1955, 77(14), 3701–3707. DOI: 10.1016/j.jnoncrysol.2017.12.029.
- Karmas, R.; Buera, M. P.; Karel, M. Effect of Glass Transition on Rates of Nonenzymic Browning in Food Systems. Effect of Glass Transition on Rates of Nonenzymic Browning in Food Systems. 1992, 40(5), 873–879. Woodhead Publishing Ltd. DOI: 10.1021/jf00017a035.
- Peleg, M. On the Use of the WLF Model in Polymers and Foods. Crit. Rev. Food Sci. Nutr. 1992, 32(1), 59–66. DOI: 10.1080/10408399209527580.
- Kwei, T. K. The Effect of Hydrogen Bonding on the Glass Transition Temperatures of Polymer Mixtures Introduction. J. Polym. Sci. Lett. Ed. 1984, 22(1), 307–313. DOI: 10.1002/pol.1984.130220603.
- Lin, A. A.; Kwei, T. K.; Reiser, A. On the Physical Meaning of the Kwei Equation for the Glass Transition Temperature of Polymer Blends. Macromolecules. 1989, 22(10), 4112–4119. DOI: 10.1021/ma00200a052.
- Mandelkern, L.; Martin, G. M.; Quinn, F. A. Glassy State Transitions of Poly-(Chlorotrifluoroethylene), Poly-(Vinylidene Fluoride), and Their Copolymers. J. Res. Natl. Bur. Stand. 1957, 58(3), 137. DOI: 10.6028/jres.058.019.
- Shen, M. C.; Eisenberg, A. Glass Transitions in Polymers. Prog. Solid State Chem. 1967, 3(C), 407–481. DOI: 10.1016/0079-6786(67)90039-8.
- Boonyai, P.; Howes, T.; Bhandari, B. Instrumentation and Testing of a Thermal Mechanical Compression Test for Glass-Rubber Transition Analysis of Food Powders. J. Food Eng. 2007, 78(4), 1333–1342. DOI: 10.1016/j.jfoodeng.2006.01.005.
- Rahman, M. S.; Al-Marhubi, I. M.; Al-Mahrouqi, A. Measurement of Glass Transition Temperature by Mechanical (DMTA), Thermal (DSC and MDSC), Water Diffusion and Density Methods: A Comparison Study. Chem. Phys. Lett. 2007, 440(4–6), 372–377. DOI: 10.1016/j.cplett.2007.04.067.
- Backfolk, K.; Holmes, R.; Ihalainen, P.; Sirviö, P.; Triantafillopoulos, N.; Peltonen, J. Determination of the Glass Transition Temperature of Latex Films: Comparison of Various Methods. Polym. Test. 2007, 26(8), 1031–1040. DOI: 10.1016/j.polymertesting.2007.07.007.
- Meares, P. The Second-Order Transition of Polyvinyl Acetate. Trans. Faraday Soc. 1957, 53(i), 31–40. DOI: 10.1039/tf9575300031.
- Gugenberger, F.; Heid, R.; Meingast, C.; Adelmann, P.; Braun, M.; Wühl, H.; Haluska, M.; Kuzmany, H. Glass Transition in Single-Crystal C60 Studied by High-Resolution Dilatometry. Phys. Rev. Lett. 1992, 69(26), 3774–3777. DOI: 10.1103/PhysRevLett.69.3774.
- Abiad, M. G.; Carvajal, M. T.; Campanella, O. H. A Review on Methods and Theories to Describe the Glass Transition Phenomenon: Applications in Food and Pharmaceutical Products. Food Eng. Rev. 2009, 1(2), 105–132. DOI: 10.1007/s12393-009-9009-1.
- Meincken, M.; Balk, L. J.; Sanderson, R. D. Improved Sensitivity in the Thermal Investigation of Polymeric Nanophases by Measuring the Resonance Frequency Shift Using an Atomic Force Microscope. Macromol. Mater. Eng. 2001, 286(7), 412–420. DOI: 10.1002/1439-2054(20010701)286:7<412:AID-MAME412>3.0.CO;2-V.
- Yu, Z.; Yahsi, U.; McGervey, J. D.; Jamieson, A. M.; Simha, R. Molecular Weight‐dependence of Free Volume in Polystyrene Studied by Positron Annihilation Measurements. J. Polym. Sci. Part B: Polym. Phys. 1994, 32(16), 2637–2644. DOI: 10.1002/polb.1994.090321609.
- Liu, J.; Deng, Q.; Jean, Y. C. Free-Volume Distributions of Polystyrene Probed by Positron Annihilation: Comparison with Free-Volume Theories. Macromolecules. 1993, 26(26), 7149–7155. DOI: 10.1021/ma00078a006.
- Ruan, R.; Long, Z.; Chen, P.; Huang, V.; Almaer, S.; Taub, I. Pulse NMR Study of Glass Transition in Maltodextrin. J. Food Sci. 1999, 64(1), 6–9. DOI: 10.1111/j.1365-2621.1999.tb09850.x.
- Dammert, R. M.; Maunu, S. L.; Maurer, F. H.; Neelov, I. M.; Niemelä, S.; Sundholm, F.; Wästlund, C. Free Volume and Tacticity in Polystyrenes. Macromolecules. 1999, 32(6), 1930–1938.
- Kalichevsky, M. T.; Jaroszkiewicz, E. M.; Ablett, S.; Blanshard, J. M. V.; Lillford, P. J. The Glass Transition of Amylopectin Measured by DSC, DMTA and NMR. Carbohydr. Polym. 1992, 18(2), 77–88. DOI: 10.1016/0144-8617(92)90129-E.
- Ruan, R. R.; Long, Z.; Song, A.; Chen, P. L. Determination of the Glass Transition Temperature of Food Polymers Using Low Field NMR. LWT - Food Sci. Technol. 1998, 31(6), 516–521. DOI: 10.1006/fstl.1998.0409.
- Schaefer, D.; Spiess, H. W. Two-Dimensional Exchange Nuclear Magnetic Resonance of Powder Samples. IV. Distribution of Correlation Times and Line Shapes in the Intermediate Dynamic Range. J. Chem. Phys. 1992, 97(11), 7944–7954. DOI: 10.1063/1.463469.
- Duddu, S. P.; Dal Monte, P. R. Effect of Glass Transition Temperature on the Stability of Lyophilized Formulations Containing a Chimeric Therapeutic Monoclonal Antibody. Pharm. Res. 1997, 14(5), 591–595. DOI: 10.1023/A:1012144810067.
- Alie, J.; Lacabanne, C.; Menegotto, J.; Cardon, P.; Duplaa, H.; Caron, A.; Bauer, M. Dielectric Study of the Molecular Mobility and the Isothermal Crystallization Kinetics of an Amorphous Pharmaceutical Drug Substance. J. Pharm. Sci. 2004, 93(1), 218–233. DOI: 10.1002/jps.10520.
- Faivre, A.; Niquet, G.; Maglione, M.; Fornazero, J.; Jal, J. F.; David, L. Dynamics of Sorbitol and Maltitol Over a Wide Time-Temperature Range. Eur. Phys. J. B. 1999, 10(2), 277–286. DOI: 10.1007/s100510050856.
- Pratt, G. J.; Smith, M. J. A. Dielectric Relaxation Spectroscopy of Poly(ethylene Terephthalate). Polym. Int. 2002, 51(1), 21–26. DOI: 10.1002/pi.785.
- Noel, T. R.; Parker, R.; Ring, S. G. Effect of Molecular Structure and Water Content on the Dielectric Relaxation Behaviour of Amorphous Low Molecular Weight Carbohydrates Above and Below Their Glass Transition. Carbohydr. Res. 2000, 329(4), 839–845. DOI: 10.1016/S0008-6215(00)00227-5.
- Venir, E.; Maltini, E. Relevance of Physical Properties in the Stability of Plant-Based Food Products. Indian J. Exp. Biol. 2013, 51(11), 894–904.
- Folmer, J. C. W.; Franzen, S. Study of Polymer Glasses by Modulated Differential Scanning Calorimetry in the Undergraduate Physical Chemistry Laboratory. J. Chem. Educ. 2003, 80(7), 813–818. DOI: 10.1021/ed080p813.
- Hill, V. L.; Craig, D. Q. M.; Feely, L. C. Characterisation of Spray-Dried Lactose Using Modulated Differential Scanning Calorimetry. Int. J. Pharm. 1998, 161(1), 95–107. DOI: 10.1016/S0378-5173(97)00334-7.
- McPhillips, H.; Craig, D. Q. M.; Royall, P. G.; Hill, V. L. Characterisation of the Glass Transition of HPMC Using Modulated Temperature Differential Scanning Calorimetry. Int. J. Pharm. 1999, 180(1), 83–90. DOI: 10.1016/S0378-5173(98)00407-4.
- Okazaki, I.; Wunderlich, B. Modulated Differential Scanning Calorimetry in the Glass Transition Region. V. Activation Energies and Relaxation Times of Poly(ethylene Terephthalate)s. J. Polym. Sci. Part B: Polym. Phys. 1996, 34(17), 2941–2952. DOI: 10.1002/(SICI)1099-0488(199612)34:17<2941:AID-POLB7>3.0.CO;2-T.
- Song, M.; Hammiche, A.; Pollock, H. M.; Hourston, D. J.; Reading, M. Modulated Differential Scanning Calorimetry: 4. Miscibility and Glass Transition Behaviour in Poly(methyl Methacrylate) and Poly(epichlorohydrin) Blends. Polymer (Guildf.). 1996, 37(25), 5661–5665. DOI: 10.1016/S0032-3861(96)00430-2.
- Shmeis, R. A.; Wang, Z.; Krill, S. L. A Mechanistic Investigation of an Amorphous Pharmaceutical and Its Solid Dispersions, Part I: A Comparative Analysis by Thermally Stimulated Depolarization Current and Differential Scanning Calorimetry. Pharm. Res. 2004, 21(11), 2025–2030. DOI: 10.1023/B:PHAM.0000048193.94922.09.
- Diogo, H. P.; Moura Ramos, J. J. Slow Molecular Mobility in the Crystalline and Amorphous Solid States of Glucose as Studied by Thermally Stimulated Depolarization Currents (TSDC). Carbohydr. Res. 2008, 343(16), 2797–2803. DOI: 10.1016/j.carres.2008.07.002.
- D’Souza, N. A. Thermally Stimulated Depolarization Current. Int. J. Polym. Mater. 2000, 45(3–4), 299–306. DOI: 10.1080/00914030008035047.
- Topić, M.; Moguš-Milanković, A.; Katović, Z. The Study of Glass Transition in Epoxy Resin Using Thermally Stimulated Depolarization Current Measurements. Polymer (Guildf.). 1991, 32(16), 2892–2897. DOI: 10.1016/0032-3861(91)90183-J.
- Ambarkhane, A. V.; Pincott, K.; Buckton, G. The Use of Inverse Gas Chromatography and Gravimetric Vapour Sorption to Study Transitions in Amorphous Lactose. Int. J. Pharm. 2005, 294(1–2), 129–135. DOI: 10.1016/j.ijpharm.2005.01.034.
- Newell, H. E.; Buckton, G.; Butler, D. A.; Thielmann, F.; Williams, D. R. The Use of Inverse Phase Gas Chromatography to Study the Change of Surface Energy of Amorphous Lactose as a Function of Relative Humidity and the Processes of Collapse and Crystallisation. Int. J. Pharm. 2001, 217(1–2), 45–56. DOI: 10.1016/S0378-5173(01)00589-0.
- Glass, A. S.; Larsen, J. W. Inverse Gas Chromatography of Glassy Polymer Surfaces. Macromolecules. 1993, 26(24), 6354–6358. DOI: 10.1021/ma00076a009.
- Mukhopadhyay, P.; Schreiber, H. P. Inverse Gas Chromatography for Polymer Surface Characterization Above and Below Tg. Macromolecules. 1993, 26(24), 6391–6396. DOI: 10.1021/ma00076a014.
- Mahieux, C. A. Environmental Degradation of Industrial Composites; Elsevier, 2005
- Joardder, M.; Masud, M.; Karim, A. Relationship Between Intermittency of Drying, Microstructural Changes, and Food Quality. In Intermittent and Nonstationary Drying Technologies: Principles and Applications (Advances in Drying Science and Technology); Law, C.L. and Karim, A., Eds.; CRC Press: United States of America, 2017; pp. 123–137.
- Naumis, G. G. Variation of the Glass Transition Temperature with Rigidity and Chemical Composition. Phys. Rev. B. 2006, 73(17), 172202-1-172202–4. DOI: 10.1103/PhysRevB.73.172202.
- Khan, M. I. H.; Wellard, R. M.; Nagy, S. A.; Joardder, M. U. H.; Karim, M. A. Experimental Investigation of Bound and Free Water Transport Process During Drying of Hygroscopic Food Material. Int. J. Therm. Sci. 2017, 117, 266–273. DOI: 10.1016/j.ijthermalsci.2017.04.006.
- Kawai, K.; Fukami, K.; Thanatuksorn, P.; Viriyarattanasak, C.; Kajiwara, K. Effects of Moisture Content, Molecular Weight, and Crystallinity on the Glass Transition Temperature of Inulin. Carbohydr. Polym. 2011, 83(2), 934–939. DOI: 10.1016/j.carbpol.2010.09.001.
- Zimeri, J. E.; Kokini, J. L. The Effect of Moisture Content on the Crystallinity and Glass Transition Temperature of Inulin. Carbohydr. Polym. 2002, 48(3), 299–304. DOI: 10.1016/S0144-8617(01)00260-0.
- ROOS, Y. H. Effect of Moisture on the Thermal Behavior of Strawberries Studied Using Differential Scanning Calorimetry. J. Food Sci. 1987, 52(1), 146–149. DOI: 10.1111/j.1365-2621.1987.tb13992.x.
- Goula, A. M.; Adamopoulos, K. G. Effect of Maltodextrin Addition During Spray Drying of Tomato Pulp in Dehumidified Air: I. Drying Kinetics and Product Recovery. Dry. Technol. 2008, 26(6), 714–725. DOI: 10.1080/07373930802046369.
- Muthukumarappan, K.; Swamy, G. J. Glass Transition Thermodynamics and Kinetics. In Glass Transition and Phase Transitions in Food and Biological Materials, Ahmed, J., Rahman, M.S. and Roos, Y.H., Eds.; Chichester, UK: John Wiley & Sons Ltd, 2017; pp. 31–47.
- Sundaram, J.; Mani, S.; Das, H. Glass Transition and Sticky Point Temperatures of Food Powders and Its Relationship with Moisture Content and Water Activity. An ASAE/CSAE Meet. Present. 2013, 0300(04). DOI: 10.13031/2013.16915.
- Mauer, L. J.; Smith, D. E.; Labuza, T. P. Effect of Water Content, Temperature and Storage on the Glass Transition, Moisture Sorption Characteristics and Stickiness of β-Casein. Int. J. Food. Prop. 2000, 3(2), 233–248. DOI: 10.1080/10942910009524630.
- Moraru, C. I.; Lee, T. C.; Karwe, M. V.; Kokini, J. L. Plasticizing and Antiplasticizing Effects of Water and Polyols on a Meat-Starch Extruded Matrix. J. Food Sci. 2002, 67(9), 3396–3401. DOI: 10.1111/j.1365-2621.2002.tb09596.x.
- Yang, B.; Huang, W. M.; Li, C.; Chor, J. H. Effects of Moisture on the Glass Transition Temperature of Polyurethane Shape Memory Polymer Filled with Nano-Carbon Powder. Eur. Polym. J. 2005, 41(5), 1123–1128. DOI: 10.1016/j.eurpolymj.2004.11.029.
- Szcześniak, L.; Rachocki, A.; Tritt-Goc, J. Glass Transition Temperature and Thermal Decomposition of Cellulose Powder. Cellulose. 2008, 15(3), 445–451. DOI: 10.1007/s10570-007-9192-2.
- Furuta, Y.; Obata, Y.; Kanayama, K. Thermal-Softening Properties of Water-Swollen Wood IV. The Effects of Chemical Constituents of the Cell Wall on the Thermal-Softening Properties of Wood. Mokuzai Gakkaish. 1997, 43(4), 725–730. DOI: 10.1023/A:1004838831791.
- Kong, L.; Zhao, Z.; He, Z.; Yi, S. Effects of Steaming Treatment on Crystallinity and Glass Transition Temperature of Eucalyptuses Grandis × E. Urophylla. Results. Phys. 2017, 7, 914–919. DOI: 10.1016/j.rinp.2017.02.017.
- Basu, S.; Shivhare, U. S.; Muley, S. Moisture Adsorption Isotherms and Glass Transition Temperature of Pectin. J. Food Sci. Technol. 2013, 50(3), 585–589. DOI: 10.1007/s13197-011-0327-y.
- Joardder, M. U. H.; Kumar, C.; Karim, M. A. Food Structure: Its Formation and Relationships with Other Properties. Crit. Rev. Food Sci. Nutr. 2017, 57(6), 1190–1205. DOI: 10.1080/10408398.2014.971354.
- Kun, D.; Pukánszky, B. Polymer/Lignin Blends: Interactions, Properties, Applications. European Polymer J. 2017, 93, 618–641. DOI: 10.1016/j.eurpolymj.2017.04.035.
- Dimarzio, E. A.; Gibbs, J. H. Molecular Interpretation of Glass Temperature Depression by Plasticizers. J. Polym. Sci. Part A Gen. Pap. 1963, 1(4), 1417–1428. DOI: 10.1002/pol.1963.100010428.
- Jansen, J. C. Glass Transition Temperature (Tg). Encycl. Membr. 2015, 2–4. DOI: 10.1007/978-3-642-40872-4.
- Brent, J. L.; Mulvaney, S. J.; Cohen, C.; Bartsch, J. A. Viscoelastic Properties of Extruded Cereal Melts. J. Cereal Sci. 1997, 26(3), 313–328. DOI: 10.1006/jcrs.1997.0141.
- Taylor, P.; Slade, L.; Levine, H.; Reid, D. S.; Slade, L.; Levine, H. “Beyond Water Activity: Recent Advances Based on an Alternative Approach to the Assessment of Food Quality and safety,” No. July. 1991, 2012, 37–41.
- Roos, Y. Characterization of Food Polymers Using State Diagrams. J. Food Eng. 1995, 24(3), 339–360. DOI: 10.1016/0260-8774(95)90050-L.
- Al-Haik, M. S.; Hussaini, M. Y.; Garmestani, H. Prediction of Nonlinear Viscoelastic Behavior of Polymeric Composites Using an Artificial Neural Network. Int. J. Plast. 2006, 22(7), 1367–1392. DOI: 10.1016/j.ijplas.2005.09.002.
- ROOS, Y.; KAREL, M. Water and Molecular Weight Effects on Glass Transitions in Amorphous Carbohydrates and Carbohydrate Solutions. J. Food Sci. 1991, 56(6), 1676–1681. DOI: 10.1111/j.1365-2621.1991.tb08669.x.
- Roos, Y.; Karel, M. Phase Transitions of Mixtures of Amorphous Polysaccharides and Sugars. Biotechnol. Prog. 1991, 7(1), 49–53. DOI: 10.1021/bp00007a008.
- Blanchard, L. -P.; Hesse, J.; Malhotra, S. L. Effect of Molecular Weight on Glass Transition by Differential Scanning Calorimetry. Can. J. Chem. 1974, 52(18), 3170–3175. DOI: 10.1139/v74-465.
- Montserrat, S.; Colomer, P. The Effect of the Molecular Weight on the Glass Transition Temperature in Amorphous Poly(ethylene Terephthalate). Polym. Bull. 1984, 12(2), 173–180. DOI: 10.1007/BF00263341.
- Joardder, M. U. H.; Karim, A.; Kumar, C.; Brown, R. J. SpringerBriefs in Food, Health, and Nutrition, 2015.
- Ross, K. A.; Campanella, O. H.; Okos, M. R. The Effect of Porosity on Glass Transition Measurement. Int. J. Food. Prop. 2002, 5(3), 611–628. DOI: 10.1081/JFP-120015496.
- Kasapis, S. Relation Between the Structure of Matrices and Their Mechanical Relaxation Mechanisms During the Glass Transition of Biomaterials: A Review. Food Hydrocoll. 2012, 26(2), 464–472. DOI: 10.1016/j.foodhyd.2010.09.019.
- Roos, Y. H.; Gatti, M.; Bottari, B.; Neviani, E.; Tabanelli, G.; Gardini, F. Importance of Glass Transition and Water Activity to Spray Drying and Stability of Dairy Powders. J. Food Prot. 2009, 72(10), 2162–2169. DOI: 10.1051/lait.
- Kasapis, S.; Sablani, S. S.; Rahman, M. S.; Al-Marhoobi, I. M.; Al-Amri, I. S. Porosity and the Effect of Structural Changes on the Mechanical Glass Transition Temperature. J. Agric. Food. Chem. 2007, 55(6), 2459–2466. DOI: 10.1021/jf063473j.
- Carbone, P.; Rapallo, A.; Ragazzi, M.; Tritto, I.; Ferro, D. R. Glass Transition Temperature and Chain Flexibility of Ethylene-Norbornene Copolymers from Molecular Dynamics Simulations. Macromol. Theory Simulations. 2006, 15(6), 457–468. DOI: 10.1002/mats.200600015.
- Privalko, V. P.; Lipatov, Y. S. Glass Transition and Chain Flexibility of Linear Polymers. J. Macromol. Sci.Part B. 1974, 9(3), 551–564. DOI: 10.1080/00222347408204554.
- Balani, K.; Verma, V.; Agarwal, A.; Narayan, R. Physical, Thermal, and Mechanical Properties of Polymers. Biosurfaces. 2015, 329–344. DOI: 10.1002/9781118950623.app1.
- Langer, E.; Bortel, K.; Lenartowicz-Klik, M.; Waskiewicz, S. Plasticizers Derived from Post-Consumer PET: Research Trends and Potential Applications; Elsevier, 2019
- Langer, E.; Bortel, K.; Waskiewicz, S.; Lenartowicz-Klik, M. Assessment of Traditional Plasticizers. Plasticizers Derived from Post-Consumer PET. 2020, 1–11.
- Luo, X.; Xie, S.; Liu, J.; Hu, H.; Jiang, J.; Huang, W.; Gao, H.; Zhou, D.; Lü, Z.; Yan, D. The Relationship Between the Degree of Branching and Glass Transition Temperature of Branched Polyethylene: Experiment and Simulation. Polym. Chem. 2014, 5(4), 1305–1312. DOI: 10.1039/c3py00896g.
- Cowie, J. M. G.; Henshall, S. A. E. The Influence of Chain Length and Branching on the Glass Transition Temperature of Some Polyglucosans. Eur. Polym. J. 1976, 12(4), 215–218. DOI: 10.1016/0014-3057(76)90056-2.
- Gontard, N.; Ring, S. Edible Wheat Gluten Film: Influence of Water Content on Glass Transition Temperature. J. Agric. Food. Chem. 1996, 44(11), 3474–3478. DOI: 10.1021/jf960230q.
- Souri, D. Study of the Heating Rate Effect on the Glass Transition Properties of (60 - X)V2O5-xSb2o3-40TeO2 Oxide Glasses Using Differential Scanning Calorimetry (DSC). Meas. J. Int. Meas. Confed. 2011, 44(10), 2049–2053. DOI: 10.1016/j.measurement.2011.08.005.
- Grest, G. S.; Cohen, M. H. Liquid-Glass Transition: Dependence of the Glass Transition on Heating and Cooling Rates. Phys. Rev. B. 1980, 21(9), 4113–4117. DOI: 10.1103/PhysRevB.21.4113.
- Joardder, M. U. H.; Karim, M. A. Development of a Porosity Prediction Model Based on Shrinkage Velocity and Glass Transition Temperature. Dry. Technol. 2019, 37(15), 1988–2004. DOI: 10.1080/07373937.2018.1555540.
- Moynihan, C. T.; Easteal, A. J.; Wilder, J.; Tucker, J. Dependence of the Glass Transition Temperature on Heating and Cooling Rate. J. Phys. Chem. 1974, 78(26), 2673–2677. DOI: 10.1021/j100619a008.
- Chrostek, T., “The Influence of the Heating and Cooling Rates on the Temperature of the Phase Transitions,” pp. 87–98, [Online]. Available: https://depot.ceon.pl/bitstream/handle/123456789/10665/6_Chrostek.pdf?sequence=1.
- Abbas, K. A.; Lasekan, O.; Khalil, S. K. The Significance of Glass Transition Temperature in Processing of Selected Fried Food Products: A Review. Mod. Appl. Sci. 2010, 4(5), 3–21. DOI: 10.5539/mas.v4n5p3.
- Rahman, M. S. State Diagram of Foods: Its Potential Use in Food Processing and Product Stability. Trends Food Sci. Technol. 2006, 17(3), 129–141. DOI: 10.1016/j.tifs.2005.09.009.
- Roos, Y. H. Glass Transition Temperature and Its Relevance in Food Processing. Annu. Rev. Food Sci. Technol. 2010, 1(1), 469–496. DOI: 10.1146/annurev.food.102308.124139.
- Carbas, R. J. C.; Marques, E. A. S.; Da Silva, L. F. M.; Lopes, A. M. Effect of Cure Temperature on the Glass Transition Temperature and Mechanical Properties of Epoxy Adhesives. J. Adhes. 2014, 90(September), 104–119. DOI:10.1080/00218464.2013.779559. 2014.
- Michel, M.; Ferrier, E. Effect of Curing Temperature Conditions on Glass Transition Temperature Values of Epoxy Polymer Used for Wet Lay-Up Applications. Constr. Build. Mater. 2020, 231, 117206. DOI: 10.1016/j.conbuildmat.2019.117206.
- Debenedetti, P. G.; Stillinger, F. H. Supercooled Liquids and the Glass Transition Insight. J. Eur. Ceram. Soc. 2001, 410(8), 1463–1471. DOI: 10.1016/j.jeurceramsoc.2005.02.009.
- Ross, K. A.; Susan, D.; Cenkowski, S. A Polymer Science Approach to Physico-Chemical Characterization and Processing of Pulse Seeds. Polym. Sci. 2013. DOI: 10.5772/46145.
- Norton, C. Texture and Hydration of Expanded Rice, University of Nottingham, UK, 1998.
- Paterson, M. S. Effect of Pressure on Young’s Modulus and the Glass Transition in Rubbers. J. Appl. Phys. 1964, 35(1), 176–179. DOI: 10.1063/1.1713063.
- Torres, J. M.; Wang, C.; Coughlin, E. B.; Bishop, J. P.; Register, R. A.; Riggleman, R. A.; Stafford, C. M.; Vogt, B. D. Influence of Chain Stiffness on Thermal and Mechanical Properties of Polymer Thin Films. Macromolecules. 2011, 44(22), 9040–9045. DOI: 10.1021/ma201482b.
- Masud, M. H.; Joardder, M. U. H.; Karim, M. A. Effect of Hysteresis Phenomena of Cellular Plant- Based Food Materials on Convection Drying Kinetics. Dry. Technol. 2018, 0(0), 1–8. DOI: 10.1080/07373937.2018.1498508.
- Ahmed, J.; Ramaswamy, H. S. Applications of magnetic field in food preservation. In Handbook of Food Preservation; CRC Press: Boca Raton, 2020; pp. 873–884.
- Schapery, R. A. Nonlinear Viscoelastic and Viscoplastic Constitutive Equations Based on Thermodynamics. Mech. Time-Dependent Mater. 1997, 1(2), 209–240. DOI: 10.1023/A:1009767812821.
- Kawai, M.; Masuko, Y. Macromechanical Modeling and Analysis of the Viscoplastic Behavior of Unidirectional Fiber-Reinforced Composites. J. Compos. Mater. 2003, 37(21), 1885–1902. DOI: 10.1177/002199803035185.
- Khan, A. S.; Lopez-Pamies, O. Time and Temperature Dependent Response and Relaxation of a Soft Polymer. Int. J. Plast. 2002, 18(10), 1359–1372. DOI: 10.1016/S0749-6419(02)00003-7.
- Rahman, M. M.; Joardder, M. U. H.; Karim, A. Non-Destructive Investigation of Cellular Level Moisture Distribution and Morphological Changes During Drying of a Plant-Based Food Material. Biosyst. Eng. 2018, 169, 126–138. DOI: 10.1016/j.biosystemseng.2018.02.007.
- Roos, Y. H. Thermal Analysis, State Transitions and Food Quality. J. Therm. Anal. Calorim. 2003, 71(1), 197–203. DOI: 10.1023/A:1022234805054.
- Joardder, M. U. H.; Kumar, C.; Karim, M. A. Prediction of Porosity of Food Materials During Drying: Current Challenges and Directions. Crit. Rev. Food Sci. Nutr. 2018, 58(17), 2896–2907. DOI: 10.1080/10408398.2017.1345852.
- Zhang, Y. L.; Rao, G. H.; Sun, J. R.; Liang, J. K. Phase Transitions in (Nd, Sm)1/2Sr1/2MnO3. J. Phys D: Appl Phys. 1998, 31(4), 368–370. DOI: 10.1088/0022-3727/31/4/005.
- Górska, A.; Szulc, K.; Ostrowska-Ligęza, E.; Bryś, J.; Wirkowska-Wojdyła, M. Effect of Composition and Drying Method on Glass Transition Temperature, Water Sorption Characteristics and Surface Morphology of Newly Designed β-Lactoglobulin/retinyl Palmitate/Disaccharides Systems. J. Therm. Anal. Calorim. 2017, 130(1), 177–185. DOI: 10.1007/s10973-017-6392-3.
- Joardder, M. U. H.; Brown, R. J.; Kumar, C.; Karim, M. A. Effect of Cell Wall Properties on Porosity and Shrinkage of Dried Apple. Int. J. Food. Prop. 2015, 18(10), 2327–2337. DOI: 10.1080/10942912.2014.980945.
- Mahiuddin, M.; Khan, I. H.; Kumar, C.; Rahman, M. M.; Karim, M. A. Shrinkage of Food Materials During Drying: Current Status and Challenges. Compr. Rev. Food Sci. Food Saf. 2018, 0, 1–14. DOI: 10.1111/1541-4337.12375.
- Karathanos, V. T.; Kanellopoulos, N. K.; Belessiotis, V. G. Development of Porous Structure During Air Drying of Agricultural Plant Products. J. Food Eng. 1996, 29(2), 167–183. DOI: 10.1016/0260-8774(95)00058-5.
- Sappati, P. K.; Nayak, B.; van Walsum, G. P. Effect of Glass Transition on the Shrinkage of Sugar Kelp (Saccharina Latissima) During Hot Air Convective Drying. J. Food Eng. 2017, 210, 50–61. DOI: 10.1016/j.jfoodeng.2017.04.018.
- Bhandari, B. R.; Howes, T. Implication of Glass Transition for the Drying and Stability of Dried Foods. J. Food Eng. 1999, 40(1), 71–79. DOI: 10.1016/S0260-8774(99)00039-4.
- Mayor, L.; Sereno, A. M. Modelling Shrinkage During Convective Drying of Food Materials: A Review. J. Food Eng. 2004, 61(3), 373–386. DOI: 10.1016/S0260-8774(03)00144-4.
- Levi, G.; Karel, M. Volumetric Shrinkage (Collapse) in Freeze-Dried Carbohydrates Above Their Glass Transition Temperature. Food. Res. Int. 1995, 28(2), 145–151. DOI: 10.1016/0963-9969(95)90798-F.
- Romdhane, I. H.; Danner, R. P.; Duda, J. L. Influence of the Glass Transition on Solute Diffusion in Polymers by Inverse Gas Chromatography. Ind. Eng. Chem. Res. 1995, 34(8), 2833–2840. DOI: 10.1021/ie00047a037.
- Karel, M.; Anglea, S.; Buera, P.; Karmas, R.; Levi, G.; Roos, Y. Stability-Related Transitions of Amorphous Foods. Thermochim. Acta. 1994, 246(2), 249–269. DOI: 10.1016/0040-6031(94)80094-4.
- Zhang, H.; Sun, D. D.; Peng, Y.; Huang, J. H.; Luo, M. B. Diffusivity and Glass Transition of Polymer Chains in Polymer Nanocomposites. Phys. Chem. Chem. Phys. 2019, 21(41), 23209–23216. DOI: 10.1039/c9cp04195h.
- Mamaliga, I.; Negoescu, C. Some Aspects of Two Stage Diffusion in Polymer Films and Membranes. Environ. Eng. Manage. J. 2012, 11(11), 2091–2099. DOI: 10.30638/eemj.2012.261.
- Matteucci, S.; Yampolskii, Y.; Freeman, B. D.; Pinnau, I. Transport of Gases and Vapors in Glassy and Rubbery Polymers. In Materials Sci. of Membranes for Gas and Vapor Separation; John Wiley & Sons, Ltd: England, 2006; pp. 1–47.
- Elisa, E.; Bruno, R.; Monteleone, M.; Fuoco, A.; Soria, J. F.; Pardo, E.; Armentano, D.; Jansen, J. C. Glassy PEEK-WC Vs. Rubbery Pebax® 1657 Polymers: Effect on the Gas Transport in CuNi-MOF Based Mixed Matrix Membranes. Appl. Sci. 2020, 10(4), 2020. DOI: 10.3390/app10041310.
- Stannett, V. The Transport of Gases in Synthetic Polymeric Membranes - an Historic Perspective. J. Membr. Sci. 1978, 3(2), 97–115. DOI: 10.1016/S0376-7388(00)83016-1.
- Sand, C. K. Raising the Bar: High-Barrier Polymers. Food Technol. 2018, 72(10), 83–87.
- Peleg, M.; Chinachoti, P. On Modeling Changes in Food and Biosolids at and Around Their Glass Transition Temperature Range. Crit. Rev. Food Sci. Nutr. 1996, 36(1–2), 49–67. DOI: 10.1080/10408399609527718.
- Roos, Y. H.; Karel, M.; Kokini, J. L. Glass Transitions in Low Moisture and Frozen Foods: Effects on Shelf Life and Quality. Food Technol. 1996, (November), 50, 95–108.
- Chambers, E. Analysis of Sensory Properties in Foods: A Special Issue. Foods. 2019, 8(8), 7–9. DOI: 10.3390/foods8080291.
- Lee, Y.; Lee, S. -Y.; Schmidt, S. J. Probing the Sensory Properties of Food Materials with Nuclear Magnetic Resonance Spectroscopy and Imaging. Mod. Magn. Reson. 2008, 1889–1894. DOI: 10.1007/1-4020-3910-7_215.
- Lievonen, S. M.; Roos, Y. H. Nonenzymatic Browning in Amorphous Food Models: Effects of Glass Transition and Water. J. Food Sci. 2002, 67(6), 2100–2106. DOI: 10.1111/j.1365-2621.2002.tb09508.x.
- Joardder, M. U. H.; Kumar, C.; Karim, M. A. Multiphase Transfer Model for Intermittent Microwave-Convective Drying of Food: Considering Shrinkage and Pore Evolution. Int. J. Multiph. Flow. 2017, 95, 101–119. DOI: 10.1016/j.ijmultiphaseflow.2017.03.018.
- Katz, E. E.; Labuza, T. P. Effect of Water Activity on the Sensory Crispness and Mechanical Deformation of Snack Food Products. J. Food Qual. 1981, 46(3), 403–409. DOI: 10.1111/j.1365-2621.1981.tb04871.x.
- Meste, M. L.; Champion, D.; Roudaut, G.; Blond, G.; Simatos, D. Glass Transition and Food Technology: A Critical Appraisal. J. Food Sci. 2002, 67(7), 2444–2458. DOI: 10.1111/j.1365-2621.2002.tb08758.x.
- Rahman, M. S. Food Stability Beyond Water Activity and Glass Transtion: Macro-Micro Region Concept in the State Diagram. Int. J. Food. Prop. 2009, 12(4), 726–740. DOI: 10.1080/10942910802628107.
- Slade, L.; Levine, H. Water and the Glass Transition - Dependence of the Glass Transition on Composition and Chemical Structure: Special Implications for Flour Functionality in Cookie Baking. J. Food Eng. 1994, 22(1–4), 143–188. DOI: 10.1016/0260-8774(94)90029-9.