Abstract
Edible red palm olein (RPOL) has been newly developed by the Malaysian Palm Oil Board for use in food products to enhance their nutritional value. The results of the effect of RPOL and red palm shortening (RPS) on the objective color and instrumental texture of these functional foods are presented. The results indicate that using up to 100% RPS in the test bread samples did not have any adverse effect on the textural quality of the samples, with the results being comparable with the respective control breads. However, increasing the level of RPOL caused a simultaneous increase in compression force with the values being highest at the 100% replacement level. Replacement with RPOL in bread formulations at the 100% level increased the compression force to 15.2 N for whole-wheat bread, 7.5 N for white bread, and 11.7 N for 20% bran (0.2 kg bran/kg flour) bread over that of control whole-wheat bread (8.3 N), control white bread (3.3 N), and control 20% bran bread (4.2 N). This indicates that RPOL does not perform as well in pan bread as compared with RPS. Using 0.5% diacetyl tartaric acid esters of monoglycerides (DATEM) in bread formulations produced a decrease in compression force values at all combination levels of RPS and RPOL, thus producing a softer product. As RPOL and RPL are extremely rich in carotene pigments (727 ppm), the major changes in crumb color were observed in the yellowness values (b*). The results indicate that increasing the level of RPS or RPOL in test bread samples caused a similar increase in crumb color yellowness values (b*), with a higher increase observed due to increased levels of RPOL.
Introduction
Dietary fats continue to be a major research priority area mainly because of their association with cardiovascular diseases, cancer, and other chronic diseases.Citation1 Fat is a concentrated source of calories, compared with carbohydrates or proteins, and is an efficient form of energy storage in our bodies. According to the FAO/WHO guidelines, one should obtain 20% of dietary energy from fats.Citation2 National dietary guidelines in most of the industrialized countries recommend reductions in total fat and saturated fatty acids. Equal proportions of saturated fatty acids (SFAs), monounsaturated fatty acids (MUFAs), and polyunsaturated fatty acids (PUFAs) are now recommended for the consumers.
Palm olein contains 40% monounsaturated and 10% polyunsaturated oils and no cholesterol.Citation3 The American Heart Association recommends a ratio of 1:1:1 for saturated:monounsaturated:polyunsaturated fatty acids in oil composition. Fat consumption in developed countries is usually much greater than the recommended levels. The average intake of fats is also increasing in the developing countries that are improving their socioeconomic conditions.Citation4 Palm olein also contains significant amounts of tocopherol, which gives it a further nutritional advantage. Red palm shortening (RPS) and red palm olein (RPOL) are not only rich in β-carotene, but are also an excellent source of vitamin E, two of the most important fat-soluble antioxidants for our well being. According to Ping and May,Citation5 commercial RPOL contains about 519–531 ppm of vitamin E and 720–733 ppm of carotenes (more than 80% of which are α- and β-carotenes).
Fat (shortening) is extensively used in the manufacture of all bakery products. Shortening, in general, contributes towards the tenderness, volume, shelf-life, and flavor of these products. An optimal amount of fat in bread dough will improve the loaf volume, crumb grain, texture, crust, and keeping quality of the bread.Citation6 In cake making, one of the most important function of shortening is to incorporate air during creaming, which results in improved moistness, tenderness, and eating quality. In biscuits (cookies), the use of shortening is essential to obtain a desirable, soft texture.Citation7 To produce the best performance in bakery products, the shortening must have a desirable consistency and crystal structure in β-prime form. The palm oil has distinct advantages over other fats in the formulation of bakery shortenings. The palm oil has about 22–25% solids (0.22–0.25 kg solids/kg palm oil) and stabilizes the shortening in β-prime form. Moreover, it does not require hydrogenation, thus reducing the processing cost as well as eliminating the formation of undesirable trans fatty acids in the products, which have been reported to have adverse nutritional effects.Citation8
Considering the technological and nutritional importance of RPOL and RPS, they were used in the preparation of pan bread and sugar-snap cookies on a laboratory scale, and their effect on the instrumental texture and objective color of these functional foods was studied, and the results are reported here.
Materials and Methods
Raw Materials
The Carotino Company of Malaysia provided the RPS and RPOL free of charge. White flour, whole-wheat flour, and fine bran were obtained from the Kuwait Flour Mills and Bakeries Co., Kuwait. Fine granulated sugar, common salt, bakery shortening (Wesson brand, USA), instant dry yeast and nonfat dry milk were procured from the local market. Diacetyl tartaric acid esters of monoglycerides (DATEM) were procured from the American Ingredients Co., Kansas City, USA. All other chemicals were of analytical grade.
Pan Bread Formulation
For bread-making, whole-wheat flour, fine bran (20% replacement of white flour), and unbleached straight-grade flour with 72% extraction were used in various trials. For bread-making, the optimized straight-dough bread-making method (Method 10-10B) of the American Association of Cereal ChemistsCitation9 was used. The bread was baked at 215°C for 24 min. The basic bread dough formulation contained 1.0 kg of flour, 0.06 kg of sucrose, 0.015 kg of salt, 0.03 kg of shortening, 0.04 kg of nonfat dry milk, 0.0175 kg of instant dry yeast, 0.0035 kg of malt flour, and 75 ppm of ascorbic acid. The amounts of flour and bran used in these trials were calculated on a 14% moisture content basis. Two loaves were made per baking test, and each baking test was replicated two times. Initial trials were conducted for replacement of bakery shortening (Wesson, USA) with RPOL or RPS at 0, 25, 50, 75, and 100% levels (kg/kg of flour). Whole-wheat bread was made with whole-wheat flour, white bread with white flour of 72% extraction, and brown bread with white flour and fine bran in an 80:20 ratio. In these trials, control breads containing only the Wesson shortening and no RPOL or RPS, were formulated from whole-wheat flour, white flour, and white flour with 20% bran (brown bread), respectively. After the initial trials, different combinations of RPS and RPOL as a 100% replacement of the bakery shortening (Wesson, USA) utilized in the control bread were used in formulations of test breads. The different combinations of RPS and RPOL were 0:100%, 25:75%, 50:50% and 100:0%. After initial trials, 0.005 kg DATEM/kg flour was used in the optimized trials.
Instrumental Texture Measurement
After baking, the bread samples were cooled overnight to reach a room temperature of 22±1°C. Four slices of uniform thickness (2.54 mm) were then obtained and immediately taken for objective texture measurement with a Stable Micro Systems TAXT2 Texture Analyzer (UK), using a plastic plunger (2.54 mm diameter), and plunger speed of 1.7 mm s−1. The compression force value (in grams) at 30% compression (i.e., a compression depth of 7.5 mm) was measured in the center of each of the four slices, and the average values are reported.
Objective Color Measurements
The crumb color of bread samples, which were cooled overnight to reach a room temperature of 22±1°C, was measured with a Macbeth Color Checker (model 545, Kollmorgen Instruments Corp., UK) Portable Spectrophotometer as CIE L* a* b* values. Under this tristimulus color-coordinate system, the L* value is a measure of lightness and varies from 0 (black) to 100 (white), the a* value varies from −100 (green) to +100 (red); and the b* value varies from −100 (blue) to +100 (yellow). As the values of a* and b* rise, the color becomes more saturated or chromatic, but these values approach zero for neutral colors (white, gray or black). The instrument settings were Illuminant D50, Display L* a* b*, Observer 2°, and were calibrated with a white primary tile supplied by the manufacturer. After slicing the bread loaf into two halves, six readings were taken in the crumb area of each half. After discarding the two most extreme readings, the remaining ten were averaged and are reported.
Results and Discussion
Both the functional foods (pan bread and sugar-snap cookies) prepared using β-carotene- and vitamin-E-rich RPOL and RPS, were evaluated for instrumental texture and objective color, and the results are presented in Tables , , , , , , . Lower compression force values are desirable as these indicate a softer texture of bread.
Table 1 Compression force of whole-wheat bread, white bread, and brown bread samples with different levels of RPS or RPOL
Objective Texture Measurements
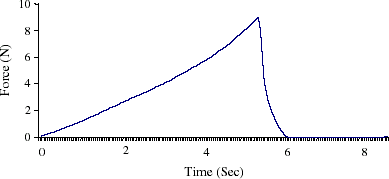
After cooling the bread to room temperature, the compression force for the objective texture of whole-wheat, white, and 20% bran bread samples containing different levels of RPS and/or RPOL was measured, and the results are presented in Table . A typical force-time graph showing the compression force for whole-wheat flour bread is depicted in Fig. . The results indicate that using up to 100% RPS in the test bread samples did not have any adverse effect on the textural quality of the samples, with the results being comparable to those of the respective control breads. However, increasing the level of RPOL caused a simultaneous increase in compression force with the values being highest at the 100% replacement level. The replacement with RPOL in bread formulations at the 100% level significantly increased the compression force to 15.2 N for whole-wheat bread, 7.5 N for white bread, and 11.7 N for 20% bran bread compared with 8.3 N for control whole-wheat bread, 3.3 N for control white bread, and 4.2 N for control 20% bran bread. This indicates that RPOL alone does not perform as well in pan bread as RPS. This corroborates the observations of IdrisCitation6 that a bakery shortening must have a required plasticity to improve the texture and loaf volume of bread.
Figure 1. A typical force-time graph of compression force for whole wheat flour bread.
The effect of utilizing DATEM and various combinations of RPS and RPOL as a 100% replacement in bread formulations on the compression force for texture measurements of whole-wheat bread are presented in Table . The results clearly indicate that using 100% RPOL in bread formulations significantly increased the compression force to 19.2 N, compared with the control value of 6.8 N. Also, increasing the levels of RPS while decreasing those of RPOL resulted in a simultaneous decrease in compression force, which reached 7.5 N for the 100% level of RPS compared with 6.8 N for the control. Utilizing 0.5% DATEM in bread formulations produced a significant decrease in compression force values for all combinations of RPS and RPOL, with the value being the lowest (6.1 N) for test bread containing 100% RPS, which was comparable with the control (6.2 N). These results indicate that the use of DATEM was effective in softening the bread texture when any combination of RPS and RPOL is used. The compression force values of optimized whole-wheat flour, white flour, and 20% bran test bread samples containing DATEM and optimized levels of RPS or RPS:RPOL combinations are presented in Table . The results indicate that control white bread had the lowest compression force values (3.9 N), and that a replacement level of 100% RPS or equal proportions of RPS and RPOL did not affect the texture of test bread adversely, with the values being 4.3 N and 4.4 N, respectively. Also, the utilization of 100% RPS in whole-wheat flour and 20% bran test breads, and equal proportions of RPS and RPOL in whole-wheat flour test breads resulted in significantly higher compression force values than in the whole-wheat control bread and significantly higher compression force values than in the white bread test and control samples. The utilization of equal proportions of RPS and RPOL in 20% bran bread formulations resulted in test breads having comparable compression force values (8.0 N) to whole-wheat test bread (8.1 N). The compression force data indicate that RPS alone or in equal ratio with RPOL did not adversely affect the texture of white flour bread. However, the use of RPS alone or in combination with RPOL significantly increased the compression force values indicating a harder texture. It can be concluded that the white flour bread samples had the lowest compression force values, indicating a softer texture than either the whole-wheat bread or brown bread made with RPS alone or in combination with RPOL.
Table 2 Compression force of whole-wheat bread containing different combinations of RPS and RPOL, with and without DATEM emulsifier
Table 3 Compression force of optimized bread samples containing DATEM emulsifier
Objective Color Measurements
After cooling bread to room temperature, the objective color of the bread crumb was measured using the CIE tristimulus system. The CIE L* a* b* values for the crumb color of whole-wheat flour, white flour, and 20% bran (brown) bread test samples containing different levels of RPS and RPOL are presented in Tables , , , . The results of the crumb color evaluation for whole-wheat bread are presented in Table . The results indicate that the crumb color lightness value (L*) decreased slightly with increasing levels of RPS and RPOL in test bread samples when compared with control whole-wheat bread. This means that the test bread samples were slightly darker than with the control. The crumb color redness value (a*) was almost the same for the test samples and the control, even with increasing RPS levels, while the increasing RPOL levels resulted in a slight increase in a* values compared with the control. As the RPOL and RPS are extremely rich in carotene (727 ppm) pigments,Citation5 the major changes in crumb color were observed in the yellowness values (b*). The results indicate that increasing the level of RPS or RPOL in test bread samples caused a similar increase in crumb color yellowness values (b*), with a higher increase observed due to increased levels of RPOL.
Table 4 CIE L* a* b* values for crumb color of whole-wheat bread samples containing different levels of RPS and RPOL
A similar trend in the crumb color values, due to increasing levels of RPS and RPOL, was also observed for white bread test samples (Table ). The control white bread had the highest L* value (69.6), which is a measure of lightness. As the levels of RPS and RPOL increased, the test samples obtained slightly darker colors than the control; test samples containing RPOL showed a much darker color than those with RPS. Again, the most prominent change was observed in the b* values, which is a measure of yellowness, with the values being 29.3 for 100% RPS and 38.6 for 100% RPOL, compared with a control white bread value of 11.9. The b* value for brown bread samples with 100% RPOL breads was also higher (34.6) than that with 100% RPS (29.3). These results indicate that RPOL had a more yellowish color than RPS breads (Table ).
Table 5 CIE L* a* b* values for crumb color of white bread samples containing different levels of RPS and RPOL
Table 6 CIE L* a* b* values for crumb color of brown bread samples with 20% bran containing 100% RPS and RPOL
Table 7 CIE L* a* b* values for crumb color of whole-wheat bread samples containing different combinations of RPS, RPOL, and DATEM
The results presented in Table for different combinations of RPS and RPOL in whole-wheat bread clearly indicate that as the level of RPS was increased in the test bread formulation, the crumb color for yellowness (b*) decreased, the b* value being 34.6 for 100% RPOL and 29.2 for 100% RPS, compared with 18.8 for control whole-wheat bread. The L* and a* values, which are measures of lightness and redness, respectively, did not show as much difference that could be attributed to changes in the RPS and RPOL proportions. As expected, the use of DATEM did not have any effect on the crumb color of bread samples.
The CIE L* a* b* values for crumb color measurements of optimized bread samples are presented in Table . The results indicate that there was no change in the measure of lightness (L*) or the measure of redness (a*) that could be attributed due to the utilization of 100% RPS or equal proportions of RPS and RPOL in whole-wheat bread or brown bread test samples, compared with those of their respective control breads. The major difference was observed in the measure of yellowness (b*), with the inclusion of RPOL in bread formulations resulting in higher b* values.
Table 8 CIE L* a* b* values for crumb color of optimized bread samples containing DATEM emulsifier
As can be seen from the foregoing discussion, the inclusion of RPS or RPOL in bread formulations did not affect the lightness (L*) or the redness (a*) crumb color values, but the yellowness (b*) values increased. The presence of higher amounts of carotenoid pigments (720–733 ppm, mainly α- and β-carotenes) in RPOL and RPS are responsible for darkening the crumb color (darker yellow color) of the test bread samples.Citation5 Interestingly, from the sensory quality point of view, these bread and cookie samples (with yellow color) containing RPOL and RPS were equally acceptable to the consumers. Moreover, the cookies made with RPOL and RPS had superior texture and flavor to the control cookies.Citation10 Thus, using RPOL and RPS, functional foods (such as bread and cookies) rich in antioxidant vitamins (vitamin E and carotenes) with desirable texture and color, could be produced for the nutritional benefit of consumers.
Conclusion
From the above discussion, it can be concluded that RPS can completely replace the control shortening without adversely affecting the textural quality of pan bread. However, increasing the RPOL in the bread formulation produced a simultaneous increase in compression force indicating a harder texture of pan bread. Use of RPOL resulted in enhanced yellow color in bread crumb than the RPS. For producing bread rich in antioxidant vitamins (vitamin E and carotenes), but with acceptable textural qualities, use of an emulsifier (such as DATEM) in the bread formulation is essential.
Acknowledgments
The authors express their gratitude to the managements of the Kuwait Institute for Scientific Research (KISR) and the Malaysian Palm Oil Board for their financial support and encouragement to execute this research. We also thank the Carotino Company, Malaysia, for supplying the RPOL and RPS samples, and the Kuwait Flour Mills and Bakeries Co. for providing flour and wheat bran samples, free of charge.
Related Research Data
References
- Chandrasekharan , N. 1999 . Changing concepts in lipid nutrition in health and disease . Med. J. Malaysia , 54 : 408 – 428 . [PUBMED] [INFOTRIEVE] [CSA]
- Scrimshaw , N.S. 1998 . Energy requirements and the role of fat, protein and carbohydrates as energy sources . Lipid Technol. , 10 : 105 – 110 .
- Van Twisk , P. and Du Plessis , L.M. 1997 . Industrial frying oil: basic aspects . Palm Oil Technical Bulletin , 3 ( 1 ) : 2 – 5 .
- Chandrasekharan , N. and Basiron , Y. 2001 . Changing perceptions on the role of saturated fats in human nutrition . Palm Oil Developments , 34 : 14 – 21 .
- Ping , B.T.Y. and May , C.Y. 2000 . Valuable phytonutrients in commercial red palm olein . Palm Oil Developments , 32 : 20 – 25 .
- Idris , N.A. 2001 . Palm oil based shortenings in bakery products . Palm Oil Technical Bulletin , 7 ( 3 ) : 2 – 6 .
- Wade , P. 1988 . “ Preparation of biscuit dough ” . In Biscuits, Cookies and Crackers 18 – 53 . London, , UK : Elsevier Applied Science . Vol. I
- Mensink , R.P. and Katan , M.B. 1990 . Effect of dietary trans fatty acids on HDL and LDL cholesterol . New Eng. J. Med. , 323 : 349 – 445 .
- AACC. 1990 . “ Approved Methods ” . In American Association of Cereal Chemists St. Paul, Minnesota, , USA Methods 10–10B, 10–50D
- Al-Hooti , S.N. , Sidhu , J.S. and Al-Saqer , J.M. 2002 . Enrichment of Selected Foods with Red Palm Olein 28 – 35 . Kuwait : Kuwait Institute for Scientific Research . Report No. 6185