Abstract
The state diagram of date flesh was developed by measuring its freezing points, glass transition temperatures, maximal-freeze-concentration condition ( and
), and solute melting points (or decomposition temperature) by Differential Scanning Calorimetry (DSC). The freezing curve and glass transition lines were developed using Clausius-Clapeyron equation by incorporating concept of unfrozen water, and Gordon-Taylor equation, respectively. The developed state diagram of date flesh can be used in determining its stability during storage as a function of temperature and moisture content (such as, frozen and dried conditions) as well as in designing drying and freezing processes.
Introduction
State diagram is the map of the different states of a food as a function of water or solids content and temperature. The main advantage of drawing map is in identifying different states of a food, such as freezing point and glass transition, which helps in understanding the complex changes when food's water content and temperature are changed. It also assists in identifying food's stability during storage as well as selecting a suitable condition of temperature and moisture content for processing. The different components of a state diagram, such as freezing curve, glass line, maximal-freeze-concentration conditions are discussed as follows. The equilibrium or initial freezing point is one of the most important thermodynamic properties of a frozen food required for the prediction of thermal and physical properties because of the discontinuity exhibited at that point. Accurate freezing point data can also be used to calculate or determine the other properties such as effective molecular weight, water activity, bound, free, and frozen water, enthalpy below freezing, and construction of state diagram.Citation1 Knowledge of freezing point is important for the analysis of freezing and thawing processes. Freezing point data can be used to ascertain chemical purity whether a sample differs from a natural or desired condition, i.e., detecting milk adulterated with water.Citation1 Freezing point is also needed to estimate the freezing time using Plank's or similar form of equation. Recently there is an attention to other structural properties, such as glass transition, end point of freezing, maximal-freeze-concentration condition, solute melting point (or decomposition temperature), structural changes, and fraction of unfrozen water in foods due to its wide importance and applications in the food processing (i.e., freezing and drying) and food's stability during storage as a function of temperature and moisture content.Citation2 Citation3 Citation4 Thus it is important to measure and model these properties.
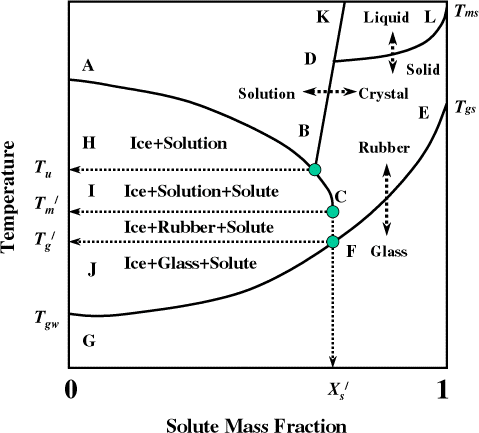
Melting point of solute is important to know when food goes thru a higher temperature during processing, such as baking, frying, and extrusion cooking. In the literature there is very negligible information available for the melting or crystallization of solute(s) in foods. When multiple solutes present in a mixture like food, multiple melting points (if individual solutes do not interact) or single melting point (if all solutes interact and act as a single solute) or decomposition temperature (if individual solutes are involved in chemical reactions and forming other compounds) may present. The terminology used in the glass transition concept is discussed as follows. Glass transition is a nature of second-order time-temperature-moisture dependent transition, which is generally characterized by a discontinuity in physical, mechanical, electrical, thermal, and other properties of a material. In case of complex multi-component mixture, such as foods the discontinuity occurs with in a range of temperature. Glasses are not crystalline with a regular structure, but retain the disorder of the liquid or amorphous state. In kinetic terms, glass temperature is defined as the temperature at which the viscosity of a material reaches 1013–1014 Pa s and the molecular diffusion rate is in the orders of years. Usually in case of foods the modulus reached to 108–1010 Pa. The state diagram is commonly used to identify different state boundaries in a material. In the state diagram in Fig. , the freezing line (ABC) and solubility line (BDK) are shown in relation to the glass transition line (EFG). The point F (,
) lower than
(point C) is a characteristic transition (maximal-freeze-concentration condition) in the state diagram. The water content at point F or C is the unfreezable water (1−
). Unfreezable water mass fraction is the amount of water remaining unfrozen even at very low temperature. In the region AHB, the phases present are ice and solution. Below point B, first crystallization of solute occurs, thus HBCI region transforms to three states; ice, solution, and solute crystal. Water having the ability to form ice does not exist right side of point C (
, end point of freezing with maximal-freeze-concentration condition) and then the solution is transformed to rubber state. The maximal-freeze-concentration condition could be achieved using slow cooling and/or annealing of the samples, which allows the complete (i.e., maximum) formation of ice. The region ICFJ contains ice, rubber, and solute crystal. The point F is the
, below this point rubber state is transformed to glass state, thus region JFG contains glass, ice, and solute crystal.
Figure 1.
State diagram for solution. AB: freezing curve, BDL: solubility curve, B: eutectic point, EFG: glass transition line, JF: glass transition by slow or equilibrium cooling, T
gs
: glass transition temperature of solids, T
gw
: glass transition of water, : end point of freezing for maximal-freeze-concentration condition,
: glass transition for maximal-freeze-concentration condition,
: solids mass fraction at maximal-freeze-concentration condition, T
u
: eutectic point (solutes crystallization), LD: or decomposition temperature line.
The most common method used to determine glass transition is the differential scanning calorimetry (DSC) that detects the change in heat capacity occurring over the transition temperature range. Other useful and some times more sensitive methods include thermomechanical analysis (TMA), dynamic mechanical analysis (DMA), and dynamic mechanical thermal analysis (DMTA).Citation3
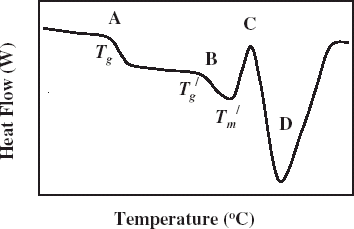
Citation4 Differential scanning calorimetry is widely used to identify the characteristic changes in the state diagram. The DSC thermogram for the samples having solids content right side of F is relatively simple. In this case the samples do not form ice during cooling, the value is a glass-rubber transition T
g
. A DSC thermogram in case of food samples containing ice is shown in Fig. and different changes of states are marked on the diagram.Citation5 The melting of ice endotherm is shown as D, two transitions as A and B, and an overshoot as C. The shift A is the glass transition of the branched chains (or more mobile) of polymer, and B is the glass transition before melting endotherm (, point F and
, point C in Fig. ) is the characteristic glass transition (i.e., when ice is formed during cooling process) at the end of freeze concentration. The transition B is due to the backbone of a large polymer or less mobile component. The two transitions were also observed in samples containing two solutes.Citation6 Other proposed concept for solution with single solute is: it is the result of formation of a solute-crystal-rich, un-equilibrated phase trapped around or within the rapidly nucleated ice crystals, and/or solute inclusion within the ice crystals itself.Citation7 The exothermic overshoot as shown as C could be due to enthalpic relaxation for differences in free volume of glass/ice during freezing or freezing of trapped water or trapped solute in the matrix. This phenomenon can be avoided by isothermal holding (annealing). Standard procedure for using DSC to measure
and
has not been developed. The reported procedures differ in cooling rate, warming rate, holding times-temperatures, annealing conditions, and sample size.Citation8 These parameters can affect the degree to which end point of freeze-concentration is attained. Usually the annealing time and temperature as well as the cooling rate need to be optimized in order to determine
and
. Annealing appeared to be less critical for simple systems than for complex systems and for those samples with limited solubility. Optimum annealing conditions are required for accurate measurement of the maximal-freeze-concentration condition.
Figure 2.
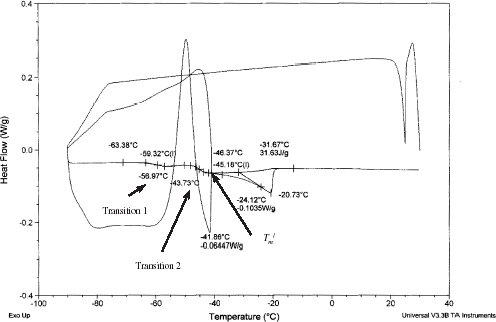
DSC thermogram showing transition 1 (marked A), transition 2 (marked B), exothermic overshoot (marked C), melting of ice (marked D), apparent and
end point of freezing condition.
In the literature, glass transitions of pure components are more commonly reported than the real foods, which are complex multi-components mixtures. The glass transition temperatures of freeze-dried strawberryCitation9 and cabbageCitation10 were measured as a function of moisture content. State diagram of apple slices was developed by measuring glass transitions, freezing curves, and maximal-freeze-concentration condition with DSC method.Citation5 Similarly the state diagram of dates was developed by measuring glass transitions of samples containing unfrozen water with dynamic oscillation method, and freezing points by cooling curve method.Citation11 It is not easy to use the rheological methods below unfrozen water content due to the complexity of the physico-chemical process for water and solute crystallization, glass transition, and exothermic peak. Moreover, it is not simple to determine the maximal-freeze-concentration conditions from rheological measurement. Thus DSC studies were targeted for thorough studies of the complex process, which could provide a fundamental physics of the different states in date flesh.
The objective of this study was to develop the state diagram of dates by measuring glass line, freezing curve, solute melting points (or decomposition temperature), and maximal-freeze-concentration condition ( and
) by DSC method. More emphasis was given on the optimum cooling rate and annealing time.
Materials and Methods
Materials
Mature dates of Khalas variety were harvested in September from the date trees grown at the Agricultural Experiment Station of the Sultan Qaboos University and were stored at −40°C until used. The stored sample was thawed at room temperature before experimental use. The moisture content of the harvested dates (FS) was measured gravimetrically using an oven at 105°C for at least 18 h of drying and was found to be 28.4% (wet basis). The average length of the major and minor axis of mature dates was 35 ± 1, 18 ± 1, and 14 ± 0.8 mm, respectively. Dimensions were measured with a caliper. Average mass of the fruit was 8.5 ± 0.5 g. Pitted dates (cut into half in longitudinal direction) were stored in air-sealed glass jars that had reached equilibrium relative humidity with supersaturated salt solutions. The temperature of equilibration and duration were 20°C and 4 weeks, respectively. The salts used to prepare solution were: LiCl, CH3COOK, MgCl2, K2CO3, Mg(NO3)2, NaBr, SrCl2, KCl, and K2SO4. The water activity of the samples could be varied from 0.113 (mass fraction of water, X w : 0.138) to 0.985 (X w : 0.586) using the above salts and the equilibrated samples were identified as SE. A 5 mL beaker containing thymol was placed inside the jars of higher water activity to prevent mold growth during storage. Moisture content in the other samples (RS) was maintained at that level by drying the date flesh in convection drier at 80°C (for samples moisture content at and above 0.068) or 105°C (for sample moisture content below 0.068) or by adding predetermined water and mixing thoroughly. Commercial dried dates (CP) were collected from the local date processing factory as brand name Tomoor Al-Wadi (Nizwa).
Differential Scanning Calorimetry
The freezing point, solute melting point (or decomposition temperature), and glass transition of date samples at different moisture content were measured by differential scanning calorimetry (DSC Q10, TA Instruments, New Castle, Delware). Mechanical refrigerated cooling system was used to cool the sample up to −90°C. The instrument was calibrated for heat flow and temperature using n-hexane (m.p. −94°C; ΔH m = 151 J/g), distilled water (m.p. 0°C; ΔH m = 334 J/g), and indium (m.p. 156.5°C; ΔH m = 28.5 J/g). Aluminum pan of 30 µL, which could be sealed with lid were used in all experiments with an empty sealed pan as reference. Nitrogen at a flow rate of 50 mL/min was used as a carrier gas.
Glass Transition of Samples Containing Unfreezable Water
Cut samples of 10–20 mg from the harvested and equilibrated or dried date flesh placed in a sealed aluminum pan were cooled to −90°C at 5°C/min, and equilibrated for 10 min. After equilibration it was scanned from −90 to 60°C at a rate of 5 or 1°C/min with 0–1 h annealing at −38°C. Each thermogram was analyzed for the onset, mid, and end of glass transition. The average values of 3–9 replicates were obtained. Standard deviation was used to identify the variability or error in the experimental measurements in the case of freezing point, solute melting point, and glass transition temperature.
Glass Transition and Freeing Point of Samples Containing Freezable Water
Glass transition and ice formation in samples containing freezable water is more complicated process and appropriate procedure must follow for these samples. Cut samples of 10–20 mg (moisture content, : 0.389 to 0.780) from the date flesh placed in a sealed aluminum pan were cooled to −90°C at 5°C/min, and equilibrated for 10 min. It was then scanned initially from −90 to 40°C in order to initial assessment of the thermogram and to locate T
g
, and end point of freezing (i.e., apparent
). In the literature it was mentioned that annealing is necessary in order to achieve maximal-freeze-concentration condition (i.e., real
and
) and eliminate the exothermic peak if present. In these experiments annealing time was varied from 0 to 1 h at
− 1 and optimum-annealing time was considered when melting thermogram showed no significant variation. The procedure was as follows: sample was cooled to −90°C at 5°C/min, heated at 5°C/min to
− 1, annealed from 0 to 1 h at
− 1, cooled at 5°C/min to −90°C, and scanned from −90°C at 5, 1, or 0.5°C/min to 40 or 60°C in order to determine actual
and
. This procedure was similar to RoosCitation12 and Bai et al.Citation5 In the cases of very concentrated samples the exothermic peak after glass transition could be avoided, but it was difficult to separate second glass transition from the melting endothermic peak. In this case scanning was done at optimum-cooling rate determined as 0.5 or 1°C/min.
The freezing point could be considered as the temperature at endothermic peak or at the point of maximum slope of the endothermic peak. In these experiments both exothermic peak and maximum slope were presented as initial or equilibrium freezing point. The latent heat of ice melting or freezing was estimated from the area of the melting endotherm. The average values of 3–5 replicates were obtained.
Solute Melting Point
Cut samples of 10–20 mg from date flesh placed in a sealed aluminum pan. Sealed sample was then cooled to −20°C at 5°C/min, and equilibrated for 10 min, then scanned from −20 to 220°C at a rate of 5°C/min. For completely dried sample problem of leakage or moisture loss during heating was absent. In case of wet samples it is difficult to achieve leak proof when heated especially above 100°C due to creation of high pressure inside the pan. In this case, drops of araldite were used to join the pan sealing in order to avoid leakage. The pan was left for overnight to solidify araldite. Separate experiment with araldite alone showed that it started to soften above 160°C, thus there was no confirmation of the leak proof above that temperature. Each thermogram was analyzed for the peak as solute melting point (or decomposition) from endotherm(s) and change in enthalpy was estimated from the area.
Results and Discussion
Glass Transition of Samples Containing Unfreezable Water
The glass transition temperature was determined from the DSC heat flow curves as shown in Fig. . Similar thermograms were also observed by Bai et al.Citation5 in case of apple containing unfreezable water. The onset T
gi
and final T
ge
points of transitions were obtained by extrapolating the side and base lines. All thermograms for samples at and below moisture content 0.325 (: 0.675) showed only one transition and no formation of ice from water. Table shows the effect of cooling rate and annealing time on the glass transition temperatures. In case of samples containing 0.325 moisture content (
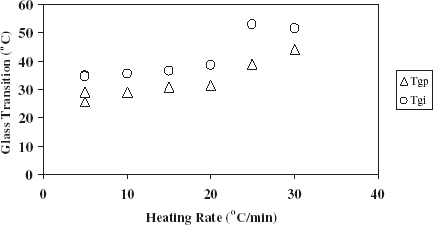
: 0.675) annealing time of 0–1 h and cooling rate 1 or 5°C affect the transition (p < 0.05). The maximum variation was observed as 2.3°C, thus glass transition of the samples containing unfreezable water were determined at a heating rate 5°C/min without annealing, and presented in the Table . In the literature it is most common to use scanning rate at 5°C/min for measuring the glass transition of foods. As expected glass transition temperature increased with the increasing solids content as shown in Table .
Table 1
Effect of annealing time and cooling rate on the glass transition temperature of the equilibrated samples containing unfrozen water content ( : 0.675 and a
w
: 0.755)
: 0.675 and a
w
: 0.755)
Table 2 Glass transition temperature above unfrozen water content when there is no formation of ice (without annealing and cooling rate 5°C/min)
Figure 3.
DSC thermogram of date sample containing unfrozen water ( is 0.325).
The glass transition temperature of foods and biological materials is commonly modeled by the following equation proposed by Gordon and TaylorCitation13:
Figure 4.
Effect of heating rate on the glass transition ( is 0.186).
Glass Transition of Samples Containing Freezable Water
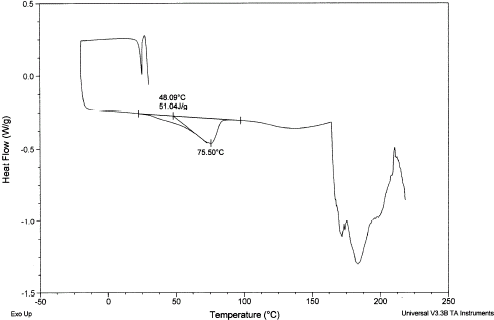
A typical DSC thermogram of sample having moisture content at 0.498 (: 0.502) is shown in Fig. without annealing. It shows freezing exotherm during cooling (F in Fig. ), glass transitions 1 (A in Fig. ) and 2 (B in Fig. ), and melting endotherm (D in Fig. ). The initial point of ice melting (i.e., end point of freezing) in the Fig. is identified as apparent
(initial point of melting) and
(initial point of glass transition B). Optimum annealing condition was obtained when the sample is held at
− 1 for a considerable period of time, allowing a maximum amount of ice to be formed, and leading to a maximally concentrated solid matrix of moisture content equivalent to
. The optimum annealing condition and cooling rate are shown in Table . A DSC thermogram of annealed sample is shown in Fig. . The difference between end point of freezing (apparent
and
) and maximal-freeze-concentration condition (actual
and
) could be understand in Fig. when cooling curve is plotted as a function of cooling rate. Sample starts cooling from point a, and b is the initial freezing point. Curve bc is the slowest possible cooling conditions. This slowest cooling rate can be achieved by controlling the cooling rate as well as applying annealing process. Curve bf is the fastest cooling rate showing no nucleation of ice. Samples containing moisture content within 0.498 and 0.611 (
: 0.502 and 0.389) showed similar DSC thermograms as Fig. .
Figure 5.
DSC thermogram of sample containing freezable water ( is 0.498).
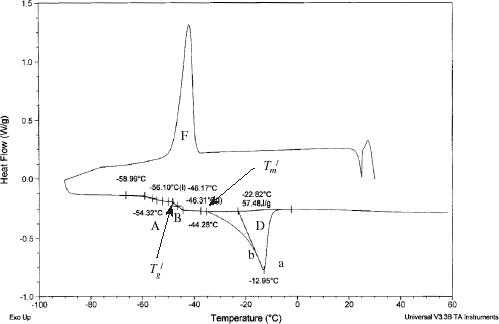
Figure 6.
DSC thermogram of 30 min annealed sample at − 1 (
is 0.498 and cooling rate 5°C/min).
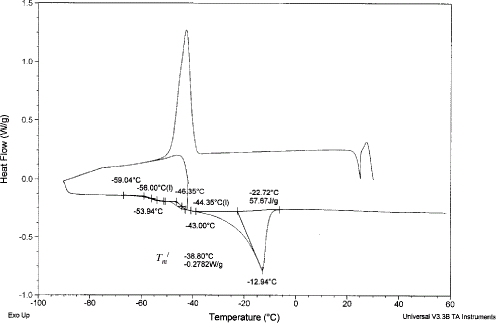
Table 3 Freezing point and glass transition of date flesh as a function of moisture content
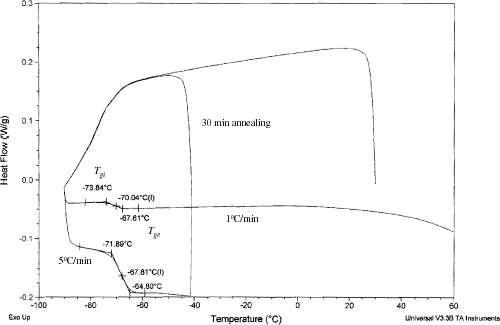
A typical DSC thermogram of sample having moisture content below 0.389 (: 0.611) is shown in Fig. . In this case, freeze-concentration of the sample results in a temperature-dependent equilibrium between the ice crystals and the unfrozen solution surrounding them. At sufficiently low temperature, this freeze-concentrated unfrozen phase reaches sufficient viscosity to become glassy. In this case, the thermogram became more complicated by showing no freezing exotherm during cooling, and showing overshoot or exotherm (C in Figs. and ), ice melting enotherm (D in Figs. and ). It is difficult to identify the glass transition in this case. Figure showing annealing at
− 1 can eliminate the exothermic peak, and shows two glass transitions, one condensed with the ice melting endotherm D (Fig. ). The two glass transitions can be clearly separated by using optimum annealing time, as well as reducing the cooling rate further. In this condition, transitions 1 and 2, as well as maximal-freeze-concentration condition (
and
) can be determined (Fig. ). The exothermic peak was also observed in case of sucrose solution without annealing,Citation17 for beef muscle, and egg white (Simatos et al.Citation18). In case of egg white, Simatos et al.Citation18 also observed two glass transitions one at −85°C and another at −46°C. However, they did not present the explanation of the two transitions. They were more concerned on characterizing the types of bound water. Table shows the glass transitions 1 and 2, freezing point, enthalpy change of sample during ice melting, and maximal-freeze-concentration condition (
and
). Goff et al.Citation7 also observed freeze-concentrated sucrose solutions had two glass-like transitions. The glass transition-like nature of transition 1 may have resulted from the formation of a sucrose-rich, un-equilibrated phase trapped around or within the rapidly nucleated ice crystals, and/or solute inclusion within the ice crystals themselves. Such a phase may arise from concentration gradient and limited diffusion at the crystal interface. This phase relaxed at a higher temperature than did the bulk unfrozen phase, resulting in the two-step glass transition. When this phase disappeared from maturation or perfection of ice crystals or equilibration of the unfrozen phase (up to 5 weeks), then the transitions seen in heat flow curve lost its glass transition like characters.Citation7 In case of date flesh with 1°C/min and 0.5 h annealing was unable to remove the transition 1. Further, experiments need to be targeted with much more equilibration and/or two cycles cooling-heating instead of only one cycle. The solute melting point (i.e., eutectic) was missing in the thermogram during heating. To the best of author's knowledge, in the literature the eutectic point was also missing from the thermogram. It was not clear why this could not be traced even for pure components. This also needs further investigation. The freezing points based on endothermic peak (point a in Fig. ) and maximum slope of endothermic peak (as point b in Fig. ) are presented in Table . It is more reasonable to consider maximum peak of the endothermic peak as the initial or equilibrium freezing point and used for model development and state diagram. Similarly the maximum peak was considered as the initial or equilibrium freezing point for foods when DSC was used.Citation19
Citation20
Figure 7. Freezing curve as a function of cooling rate.
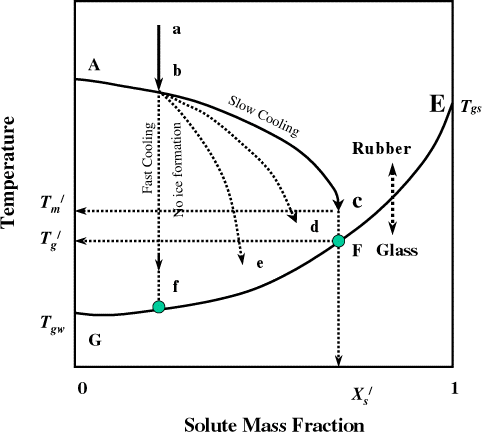
Figure 8.
DSC thermogram of sample of is 0.389.
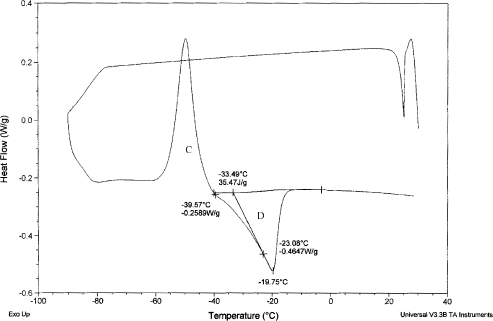
Figure 9.
DSC thermogram of 30 min annealed sample indicating elimination of exothermic peak or overshoot ( is 0.389 and heating rate 5°C/min).
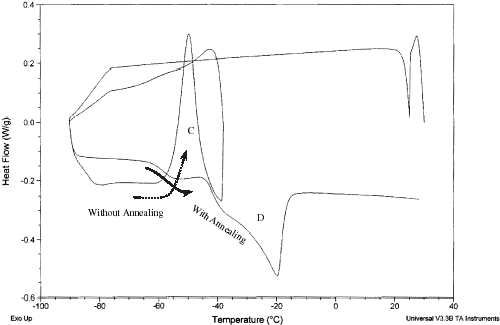
Figure 10.
DSC thermogram of 30 min annealed sample at − 1 and heating rate 1°C/min showing the clear separation of transitions 1 and 2.
The theoretical Clausius-Clapeyron equation was used to estimate the freezing point of dates, and the equation can be written as:
The model parameters E and B were estimated using SAS nonlinear regressionCitation22 and found to be 0.129 and 0.053 (in wet basis, unfreezable water, = 0.050; and solids content,
= 1–0.050 = 0.95), respectively. The mean square error from experimental data using Eqs. (Equation2) and (Equation3) are 5.5 and 4.6, respectively. This indicates that accurate prediction can be done using Eq. (Equation3) when considering the accuracy. However,
found 0.95 is physically unsound although mathematical accuracy in prediction of freezing point is achieved. In the case when parameters are estimated by nonlinear regression using experimental data, Eq. (Equation3) is transformed to the empirical nature although it is based on the physics. This is one of the generic problems when theoretical based model is extended to fit the experimental data.
A typical DSC thermogram showing the melting of sucrose is shown in Fig. and the melting point is 191.6°C and enthalpy is 118 kJ/kg compared to the literature values 188°C and 120 kJ/kg, respectively.Citation1 Figure shows a rugged melting endotherm of completely dried date flesh. The melting peak was at 191°C and enthalpy is 192 kJ/kg. Figure shows two endotherms when moisture was at 0.246 (: 0.754). The lower temperature one is due to the melting of sugars in date flesh and other one due to the melting (or decomposition) of high molecular weight solutes, such as pectin and cellulose as well as water evaporation. Moisture content below 0.186 showed only one endotherm at high temperature. It is difficult to confirm whether it is the solute melting point of solids or moisture evaporation, or decomposition, or all processess happening at the same temperature. Solute melting points decreased with the decrease of solids content. Further studies need to be targeted in this direction.
Figure 11. DSC thermogram showing melting of sugar.
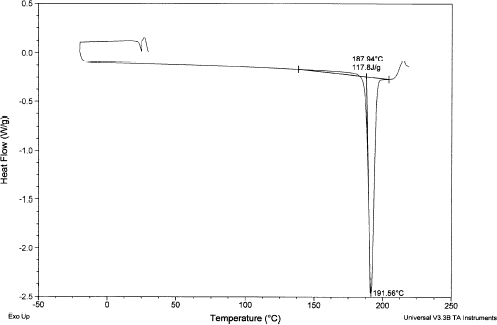
Figure 12. DSC thermogram showing melting of completely dried date flesh.
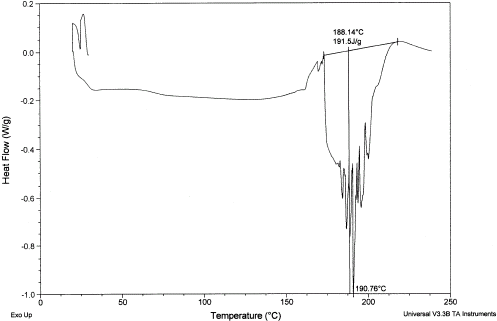
Figure 13.
DSC thermogram showing melting of sugar and melting of other solutes at higher temperature for dates at is 0.246.
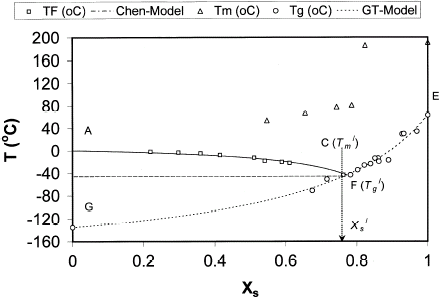
The values of are shown in Table as a function of solids content and found that it decreases with the increase of solids content. Actual
and
are considered (lowest values with scan for sample having low moisture with freezing water) as the −43.6 and −46.4°C, respectively. Kasapis et al.Citation11 did not measure the
and determined the
by extending the cooling curve to the glass transition by maintaining the similar slope. This procedure does not give accurate estimation since it considers that
and
contain different moisture content. In reality the
and
should contain the same moisture content since there is no ice formation to the right side of
. Figure shows the state diagram of date flesh incorporating the cooling curve, glass transition curves, and maximal-freeze-concentration condition, solute melting points. Curve AC represents the equilibrium between the solution and ice formed, and it has a negative gradient showing the expected decrease in the freezing point with increasing concentration of solids. The point C is the shown as
in the Fig. . The intersection of vertical extrapolation of the point P on the glass transition curve at 0.762 (point F in Fig. ), which is the
. At this stage, no water crystallize to ice in concentrated solutes of date flesh. The water content at point F is known as the unfreezable water, which for date flesh is 0.238 (
). Table shows a trend that increase in solid content decreased the
. However, solids contents at 0.360 or lower increased significantly the values of
.
Figure 14. State diagram of dates. AC: freezing curve, EFG: glass line, and solute melting points.
Various methods have been used to predict unfrozen water content ( or
) in the maximal-freeze-concentration state. The method proposed by Levine and SladeCitation23 was based on determination of ΔH
m
for a 20% solution, which reportedly provides a fast method to determine approximately the unfrozen water content. The unfreezable water content can be calculated from the amount of ice:
Figure 15. Change of enthalpy during melting of solids as a function of moisture content.
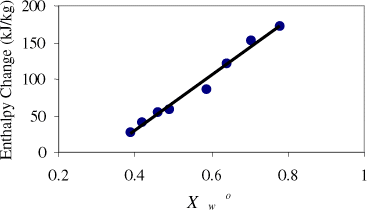
The values of can be estimated from the above equation as 0.32 when (ΔH
m
)sample is equal to zero. The values of unfrozen water content calculated from different methods are given in Table . The procedure by Eqs. (Equation4) and (Equation5) give error due to two reasonsCitation24: (i) Enthalpy of pure water (heat of fusion) is a function of temperature and this can give error up to 10% if freezing point depression is 5–10°C, (ii) Heat represented by the area under the curve is a combination of heat of fusion of ice plus sensible heat taken by freshly melted water. Table indicates that unfrozen water estimated from the ice-melting endotherm varied with the initial solution concentration. Similar variation was also observed in case of fructose,Citation25 and sucrose.Citation26 RoosCitation27 used enthalpy change of the sample as well as latent heat of ice melting to construct similar to the Fig. , and found completely different values of unfreezable water content. Ablett et al.Citation25 mentioned that calculation of unfreezable water by extending freezing line to glass temperature curve is the most reliable method. The unfreezable water content from the freezing point prediction model (Eq. (Equation3)) is not a reliable method although it gives accurate prediction for freezing point.
Table 4 Unfrozen water content by different methods
Conclusion
The freezing points of dates flesh were varied from −1.8 to −22.0°C when solids content changed from 0.22 to 0.611, respectively. Experimental data were modeled using Clausius-Clapeyron equation by incorporating the concept of unfreezable water. The model parameters E (molecular weight ratio of water and solids) and B (unfreezable water fraction) were estimated as 0.129 and 0.053, respectively. The glass transition temperatures were varied from −71.5 to 62.8°C when solids content varied from 0.675 to 1.00, respectively. The values of T
gs
and k were estimated using Gordon-Taylor equation as 63.8°C and 4.0, respectively. The values of and
(maximal-freeze-concentration) were found to be −43.6 and −46.4°C, respectively, and the unfreezable water content was found 0.238 from the state diagram.
Acknowledgment
The project was funded by Sultan Qaboos University (Internal Grants IG/AGR/FOOD/00/02 and IG/AGR/BIOR/02/03), Muscat, and His Majesty's Research Trust Fund (SR/AGR/PLNT/01/01), Sultanate of Oman. The author would like to thank Tomoor Al-Wadi, Nizwa for supplying a sample of their product.
Related Research Data
References
- Rahman , M.S. 1995 . Food Properties Handbook 87 – 177 . Boca Raton, FL : CRC Press .
- Rahman , M.S. 1999 . “ Glass transition and other structural changes in foods ” . In Handbook of Food Preservation Edited by: Rahman , M.S. 75 – 93 . New York : Marcel Dekker, Inc. .
- Roos , Y.H. , Karel , M. and Kokini , J.L. 1996 . Glass transitions in low moisture and frozen foods: effects on shelf life and quality . Food Technology , 50 ( 11 ) : 95 – 108 .
- Slade , L. and Levine , H. 1995 . “ Polymer science approach to water relationships in foods ” . In Food Preservation by Moisture Control, Fundamentals and Applications Edited by: Barbosa-Canovas , G.V. and Welti-Chanes , J. 33 – 132 . New York : Technomic Publishing .
- Bai , Y. , Rahman , M.S. , Perera , C.O. , Smith , B. and Melton , L.D. 2001 . State diagram of apple slices: glass transition and freezing curves . Food Research International , 34 : 89 – 95 . [CROSSREF]
- Morales-Diaz , A. and Kokini , J.L. 1998 . “ Understanding phase transitions and chemical complexing reactions in the 7S and 11S soy protein fractions ” . In Phase/State Transitions in Foods Edited by: Rao , M.A. and Hartel , R.W. 273 – 311 . New York : Marcel Dekker, Inc. .
- Goff , H.D. , Montoya , K. and Sahagian , M.E. 2002 . “ The effect of microstructure on the complex glass transition occurring in frozen sucrose model systems and foods ” . In Amorphous Food and Pharmaceutical Systems Edited by: Levine , H. 145 – 157 . Cambridge : The Royal Society of Chemistry .
- Brake , N.C. and Fennema , O.R. 1999 . Glass transition values of muscle tissue . Journal of Food Science , 64 : 10 – 15 .
- Roos , Y.H. 1987 . Effect of moisture on the thermal behavior of strawberries studied using differential scanning calorimetry . Journal of Food Science , 52 : 146 – 149 .
- Paakkonen , K. and Plit , L. 1991 . Equilibrium water content and the state of water in dehydrated white cabbage . Journal of Food Science , 56 : 1597 – 1599 .
- Kasapis , S. , Rahman , M.S. , Guizani , N. and Al-Aamri , M. 2000 . State diagram of temperature vs. date solids obtained from mature fruit . Journal of Agricultural Food Chemistry , 48 ( 9 ) : 3779 – 3784 . [CSA] [CROSSREF]
- Roos , Y. 1993 . Melting and glass transitions of low molecular weight carbohydrates . Carbohydrate Research , 238 : 39 – 48 . [CROSSREF]
- Gordon , M. and Taylor , J.S. 1952 . Ideal copolymers and the second order transitions of synthetic rubbers. I. Non-crystalline copolymers . Journal of Applied Chemistry , 2 : 493 – 500 .
- Johari , G.P. , Hallbrucker , A. and Mayer , E. 1987 . The glass-liquid transition of hyperquenched water . Nature , 330 : 552 – 553 . [CROSSREF]
- Roos , Y.H. 1993 . Water activity and physical state effects on amorphous food stability . Journal of Food Processing and Preservation , 16 : 433 – 447 .
- Kasapis , S. , Al-Marhoobi , I.M. and Mitchell , J.R. 2003 . Testing the validity of comparisons between the rheological and the calorimetric glass transition temperatures . Carbohydrate Research , 338 : 787 – 794 . [PUBMED] [INFOTRIEVE] [CSA] [CROSSREF]
- Monzini , A. and Maltini , E. 1983 . “ Structural modification by freezing in liquid foods ” . In Progress in Food Engineering Edited by: Cantarelli , C. and Peri , C. Switzerland : Forster Publishing .
- Simatos , D. , Faure , M. , Bonjour , E. and Couach , M. 1975 . The physical state of water at low temperature in plasma with different water contents as studied by differential thermal analysis and differential scanning calorimetry . Cryobiology , 12 : 202 – 208 . [PUBMED] [INFOTRIEVE] [CROSSREF]
- Chen , Y. and Pan , B.S. 1995 . Freezing tilapia by air blast and liquid nitrogen-freezing point and freezing rate . International Journal of Food Science and Technology , 30 : 167 – 173 . [CSA]
- Wang , D.Q. and Kolbe , E. 1991 . Thermal properties of surimi analyzed using DSC . Journal of Food Science , 56 ( 2 ) : 302 – 308 .
- Chen , C.S. 1986 . Effective molecular weight of aqueous solutions and liquid foods calculated from the freezing point depression . Journal of Food Science , 51 ( 6 ) : 1537 – 1553 .
- SAS. 2001 . The SAS System for Windows, , Version 8.02 Cary, NC : SAS Institute .
- Levine , H. and Slade , L. 1986 . A polymer physico-chemical approach to study of commercial starch hydrolysis products (SHPs) . Carbohydtate Polymers , 6 : 213 – 244 . [CROSSREF]
- Schenz , T.W. , Israel , B. and Rosolen , M.A. 1991 . “ Thermal analysis of water-containing systems ” . In Water Relationships in Food Edited by: Levine , H. and Slade , L. New York : Plenum Press .
- Ablett , S. , Izzard , M.J. , Lillford , P.J. , Arvanitoyannis , I. and Blanshard , M. 1993 . Calorimetric study of the glass transition occurring in fructose solutions . Carbohydrate Research , 246 : 13 – 22 . [CSA] [CROSSREF]
- Roos , Y. and Karel , M. 1991 . Amorphous state and delayed ice formation in sucrose solutions . International Journal of Food Science and Technology , 26 : 553 – 566 . [CSA]
- Roos , Y.H. 1986 . Phase transitions and un-freezable water content of carrots, reindeer meat and white bread studied using differential scanning calorimetry . Journal of Food Science , 51 ( 3 ) : 684 – 686 .