Abstract
The concentration and distribution of isoflavones in commonly used soybean foods were evaluated by high-performance liquid chromatography. The different forms of isoflavone glucoside esters were converted to their corresponding glucosides by a mild saponification of the extracts. Isoflavone levels were reported as microgram aglycone equivalents per gram of soy food. The total isoflavone concentrations in soymilk and tofu ranged from 76 to 199 µg/g and 162 to 312 µg/g respectively, on a wet weight basis. A comparison of isoflavone levels in soymilk and tofu, prepared by a standard procedure with the commercially available packaged soymilk and tofu samples were also carried out. Even though different types of tofu had different isoflavones concentrations, each type had similar values compared to those produced by the standard procedure.
Keywords:
Introduction
Phytoestrogens are naturally occurring phenolic compounds found in several plant-foods. Though phytoestrogens possess no nutritional properties, they have been reported to exhibit biological activity in humans and animals, similar to that of the natural human hormone estradiol.Citation[1] The main known phytoestrogens are classified into four groups according to their chemical structures, namely, isoflavones, coumestans, resorcyclic acid lactones, and lignans.Citation[1] However, the major sources of phytoestrogens in human diets are the isoflavones.
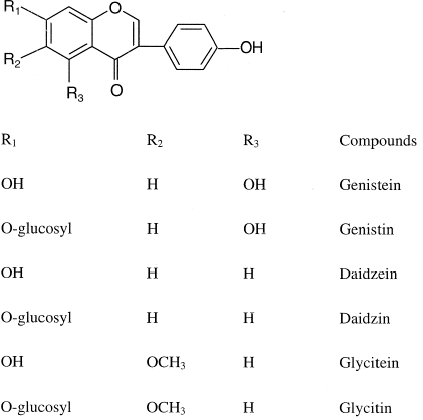
Soybeans and soy products are particularly abundant sources of isoflavones. There are three main types of isoflavones in soybeans, and each type exists in four different chemical forms, which include the aglycons and their β-glucoside conjugates: the glucosides, the acetylglucosides and the malonyl glucosides.Citation[2] Figure shows the structure of the three parent isoflavones and the respective glucosides. There is a growing literature on the health protective effects of soy foods. Epidemiological studies have suggested that the consumption of soybeans and soy foods are associated with lowered risks for several types of cancers, including breast, prostate and colon,Citation[3] Citation[4] cardiovascular diseases,Citation[5] Citation[6] and bone health.Citation[7] Citation[8] However, further long-term studies are required to understand their complex mechanisms of action. The beneficial effects of isoflavones may be due, but only in part, to the weak estrogenic activity of isoflavones.
Figure 1 Chemical structures of parent isoflavones and respective glucosides in soybean.
Soybeans have long been a staple of the human diet in Asia, especially as soymilk or tofu.Citation[9] Soymilk entered the modern era in the 1950s as it began to be marketed in bottles, largely due to the work by K. S. Lo of Vitasoy in Hong Kong and Yeo Hiap Seng in Singapore according to the Soyfoods Centre Chronology of soymilk worldwide.Citation[10] By 1967, aseptically packed Tetra Pak cartons of soymilk started appearing in the market. The first such product was Beanvit, made by Yeo Hiap Seng Ltd., in Singapore and packaged in a disposable tetrahedron-shaped container. A new wave of technology development occurred since then.
Soymilk and tofu are the most popularly consumed soy food items in South East Asia, China, and Japan. They are commonly served in food courts as well as in supermarkets and the consumption of these products continue to increase, since people are becoming more health conscious. Recently, the FDA (1999) allowed health claims to be declared on product-labels that contained a minimum of 6.25 g of soy protein per serving.Citation[11] It is this potential claim that further generated considerable interest in soy foods. There are ongoing clinical studies to explore the relationship between soy consumption and reduction in risk of many diseases.Citation12–14 It is therefore crucial to determine the qualitative and quantitative composition of isoflavones in selected soy foods commonly consumed by the multiethnic population in the region.
Materials and Methods
Materials
Soymilk was prepared on a commercial plant scale using a standard procedure. Commercially available and popular brands of soymilk were selected from the market and their isoflavone levels were compared with those in soymilk obtained by the standard procedure. Soft tofu and a firm tofu were also prepared on a plant scale. The soft tofu so prepared was “silken tofu,” while the firm tofu prepared was “taw kwa.” The different types of soft tofu commercially available in the market include “silken tofu,” “Chinese tofu,” and “organic tofu,” which were analyzed and their isoflavone levels were compared to those found in the different tofu samples obtained by the standard procedure. Firm tofu varieties collected for similar comparative studies were “taw kwa,” deep-fried tofu, and braised tofu. These products were randomly picked from the main supermarkets in Singapore.
Chemicals
Authentic standards of daidzin, genistin, glycitin, daidzein, genistein, and glycitein were purchased from LC Laboratories (Woburn, MA, USA). The HPLC grade solvents were purchased from Sigma Chemical Co. (Jefferson City, MO, USA). Linear responses were obtained for the six standards and calibration curves were plotted by using peak areas vs. corresponding phytoestrogens concentration. All solvents used were of HPLC grade.
Plant Scale Preparation of Soymilk and Tofu
Soybeans were soaked in water for 5 h at ambient temperature. Rinsing followed by grinding of soybean was carried out with a bean to water ratio of 1:5. Further steps involved were cooking, and extraction of soymilk by centrifugal separation. The raw soymilk thus obtained had an approximate soluble solids content of 9°Brix. The product was aseptically packed hot and immediately cooled in a chilling room. This was considered as the standard soymilk prepared for the study.
For the manufacturing of tofu, soymilk with a higher Brix value was prepared. This was achieved by adjusting the bean to water ratio accordingly. Raw soymilk having approximately 11°Brix was made and it was used for the preparation of soft tofu. This soymilk was aseptically packaged with Glucono-delta-lactone (GDL) and CaSO4 and allowed to coagulate in the package itself to obtain soft tofu. This was considered as the standard soft tofu preparation.
Raw soymilk with approximately 12°Brix was prepared and used for firm tofu making. This soymilk was coagulated with calcium chloride and excess whey was removed by application of pressure to obtain a standard firm tofu. The concentration of isoflavones in the prepared soymilk, soft tofu, and firm tofu were determined immediately after their preparation.
Extraction of Isoflavones from Soy Foods
The extraction procedure followed the methodolgy of Klump et al.Citation[15] modified as follows. An amount of test sample that contains approximately 1 g protein was accurately weighed into a 250 mL Erlenmeyer flask with ground-glass stopper. To this, 40 mL of the extraction solvent (80% methanol in water) was added. The flask with its contents was shaken in a 65°C water bath for 2 h, cooled to room temperature, and 3 mL of 2 M NaOH were added. They were stirred well at room temperature for 10 min and 1 mL of glacial acetic acid was added. The contents were swirled and poured into a 50 mL volumetric flask, diluted to mark with the extraction solution and mixed well. The contents were centrifuged for 10 min at 5000 rpm. An aliquot of the supernatant was filtered through a 0.45 µm polytetrafluoroethylene (PTFE) filter unit and analyzed by High Performance Liquid Chromatography (HPLC). After the extraction of isoflavones from the soy samples, they were immediately analyzed by HPLC. Storage of the extracted isoflavones for extended period of time before an analysis was never done. Standard method of moisture analysis by vacuum oven methodCitation[16] was used to determine the moisture content of all samples.
HPLC Analysis of Isoflavones
The HPLC apparatus was a Waters model 600E with inline degasser, a Waters 2996 photodiode array detector capable of monitoring UV absorbance from 200 to 350 nm and the Waters “Empower Software System” (Waters Corp., Milford, MA, USA). Reversed phase HPLC analyses of isoflavones were carried out on YMC-pack ODS-AM 303 (5 µm, 25 cm × 4.6 mm id) column (Waters Corp., Milford, MA, USA).
A linear HPLC gradient consisting of (A) 0.1% glacial acetic acid in filtered MilliQ water and (B) 0.1% glacial acetic acid in acetonitrile was used. The injection volume was 20 µL, and the components were eluted using the following solvent gradient: from 0 to 5 min 10% B and 90% A; from 5 to 50 min 10–35% B and 90–65% A; then held at 35% B and 65% A for another 10 min and re-equilibrated back to 10% B and 90% A. The flow rate was 0.8 mL/min and the UV detector wavelength was set at 260 nm. The total run time was 80 min including the equilibration of column. However, this long run time allowed a clean and clear separation of the six isoflavone conjugates good enough for quantitation. The identity and purity of isoflavones in the samples were confirmed by matching the retention times in combination with the mass spectrum analyses (LC-MS) of the standards.
Protein Assay
The protein contents of soy foods were determined by the BioRad assay.Citation[17] This was carried out in order to establish a correlation between the isoflavone concentration and protein content of the samples. A calibration curve was prepared by using a series of standard solution of bovine serum albumin. Absorbance was measured at 595 nm. The protein concentrations of samples were determined by comparison with the calibration curve.
Calculation of Isoflavone Levels in Soy Foods
The concentration of isoflavone glucosides daidzin, glycitin, and genistin were converted to aglycon equivalents using the following equation:
Statistical Analysis
Pearson's correlation coefficient (r) between the protein content and the isoflavone concentrations in soymilk samples are calculated using SPSS version 12.0 (SPSS Inc., Chicago, USA). The correlations output from SPPS software obtained for soymilk samples are shown in Table . The value of r usually ranges from −1.00 to +1.00. High positive correlation is obtained if r is closer to +1.00, which is well observed in this case. The Pearson's correlation strongly supported the research hypothesis that there is a significant positive relationship (r = 0.984) between the protein content and isoflavone concentration in soymilk samples. In a similar way, the correlation coefficient between the protein content and isoflavone concentrations in tofu samples were calculated (r = 0.942). However, braised tofu and deep-fried tofu were exempted during this calculation due to the addition of nonsoy components into them.
Results and Discussion
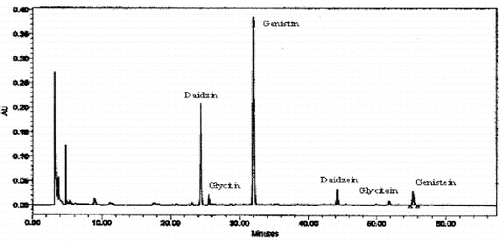
Soymilk is a colloidal solution that is obtained as a water extract from swelled and ground soybeans. It is popular among the Chinese people as a breakfast drink. The soymilks commercially available in Singapore were either imported from Australia and Malaysia or were manufactured locally. The typical HPLC chromatogram obtained for the soy samples is shown in Fig. . No published reports are available on the isoflavone content of Singapore soy foods apart from the one reported by Franke et al.Citation[13] They did a comparative study on the isoflavone levels in raw and cooked forms of “taw kwa,” raw tofu, fried “taw kwa,” dried soybean curd sticks, and soybean. Cooking was carried out for 5 min for all these soy foods except for soybean (10 min). Since there are many different types of tofu and their methods of preparation are different, the results they reported were a little confusing. For example, raw “taw kwa” and raw tofu showed nearly an equal amount of isoflavones (297 µg/g) in their study. However, it was not understood, how raw “taw kwa” differed from raw tofu and why both showed an equal amount of isoflavones. In general, cooked products showed lesser isoflavone levels than the raw products probably because of the leaching of isoflavones into the water. Though the authors compared the isoflavone levels between the same food groups from Singapore and Hawaii, they found no consistent results. In our study, we differentiated between the soft and firm tofu types available in the market and further determined the isoflavone concentrations in them. We prepared different soy foods like soymilk, soft tofu, and firm tofu on a commercial plant scale by a standard procedure. Isoflavone levels in soy foods prepared by standard procedure were compared with those in commercially available and branded soy foods of the same group. We believe our study reduces the confusion between different types of tofu and enabled the comparison of their isoflavone levels with the same food groups prepared by a standardized procedure.
Figure 2 Reversed-phase HPLC chromatogram of the six isoflavones in soy samples.
The mean isoflavone concentration levels on a wet weight basis in soymilk, soft tofu, and firm tofu prepared by the standard method, were 126.29, 167.13, and 241.35 µg/g respectively (Table ). The isoflavone concentration in soybeans used for the preparation of soy foods was 1467.23 µg/g on a dry weight basis. The isoflavone concentration in soymilks collected from supermarkets varied between 76 and 199 µg/g, on a wet weight basis (Table ). Among the different brands of soymilk analyzed, Brand E contained the highest amounts of isoflavones and Brand A had the lowest. Within the soymilk group, a higher isoflavone concentration was found in soymilks containing higher protein levels than those with lesser protein levels (Fig. ). Such trends were also noted by other workers.Citation[2] Citation18–20 The concentration of isoflavones in commercially available branded soymilks were comparable with those of the concentration of isoflavones in soymilk prepared by the standard procedure. Soymilks possessed an appreciable amount of isoflavones with regard to their protein contents. Though different manufacturers use different variety of soybean and different processing methods for soymilk manufacture, the concentration of isoflavones was high in soymilk with high protein content.
Figure 3 Correlation of protein and isoflavone levels for soymilk samples.
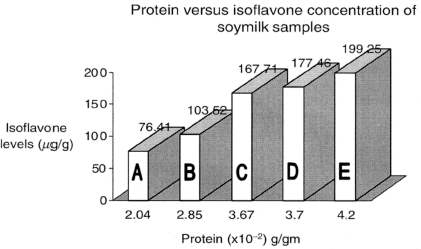
Table 1 Total isoflavone data (on wet weight basis) reported as microgram aglycon equivalents per gram of sample for soymilk, soft tofu, and firm tofu prepared by standard procedure
Table 2 Total isoflavone data (on wet weight basis) reported as microgram aglycon equivalents per gram of sample for the commercially available soymilks
For the basic tofu production, soymilk is coagulated with salts or acids (coagulants) either alone or in combination to produce a protein gel which traps water, soy lipids, and other constituents in the matrix. After addition of the coagulant to the soymilk, a curd was formed and excess whey (supernatant) may be removed depending on the type of tofu prepared. Texture (soft and firm) of tofu depends on the type of coagulant used, amount of pressure employed on the curd to expel excess whey, pressing time, and the amount of curd obtained. For example, soft or silken tofu is an aseptic tofu, where processed soymilk is aseptically packaged with GDL and allowed to coagulate in the package, while a firm tofu is obtained after an application of pressure on the coagulated soymilk to remove some of the whey from the coagulum. The higher the pressure applied, the firmer the tofu and lesser the water content. “Taw kwa” is an example of firm tofu.
Based on the methods of subsequent processing or preparation, tofu is also classified into frozen tofu, deep-fried tofu, grilled tofu, braised tofu etc. Their preparations involve either exposure to severe cold temperatures, further expulsion of water or even addition of seasoning ingredients and nonsoy components like spice powder or sweet and sour sauce. These are the many different types of tofu that have appeared in the market.
In this study, a soft variety of tofu and a firm variety of tofu were prepared on a commercial plant scale and were considered as bench-marks to compare the isoflavones of samples obtained from supermarkets in Singapore. The isoflavone concentrations in the prepared soft tofu were compared with the isoflavone concentrations in commercially available “silken,” “Chinese,” and “organic” tofu. Analysis showed that “silken,” “Chinese,” and “organic” tofu differed in their water and protein contents. Also the types of coagulants used for their preparation were different. However, the concentrations of isoflavones in these commercially available soft tofu varieties were comparable with the isoflavone levels in the soft tofu prepared by the standard procedure. The minor differences in the isoflavone concentrations could be partly due to the variety of beans used or the manner in which the tofu was prepared using different coagulants. Some coagulants might be better and more efficient than the other in terms of retaining isoflavones in tofu from soymilk.Citation[21]
In a similar fashion, the isoflavone levels in the prepared firm tofu were compared with the isoflavone levels in commercially available “taw kwa,” deep-fried, and braised tofu. Since the raw material for deep-fried and braised tofu is “taw kwa,” it was ideal to compare their isoflavone levels with the firm tofu prepared by the standard procedure. Deep-fried tofu is usually made by frying the firm tofu in oil at high temperature of 180°C. For braised tofu making, the firm tofu is marinated with a sauce (sweet or spicy), whereby the pH will be reduced and it further undergoes a pasteurization procedure. These procedures cause the isoflavone levels in braised tofu to be much lower than that of “taw kwa” and deep-fried tofu. The presence of other nonsoy components in braised tofu influence the isoflavone concentration in the total food consumed.
Our analyses showed that the protein content in firm variety of tofu was higher than that of soft variety of tofu. High concentrations of isoflavones were also present in tofu with high protein content. Thus “taw kwa” and deep-fried tofu had higher protein content and also had higher isoflavone concentrations when compared to “silken,” “Chinese,” and “organic” tofu, which had lower protein content (Table ).
Table 3 Total isoflavone data (on wet weight basis) reported as microgram aglycon equivalents per gram of sample for the commercially available tofu varieties
Table 4 Correlations output from SPSS software obtained for soymilk samples
Since isoflavones are absorbed in the body as the aglycone, the total concentration of isoflavones in food products should not be expressed as the arithmetic sum of the aglycons and glucosides.Citation[22] Therefore, the total isoflavone contents were adjusted for their molecular weight differences and expressed in aglycone equivalents to avoid erroneous conclusions. Such information will also be useful for food processors for the correct labeling of isoflavones on soy food products in the future. Display of isoflavone concentrations on the labels of soy foods would also be advantageous since it could provide additional nutritional information to the consumers. From these results, it was apparent that isoflavones were found in higher concentration in soy foods containing higher levels of protein content than those with lesser protein content.
Acknowledgment
We would like to thank Ms. Ravinder Kaur from Unicurd Food Company, Singapore for helping to carrying out the plant scale preparations of soymilk and tofu. This research was supported by a grant from The National University of Singapore R-143-000-179-112.
Related Research Data
References
- Hutabarat , L.S. , Greenfield , H. and Mulholland , M. 2001 . Isoflavones and coumestrol in soybeans and soybean products from Australia and Indonesia . Journal of Food Composition and Analysis , 14 ( 1 ) : 43 – 58 .
- Wang , H.J. and Murphy , P.A. 1994 . Isoflavone content in commercial soybean foods . Journal of Agricultural and Food Chemistry , 42 ( 8 ) : 1666 – 1673 .
- Messina , M. 1995 . Modern applications for an ancient bean: soybeans and the prevention and treatment of chronic disease . Journal of Nutrition , 125 ( 3S ) : 567S – 569S .
- Messina , M. , Barnes , S. and Setchell , K.D. 1997 . Phytoestrogens and breast cancer . Lancet , 350 ( 9083 ) : 971 – 972 .
- Anderson , J.W. , Johnstone , B.M. and Cook-Newell , M.E. 1995 . Meta analysis of the effects of soy protein intake on serum lipids . New England Journal of Medicine , 333 ( 5 ) : 276 – 282 .
- Schultz , W.B. 1998 . Food labeling: health claims; soy protein and coronary heart disease . Federal Regulations , 63 : 622977 – 623015 .
- Bahram , H.A. , Alekel , L. , Hollis , B.W. , Amin , D. , Stacewicz-Sapuntzakis , M. , Guo , P. and Kukreja , S.C. 1996 . Dietary soybean protein prevents bone loss in an ovariectomized rat model of osteoporosis . Journal of Nutrition , 126 ( 1 ) : 161 – 167 .
- Nurmi , T. , Mazur , W. , Heinonen , S. , Kokkonen , J. and Adlercreutz , H. 2002 . Isoflavone content of the soy based supplements . Journal of Pharmaceutical and Biomedical Analysis , 28 ( 1 ) : 1 – 11 .
- Liu , K. 1997 . “ Nonfermented oriental soyfoods ” . In Soybeans: Chemistry, Technology and Utilization 137 – 217 . New York : Chapman & Hall .
- Shurtleff , W. Chronology of soymilk worldwide . http://www.thesoydailyclub.com/MOSsoymilk/MOSsoymilk2.asp (accessed March 2004)
- Food and Drug Administration (FDA) . FDA Talk Paper . FDA approves new health claim for soy protein and coronary heart disease 1999 , http://fda.gov (accessed Aug 2003)
- Jakes , R.W. , Duffy , S.W. , Ng , F.C. , Gao , F. , Ng , E.H. , Seow , A. , Lee , H.P. and Yu , M.C. 2002 . Mammographic parenchymal patterns and self reported soy intake in Singapore Chinese women . Cancer Epidemiology Biomarkers & Prevention , 11 ( 7 ) : 608 – 613 .
- Franke , A.A. , Hankin , J.H. , Yu , M.C. , Maskarinec , G. , Low , S.H. and Custer , L.J. 1999 . Isoflavone levels in soy foods consumed by multiethnic populations in Singapore and Hawaii . Journal of Agricultural and Food Chemistry , 47 ( 3 ) : 977 – 986 .
- Seow , A. , Shi , C.Y. , Franke , A.A. , Hankin , J.H. , Lee , H.P. and Yu , M.C. 1998 . Isoflavonoid levels in spot urine are associated with frequency of dietary soy intake in a population-based sample of middle-aged and older Chinese in Singapore . Cancer Epidemiology Biomarkers & Prevention , 7 ( 2 ) : 135 – 140 .
- Klump , S.P. , Allred , M.C. , MacDonald , J.L. and Ballam , J.M. 2001 . Determination of isoflavones in soy and selected foods containing soy by extraction, saponification and liquid chromatography: collaborative study . Journal of AOAC International , 84 ( 6 ) : 1865 – 1883 .
- 2002 . AOAC International: Official Methods of Analysis of AOAC International, , 17th Ed. Vol. 2 , 43 – 44 . MD, , USA : Gaithersburg .
- Boyer , R. 2000 . “ General laboratory procedures ” . In Modern Experimental Biochemistry, , 3rd Ed. 43 – 45 . San Francisco, CA : Addison Wesley Longman .
- Wang , H.J. and Murphy , P.A. 1996 . Mass balance study of isoflavones during soybean processing . Journal of Agricultural and Food Chemistry , 44 ( 8 ) : 2377 – 2383 .
- Murphy , P.A. 1982 . Phytoestrogen content of processed soybean products . Food Technology , 36 : 60 – 64 .
- Coward , L. , Barnes , N.C. , Setchell , K.D.R. and Barnes , S. 1993 . Genistein, daidzein, and their beta glycoside conjugates: antitumor isoflavones in soybean foods from American and Asian diets . Journal of Agricultural and Food Chemistry , 41 ( 11 ) : 1961 – 1967 .
- Jackson , C.J.C. , Dini , J.P. , Lavandier , C. , Rupasinghe , H.P.V. , Faulkner , H. , Poysa , V. , Buzzell , D. and DeGrandis , S. 2002 . Effects of processing on the content and composition of isoflavones during the manufacturing of soy beverage and tofu . Process Biochemistry , 37 ( 10 ) : 1117 – 1123 .
- Murphy , P.A. , Song , T. , Buseman , G. , Barua , K. , Beecher , G.R. , Trainer , D. and Holden , J. 1999 . Isoflavones in retail and institutional soy foods . Journal of Agricultural and Food Chemistry , 47 ( 7 ) : 2697 – 2704 .