
Figures & data
Figure 1. Steps for the process of constructing academic trajectories.
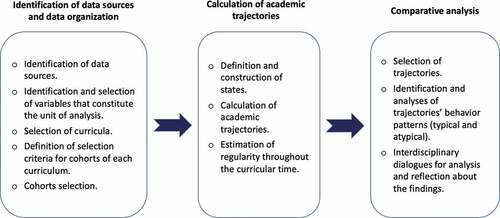
Table 1. Number of students in the MD program at UNAM Faculty of Medicine in Mexico City, by curricular cohort (n = 6,829)
Table 2. Interval labels of students’ transition states during their academic journey
Table 3. Examples of state by academic year, each row is a student of the C-1994 program
Table 4. Descriptive statistics of UNAM’s Faculty of Medicine student cohorts, by program, year, gender, age at admission, final grades, final credits and graduation rates (n = 6,829)
Figure 2. Academic progress distribution by state, C-1994 curriculum (1994, 1995, 1996, 2004 and 2005 student cohorts), UNAM Faculty of Medicine (n = 4,629).
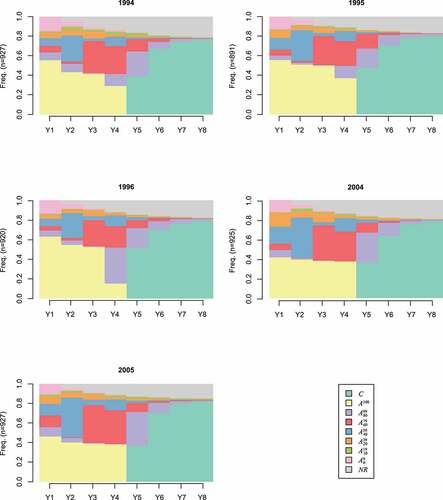
Figure 3. Academic progress distribution by state in the C-2010 program, 2011 and 2012 student cohorts, UNAM Faculty of Medicine (n = 2,200).
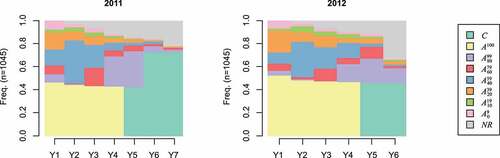
Figure 4. Timing of curricular change, UNAM Faculty of Medicine.
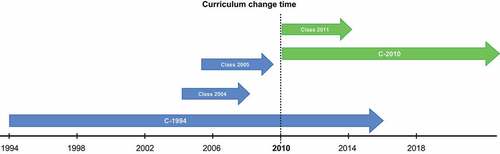
Figure 5. Comparison of student percentages in the “Regular” state () in classes 2004 (C-1994), 2005 (C-1994) and 2011 (C-2010).
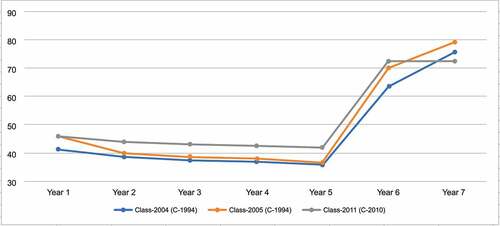
Figure 6. Comparison of the percentage of students with regular trajectory () by class and curriculum.
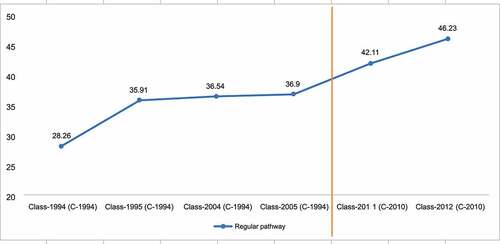
Figure A1. Curricular map of 1994 MD program.
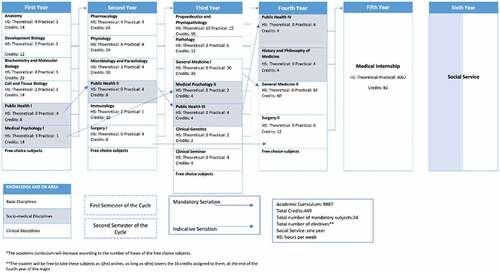
Figure A2. Curricular map of 2010 MD program.
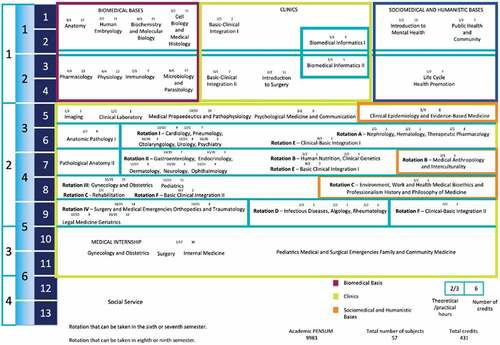
Table B1. Comparative table of the general characteristics of the 1994 MD Curriculum and the 2010 program