
 ?Mathematical formulae have been encoded as MathML and are displayed in this HTML version using MathJax in order to improve their display. Uncheck the box to turn MathJax off. This feature requires Javascript. Click on a formula to zoom.
Abstract
Graduation rates and students’ academic trajectories can be used to determine universities’ performance and their response to curricular change. Longitudinal follow-up of students’ academic performance offers “natural experiments” to explore the impact of modified curricula. The goal of this study was to propose a method for analyzing students’ academic trajectories and identify changes associated with a curricular reform. We analyzed students’ trajectories throughout the program in two curricula (1994 and 2010), at the National Autonomous University of Mexico (UNAM) Faculty of Medicine. Advancement of each student was calculated using the accumulated credits in a defined time period, and the percentage of students that completed the credits for each stage of the curriculum. The theoretical framework was the “life course” approach, applying concepts of trajectory, transition and state. R software and TraMineR algorithm were used for data analysis. Five student cohorts of the older curriculum were studied (1994, 1995, 1996, 2004 and 2005 classes), and two cohorts of the new curriculum (2011, 2012), a total population of 6829 students. Students in the newer curriculum had a faster, more timely and efficient advancement in academic pathways, than cohorts in the older one. There was a higher percentage of students with “regular” trajectory (without failed courses) in the newer curriculum. Regularity is a straightforward metric that allows identification of curricular associated changes. This method allows the identification of inflection points throughout students’ academic trajectories, and contrasts pre-post curricular change data.
PUBLIC INTEREST STATEMENT
Rates of graduation and students’ academic trajectories during their transit in the university can provide relevant information about the effects of implementing new programs. This study used an innovative method for analyzing students’ academic trajectories, and identified changes associated with a curricular reform in a large public medical school in Latin America. The advancement of each student was calculated through time for each stage of the medical curriculum. A total population of 6829 students were analyzed, composed of five student generations that had an older curriculum, and two generations with a new curriculum. Students in the newer program had a faster, more timely and efficient academic advancement, than students in the older one. There was a larger percentage of students with “regular” trajectory (without failed courses) in the newer curriculum. Regularity is a straightforward measure that can allow identification of curricular associated changes. This method allows identification of important changes throughout students’ academic lives, and helps to compare curricular change data.
1. Introduction
Terminal efficiency in higher education has been one of the main traditional indicators for universities’ accountability and is a frequently used measure for program evaluation and accreditation (Ball & Halwachi, Citation1987; Labrandero et al., Citation2021; National Research Council, Citation2012; Rodríguez, Citation1989; Saavedra & Espinoza, Citation2006; Sneyers & De Witte, Citation2017). The measurement of terminal efficiency can be done cross-sectionally or longitudinally, the first is the arithmetic ratio of the number of graduates divided by the number of students that are admitted in a specific period; the second measures terminal efficiency through life paths (Ball & Halwachi, Citation1987; Rodríguez, Citation1989; Rodríguez Ayán & Ruiz Díaz, Citation2011; Saavedra & Espinoza, Citation2006; Sneyers & De Witte, Citation2017). This parameter is an indicator used by external organizations for accreditation of higher education programs in many countries (Rodríguez Ayán & Ruiz Díaz, Citation2011; Sneyers & De Witte, Citation2017). Curriculum changes, on the other hand, are driven by institutional policies and bylaws, and are influenced by multidimensional factors (Bland et al., Citation2000; Guthrie, Citation1986). Some universities define terminal efficiency as “the relationship that exists between the number of students that are admitted to the university in a class/generation, and the number that graduate after they finish all the curriculum credits in a stipulated time” (Valle Gómez-Tagle et al., Citation2001), this form of estimation has been labeled “real cohorts” (Labrandero et al., Citation2021).
Unfortunately, terminal efficiency can hide the dynamics of students’ academic advancement during their transit through the curriculum. It makes identification of students that follow atypical paths difficult, since there are students that carry larger or smaller academic loads and their time to completion varies. Longitudinal studies, as opposed to cross-sectional estimations, offer evidence of what happens between two extreme points in a real cohort (Labrandero et al., Citation2021). Under this perspective, follow-up of students is considered a method of longitudinal analysis of academic trajectories, based on the reconstruction of the path followed by student cohorts from their entry to the end of the cycle (Rodríguez, Citation1989).
2. Curricular changes
Higher education globally faces several complex challenges, including the implementation and follow-up of curricular changes (Guthrie, Citation1986; National Research Council, Citation2012). Even though universities spend a great number of resources planning and implementing educational programs, an unresolved issue is the intricate problem of evaluating the impact of curricula in students’ academic performance (Hecker & Violato, Citation2008, Citation2009; Lockyer et al., Citation2009). It is not straightforward to identify the individual components of a major curricular change and their effects on outcome variables, teacher performance and student learning, since there are many interlinked variables that can influence them (Alves et al., Citation2013; Hecker & Violato, Citation2008).
There are few studies that explore students’ performance during and after long-term formal educational interventions in higher education, probably due to the following: curricular changes are influenced by contextual factors that create a difficult scenario for experimental research designs; university authorities may be cautious to display the results of curricular changes, particularly when those results are not positive; program modifications are the result of lengthy political processes, and when change has been implemented it is difficult to return to the previous curricular state; and finally, curricular longitudinal analyses or pre-post studies have validity threats that limit causal inferences (Albanese, Citation2000; Cook, Citation2010; Hecker & Violato, Citation2008, Citation2009; Seifert et al., Citation2010).
In the past century, there have been several major proposals for radically changing medical schools’ curricula, which have had limited success globally (Anderson, Citation2000; Christakis, Citation1995; Putnam, Citation2006). Curricular change is one of the most difficult academic, political and educational challenges of a dean or institutional governing body, since it implies a huge effort by all involved, leadership expenditure of political capital, and changes are difficult to sustain and measure (Albanese, Citation2000; Norman, Citation2003). Even though all universities undergo curricular changes continuously, publication of these experiences are usually case reports, frequently focused on descriptions of an educational model (competency based, integrated curriculum), faculty development strategies, organizational change and leadership challenges, particular aspects of teaching a specific discipline (biomedical informatics), or an individual competency (e.g., communication skills; Albanese, Citation2000; Bland et al., Citation2000; Sánchez-Mendiola et al., Citation2013).
3. Conceptual framework
The quantitative method for construction of academic trajectories and its calculation presented in this paper, is placed in the meso-level theoretical perspective (Haas & Hadjar, Citation2020). These authors, based on a thorough review of the literature, formulated a framework with macro, meso and micro levels, to conceptualize and understand the behavior of academic trajectories. The meso-level integrates actions that allow decision-making about program duration, curricular load and courses’ sequences, among other components of curricular plans. In this meso-level, the innovative category of curricular analytics can be included (Hilliger et al., Citation2019). Haas and Hadjar (Citation2020) also classify these research studies in three design types, the method used in this study is a type I research design, which corresponds to description and reconstruction of trajectories.
In the academic trajectories research field, there are several theoretical and methodological perspectives, as consequence of the increased availability of high-quality longitudinal data, related to the pathways followed by higher education students. The United States of America is the country with the largest number of studies in this field, and a smaller proportion from Australia, Canada, Italy, New Zealand, South Africa and Spain (Haas & Hadjar, Citation2020). Latin America has lived important student movements that have influenced the course of higher education in the area, for example, the University Reform of Córdoba, Argentina, and in Mexico the strikes at the National Autonomous University of Mexico (UNAM) as a response to foreign educational policies (Ordorika, Citation2021). These settings create situations where it is difficult to obtain educational trajectory data from students, which complicates follow-up of students that changed their site of residency, country or place of work.
“Life course” theory was used as the conceptual framework to analyze students’ academic trajectories in this paper. According to Elder, this theory aims to reveal the manner in which broader social forces mold the development of individual and collective life courses (Elder et al., Citation2003; G. H. Elder, Citation1999). The driving forces at the university are operationalized in changes of curricular structures and programs, and it is expected that these variations promote changes in the temporal behavior of students’ trajectories. The concepts of “trajectory”, “transition” and “state” were applied in this study. “Trajectory” refers to a life or career line that can vary and change in direction, degree or proportion (Blanco, Citation2011; Han et al., Citation2017; J. Z. G. G. H. Elder, Citation1998). “Transition” relates to the changes in state, position or situation that can be foreseeable or probabilistic (Elder et al., Citation2003; J. Z. G. G. H. Elder, Citation1998). “State” is the concept that articulates trajectories and transitions. A “state” is a situation in which the unit of analysis finds itself, in a determined moment, throughout time (Abbott, Citation2001; Abbott & Forrest, Citation1986; J. Z. G. G. H. Elder, Citation1998). In this study, the basic unit of analysis is a student throughout time, and each state is defined according to the number of credits that a student achieves after a curricular year, until the end of that educational program. The concatenation of states where a student finds herself at the end of each educational cycle determines her academic path/trajectory.
4. Academic trajectories
Academic trajectories allow calculation and analysis of indicators that explain students’ individual and group academic behavior. Traditional indicators to measure academic trajectories are academic advancement, academic performance, terminal efficiency, academic delay and dropout, regularity and failure (Sneyers & De Witte, Citation2017). Academic trajectories’ studies have increased in sophistication, evolving from a descriptive function of performance indicators (Caballero et al., Citation2011), to relational studies (Oloriz & Fernández, Citation2013; Villalobos & Gutiérrez, Citation2013) and finally to play a predictive role with the incorporation of new models (Burillo et al., Citation2011; Gonzalez, Citation2017; Haas & Hadjar, Citation2020; Musso et al., Citation2020; Trucchi et al., Citation2017). Academic trajectory studies have attempted to explain the effect of individual, academic, institutional, economic and cultural variables that intervene in academic behavior (Haas & Hadjar, Citation2020; Mellado et al., Citation2017). These studies contribute to more rational decision-making, to improve formative processes and academic administration (Opazo & Villalobos, Citation2012; Villegas et al., Citation2017). Academic trajectory studies have achieved relevance in higher education institutions and are an important input in the design of institutional policy planning (Opazo & Villalobos, Citation2012; Villegas et al., Citation2017). Another relevant aspect is the fact that students’ situations are dynamic or can occur in different degrees, which creates an analytical challenge (Castro et al., Citation2016).
In the last decade, several innovative techniques to explore students’ academic trajectories during training have been published, that add a broader perspective to program evaluation and the impact of curricular changes (Chan et al., Citation2018; Ellaway et al., Citation2019). Curricular analytics is particularly relevant, since educational programs are by definition complex adaptive systems that occur in a fixed normative framework and identified time periods (Jorm & Roberts, Citation2018; Komenda et al., Citation2015; Mennin, Citation2010; Popoola et al., Citation2018). The main goal of this study is to present a method to measure differential students’ academic pathways in several cohorts, before and after a major curricular reform.
5. Methods
5.1. Research design
Longitudinal quantitative research design, with quasi-experimental pre-post analysis comparing real cohorts of students’ academic trajectories, before and after a major curricular change.
5.2. Overview of the process for developing students’ academic trajectories
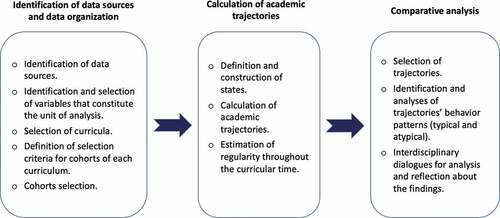
shows an overview of the method used to identify and measure students’ academic trajectories, considering the curriculum and the corresponding cohorts. The identification and selection of variables that contribute to the unit of analysis help the decisions of which curricula, cohorts, context and temporality will be studied. This step allows the selection of curricular programs and student cohorts, related to its temporal proximity to the curricular change. Calculation of trajectories is grounded in the idea of Markov chains, a discrete stochastic process that recognizes the location of the unit of analysis, each student in a given state, which corresponds to the number of credits covered in a time period. The concatenation of states through which the student moves allows the construction of the academic trajectories or pathways. The recognition and contrast of these patterns with the ideal trajectory (regularity), allow the visualization of multiple trajectories in comparison with each other and the ideal. Common trajectories and atypical ones should be analyzed from the perspectives of the stakeholders involved in curricular design and evaluation, where an interdisciplinary dialogue can help an appropriate interpretation of the trajectories’ behaviors.
Figure 1. Steps for the process of constructing academic trajectories.
5.3. Setting
The National Autonomous University of Mexico (UNAM) Faculty of Medicine in Mexico City is the largest medical school in the country and one of the largest in Latin America, with about 9,000 undergraduate students and more than 11,000 medical residents. It is a public institution and the largest producer of basic and clinical medical research in Mexico, through its affiliations with major academic medical centers (http://www.facmed.unam.mx). Mexico has more than 170 medical schools, the curricula are heterogeneous although most are six-year programs (two years of basic sciences, two years of clinical rotations, one year of clinical internship and one year of mandatory social service; Blancas & Bárcena, Citation2018; Sánchez-Mendiola et al., Citation2011). Students’ average age when entering medical school is 18 years.
5.4. Curricular change
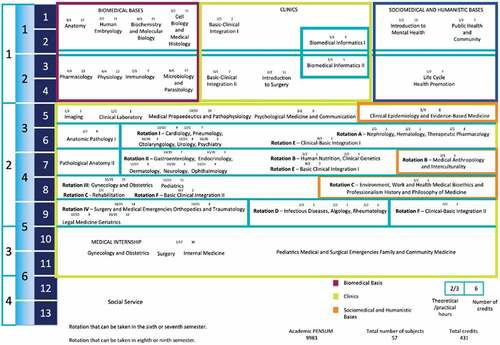
The medical school underwent a major curricular reform in the year 2010 (C-2010). The previous curriculum (C-1994) had a traditional focus based on the Flexnerian model and was in place for 16 years (1994 to 2010). Some characteristics of the C-2010 program are: definition of intermediate and outcome generic competencies; three areas of knowledge (biomedical, clinical, sociomedical/humanistic); four training phases with competency profiles; new courses (biomedical informatics, evidence-based medicine, among others); integration of the Simulation Center in the curriculum with problem-based learning methodology; core curriculum for each course (Sánchez-Mendiola et al., Citation2011). The curricular maps are in the Appendix A (Figure A1 = 1994 MD Program curricular map; Figure A2 = 2010 MD curricular map), and a comparative table of their differences in the Appendix B (Table B1, comparison of curricula).
5.5. Sample
5.5.1. Student cohorts
We analyzed seven cohorts/generations of the MD program. The first five cohorts underwent the C-1994 curriculum (1994, 1995, 1996, 2004, 2005), the last two cohorts for which data were available had the C-2010 program (2011, 2012). The students’ distribution by year is shown in . The total population including all cohorts were 6,829 students: 4,629 underwent the 1994 program and 2,200 the 2010 curriculum.
Table 1. Number of students in the MD program at UNAM Faculty of Medicine in Mexico City, by curricular cohort (n = 6,829)
5.5.2. Selection criteria
In order to have representative cohorts, we included the first three generations of the 1994 curriculum. The initial years of a new curriculum implementation are usually accompanied by a strong organizational effort and intense faculty development and supervision activities, and in parallel, there is frequently a “performance dip” due to the organization learning curve (Bland et al., Citation2000). In 1999, there was a one-year strike at the university, which had profound effects on curriculum delivery, so we included two generations after this major event (2004 and 2005), which was an uncontrolled disrupting variable that likely affected students’ academic pathways. On the other hand, 2004 and 2005 cohorts studied the 1994 curriculum a decade after its implementation, which provided information generated in a more mature curricular environment. The newer curriculum (C-2010) samples were the first two generations that completed the program of studies in the established official time, and were the ones for which complete data were available.
5.6. Measurement Methods and Statistical Analyses
Data for construction of medical students’ trajectories were obtained from academic histories, the university official data source of academic advancement in credits. These were linked to the corresponding curriculum and program of studies. A credit is the value unit of an academic course or module; a curriculum or plan of studies is the combination of courses or modules (theoretical courses, laboratories, workshops, practices), assessment results and other institutional requirements which, when finished satisfactorily, provide evidence that students finished the MD program (Universidad Nacional Autónoma de México [UNAM], Citation2018).
The program of studies and credits are two variables used to establish the students’ situation after an academic year. The behavior of the academic trajectories is identified through two indicators: Advancement/Progress and Regularity/Consistency. Advancement is the percentage of accumulated credits during the academic period, in relation to the requirements established in the formal curriculum. Regularity is the percentage of students that concluded satisfactorily the number of credits established in the curriculum for that year.
Eight different states were built to identify all the possible trajectories through which a student can transit throughout his/her academic career, following the same logic of the state we call regularity. Each state corresponds to a feasible possibility where a student can be situated after an academic year, according to the number of covered credits that are associated with each passed course during that period. For example, ideally, a student should cover in the first year all the credits that are established in the curriculum. However, there is a possibility that the student does not pass all the required courses, or that he doesn’t pass any of the courses required for that year. Under this assumption, quintiles of academic advancement were defined, plus an “absorbent state” (C) that corresponds to total credit completion.
As seen in , a student that completed 100% of the required credits for an academic cycle is labeled , a student that finished between 80% and 99% of credits is labeled
, and so forth until the student that did not complete any credits. The label “A” associated with each state, represents the advancement with relation to the number of credits that each student should cover in an academic cycle. The subscript in each A level means the percentage of covered credits, e.g., state
means that the student passed at least 80% of the required credits, but less than 100%. This indicator represents a measure of student progress in her academic trajectory (Rodríguez Ayán & Ruiz Díaz, Citation2011). States have two functions: they allow the quantitative recognition of each student’s situation after each academic cycle during their academic career; and they allow comparison of academic progress of each student with the corresponding curriculum.
Table 2. Interval labels of students’ transition states during their academic journey
5.7. Operationalization of states in the curricula
Course credits and the time used by students to complete them allow estimation of academic progress, equal to the ratio of accumulated credits divided by the time in which credits were completed. The unit of measure of a student’s academic progress is the course credit, and passing a course is equivalent to an established number of credits in the curriculum. Accumulated credits are the sum of credits equivalent to the number of courses that a student should complete in a specified time period.
Credit accumulation begins once a student is registered for the first time in the program. This condition allows comparability of accumulated progress among students registered for different curricula, since students’ starting point were homologated. Students can be accepted to the MD program but not register for any course. The idealized transition state for each academic cycle is , as established in the curriculum. The extreme states are the completion state (C) and the not registered (NR) state. A student is in the C state when she accumulates the total number of credits established in the curriculum, and a student is in the NR state when he does not register for any course that year.
shows an example of students’ representative accumulative academic progress. At the end of each academic year, the student is classified in one of the possible states. For example, in the first row the student passed all the courses and accumulated the total of year one credits, the same thing occurred in second (1995) and third (1996) years, so the student completed the credits in 1997.
Table 3. Examples of state by academic year, each row is a student of the C-1994 program
5.8. Data sources and statistical software
The main data source for the study are the academic histories of the students. The following fields were used: student label (anonymized), code for curricular program (C-1994 or C-2010), type of admission, courses, credits and time. The software used was R (https://www.r-project.org), TraMineR “STates-Sequence” (STS). This program allowed calculation and visualization of academic trajectories (Abbott & Forrest, Citation1986; Gabadinho et al., Citation2008).
5.9. Ethical aspects
The study was in compliance with the Declaration of Helsinki for research involving human subjects’ data. Data was managed anonymously in a confidential manner. The Research and Ethics Committee of UNAM Faculty of Medicine approved the research protocol as a non-invasive minimal risk study, with registration number 065/2016.
6. Results
6.1. Descriptive statistics
A total of 6,829 students were analyzed, 4,629 (67.8%) underwent the 1994 curriculum and 2,200 (32.2%) the 2010 program. shows the population descriptive statistics.
Table 4. Descriptive statistics of UNAM’s Faculty of Medicine student cohorts, by program, year, gender, age at admission, final grades, final credits and graduation rates (n = 6,829)
6.2. Transition states
The behavior of students’ academic progress for the C-1994 cohorts (1994, 1995, 1996, 2004 and 2005) is shown in .
Figure 2. Academic progress distribution by state, C-1994 curriculum (1994, 1995, 1996, 2004 and 2005 student cohorts), UNAM Faculty of Medicine (n = 4,629).
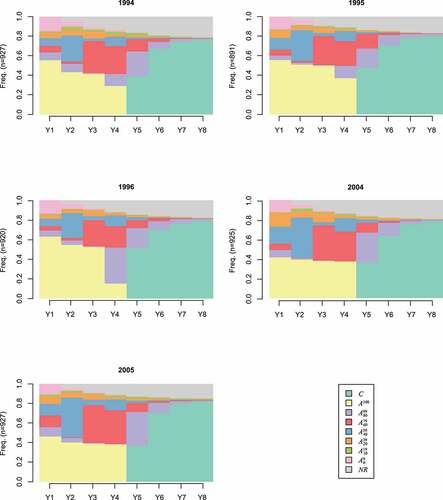
As can be seen in the advance in credits (), the 1994, 1995 and 1996 classes showed a similar behavior at the end of the first academic year. Six out of ten C-1994 students managed to finish in a timely manner 100% of the first-year credits (). Only four of ten students from the 2004 and 2005 classes in the C-1994 curriculum finished the totality of first-year credits on time. In comparison, for the 2010 curriculum five of ten students finished 100% of the first-year credits on time (). Despite the fact that in the earlier generations there was a higher regularity in the first year, in subsequent years the loss of regular students was accentuated, as can be seen in the gradual staggering of the 1994, 1995 and 1996 classes (). This could suggest that students had higher difficulties to pass the required courses.
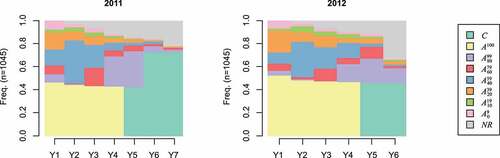
Figure 3. Academic progress distribution by state in the C-2010 program, 2011 and 2012 student cohorts, UNAM Faculty of Medicine (n = 2,200).
By the end of the second year of the program, about 20% of the student population in the 1994, 1995 and 1996 cohorts covered between 40% and 59% of their academic requirements. This pattern changes in subsequent generations, in the 2011 class about 40% managed to cover the same range of academic requirements. After years three and four of the program, the 1994, 1995 and 1996 classes that had academic delay were concentrated in the 60% to 79% academic advance range, a small recovery compared to the previous year. The atypical case of the 1996 class, where only 15% of the students were regular, is likely due to the university one-year 1999 strike. In the fifth year of the program, non-regular students were mostly concentrated in the state, the remaining states are distributed first, in students that achieved 60% of academic advance, and second, in students that were in the critical state of “not registered”.
Academic progress of students previous to 2000 with the C-1994 curriculum, showed a different behavior than the 2004 and 2005 classes with the same program. In earlier generations, there was a staggered fall in regularity as students advanced in the program, reaching its lower level by the end of the fourth year. In these generations by the end of the first year, about 60% of the students were regular and at the end of the 4th year this number ranged between 20% and 40%. In the time required to cover the program’s credits, half of the students finished in a timely fashion. In the 2004 and 2005 cohorts, regularity had a constant trend of about 40%. The student group that was regular by the end of the first year maintained that state throughout the program and graduated. In both groups of generations, a year after the program stipulated time to finish the credits, a large number of students in the state incorporated to the graduated level, and by the eighth year, 80% of the students that were admitted to the MD program graduated.
shows the student trajectories of the 2011 and 2012 cohorts that underwent the C-2010 curriculum. In these cohorts, there is a larger proportion of students that had a regular trajectory (yellow and green portion of the graphs), which was higher than those of the C-1994 curriculum cohorts. It is not possible to state that this change in pattern of trajectories’ behavior was due to the different curriculum, since curricular change is a complex and multidimensional phenomenon, but it is possible to establish metrics that allow comparison of student cohorts that undergo different programs in different times. This metric can be regularity.
In the C-2010 curriculum cohorts, the bands that represent the academic progress of 40% and 20% (delay of 60% and 80%) stand out throughout the curricular time period (). The distribution in both cohorts of C-2010 was similar. At the end of five years, the number of students that had an advance of 60% (delay of 40%) is accentuated in the 2012 cohort in the last year of studies. The percentage of students that had zero academic progress from the second year onwards is another behavior that stood out in the sixth year of the 2012 cohort, where there was a pronounced and steep progression of students that did not register any movement. In both 2011 and 2012 cohorts, the increase in students that registered zero movement is higher than any of the C-1994 cohorts.
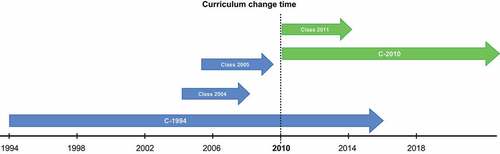
There were 16 generations that received the C-1994 curriculum, we analyzed five to compare them with two generations that received the C-2010 program. The inclusion of the 2004 and 2005 cohorts had two reasons: the seven-year observation period, which did not overlap with the change of curriculum in 2010; and the proximity to the moment of curricular change ().
Figure 4. Timing of curricular change, UNAM Faculty of Medicine.
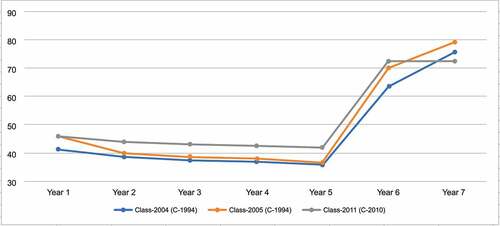
We compared the percentage of students that were in the regular state () each year for the 2004, 2005 and 2011 classes (). The 2011 class with the newer curriculum had a higher percentage of students in the regular state each year, compared with the previous generations. If we had compared these generations with the traditional terminal efficiency parameter, we wouldn’t have been able to observe these longitudinal changes, since in the 6th year the difference is minimal (2%).
Figure 5. Comparison of student percentages in the “Regular” state () in classes 2004 (C-1994), 2005 (C-1994) and 2011 (C-2010).
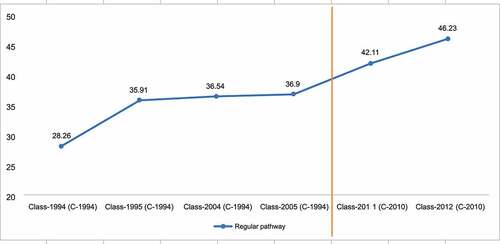
shows the percentage of students that developed a regular trajectory () throughout the program, for the 1994, 1995, 2004, 2005, 2011 and 2012 classes (the last two had the C-2010 curriculum). The percentage of students with a regular trajectory is higher in the C-2010 cohorts by about 10%. If the tendency shown in the graph is maintained, it would be expected that in a manner similar to the C-1994 curriculum, where the first generation had 28.3% of students with a regular trajectory and in the second cohort the percentage leveled off at about 36%, the C-2010 would be stabilized after the 2012 class at about 46%.
Figure 6. Comparison of the percentage of students with regular trajectory () by class and curriculum.
7. Discussion
Education scholars have published extensively about the importance of curriculum and program evaluation, as well as the different methods for measurement of student academic trajectories (Cook, Citation2010; Haas, Citation2020). The method proposed in this study provides quantitative information useful for curriculum evaluation as well as student support and follow-up, allowing longitudinal evaluation of the implementation processes and outcomes. The process described has the following steps: information organization according to curriculum type; definition of the student states and calculation of the trajectories; and comparative analysis of academic trajectories.
Evaluation models have been predominantly focused in measuring mostly curricular outcomes, but in more recent times new models of evaluation are focusing on the dynamics of the implementation process (Shinkfield, Citation2007). We selected an evaluation strategy that is theoretically grounded, to illustrate the use of the method in a higher education case study. The academic trajectories were identified and visualized, showing students’ academic advancement in two different curricula. The analysis of students’ academic pathways provided information about their states and formative transit through the programs, following their academic histories.
7.1. The curriculum change phenomenon
The measurement of outcomes generated by complex phenomena is an ever-present point of contention in higher education, since outcome data are required to support decision-making even though there are always theoretical and epistemic uncertainties in the processes (Van der Bles et al., Citation2019). Higher education can be viewed as an interlinked system of complex subsystems, where major curricular changes are frequent phenomena (Mennin, Citation2010). The measure of educational changes is a difficult task, and there is a need for objective measures to evaluate their effects in the student population. A metric is proposed, the regularity of academic progress throughout a time period, built through a process of analyzing academic trajectories. This is based on the assumption that the behavior of academic trajectories captures the results derived from curricular changes in a higher education program. Changes in a curriculum are subject to diverse forces, among its more visible components are the following: participants’ resistance to change, the assumptions and models of curriculum design, faculty development, university regulations, social context and local circumstances (Bland et al., Citation2000).
7.2. The Method to Identify Student Academic Trajectories
The method proposes as the basic unit of measurement the number of credits per course that is established by the curricular plans under study. This measurement unit allowed the building of each transition state and academic trajectory, the methodology allowed us to quantify each and every one of the students’ academic trajectories. The uncertainty involved in the correlation between alterations in academic trajectories and the curricular changes, was attenuated by the temporal proximity and the condition of mutual exclusion between programs. Temporal proximity allows the assumption that environmental conditions among the cohorts were similar, with respect to economic, technological and political factors. The condition of mutual exclusion between curricula means that the students were subjected to one and only one curriculum.
The proposed method to identify student academic trajectories requires the standardization of data in an objective fashion. This methodology does not integrate qualitative data, which are also important to achieve and maintain curricular changes, and should be object of further study (Hamui Sutton, Citation2016; Harper, Citation2007).
7.3. Variations in student academic trajectories
The trajectories of the cohorts in the older curriculum showed two patterns of regularity: in the 1994–1996 generations regularity decreases while students advance in the program, while in the newer program, the 2004 and 2005 cohorts’ regularity is constant. Evidence from several administrative changes that the university underwent in these time periods, suggests that the populations of students are similar and that the differences in academic trajectories could be attributed, at least in part, to the different curricula. In both programs about 80% of the students finished their studies by eight years after admission, although there was a 5% higher rate of regular trajectory in the C-2010 curriculum compared to the previous (C-1994) program. The structure of both plans does not allow students to advance if they do not pass a course, so they cannot catch up until they pass the required courses for that year. The first year of the program is crucial in order to have a regular trajectory from the beginning, which determines the subsequent trajectories, similar to the findings of other authors (Bruinsma & Jansen, Citation2009; Jamelske, Citation2009). The challenges and failure of many students during the first year of college evidence some of the limitations of high-school graduates in our educational system (Labrandero et al., Citation2021; Rodríguez Ayán & Ruiz Díaz, Citation2011).
The differences in academic trajectories can be due to multiple factors: the curricular integration of contents in the newer curriculum, improved students’ learning and studying techniques, faculty development initiatives, different academic practices, use of technology and simulators (De Angelis, Citation2000; Dienstag, Citation2011; Milesi, Citation2010). These activities and many others can influence academic performance in students, and these should be studied in more detail in subsequent studies. The results obtained measuring academic trajectories could be an added element for analysis with different curricular stakeholders. More research should be done about curricular changes in higher education, and the methodology described in this paper can be useful to evaluate the changes that occur in students’ academic trajectories. The results of similar studies can be included in program evaluation designs to supplement the data and information obtained with more traditional sources (Komenda et al., Citation2015).
This study has some limitations: the transit of students was analyzed in a single school in an emerging economy country, so generalization of these results should be done with caution. Individual student socioeconomic variables that can influence academic performance were not included, and there was no further follow-up after graduation. Even though the methodology theoretically can be applied to any field of knowledge, the study was done in a health professions field, so the findings have to be replicated in other areas. On the other hand, the methodology used in this study has not been reported, as far as we know, in the area of curriculum change and program evaluation, and there is a scarcity of studies evaluating major curricular changes in higher education with objective data from before and after the modification. The behavior of academic trajectories did not integrate other context variables related to the individuals, and it is not possible to declare that the differences in the cohorts are due mainly to the concurrent curricular plan, it is reasonable however, to state that there is a differentiated behavior in the levels of regularity among curricula and academic trajectories throughout time. In our context, the method presented for description and reconstruction of academic trajectories conflates the effect of multiple actions that were implemented during the curricular change periods, so it is not possible to identify the separate elements that influence change through the behavior of students’ trajectories. In subsequent studies, the method could be escalated to research designs type II or III (Haas & Hadjar, Citation2020), with the intention of identifying the predictors in the frame of curricular change.
Another aspect identified in the study is the higher rate of graduation in men from both curricular periods, which coincides with a study performed in 25 cohorts of students at UNAM Faculty of Medicine in Mexico (Campillo Labrandero et al., Citation2021). It is important to perform further studies that analyze the influences of gender in student trajectories and academic outcomes.
The method described in this paper for the quantitative construction of student academic trajectories is innovative and useful, builds on previous academic literature about this complex issue, and is feasible for any higher education institution (Haas & Hadjar, Citation2020). It is an initial step to evidence-based curricular improvement and decision-making, where the adoption of curricular analytics and curriculum data visualization needs to be promoted (Hilliger et al., Citation2020). The method allowed the analysis and comparison of longitudinal student academic trajectories in real cohorts, and showed the quantitative and visual contrasts of the data in different curricula.
Subsequent studies should incorporate the concept of latency, to provide meaning to the collection of accumulated data in the least possible time, and decrease the gap between institutional actions oriented to the improvement of the learning process and the initial data inception and capture, through the integration of analytical tools from different scientific disciplines and epistemological frameworks (Wong & Li, Citation2020). In the developing field of curricular analytics, the importance of data visualization for evidence-based decision-making cannot be overstated (Konecki et al., Citation2018).
8. Conclusions
The proposed method allows the construction of academic trajectories to analyze, separate and quantitatively synthesize the changes that occur with curricular modifications. The analysis of students’ academic pathways offers valuable information for the evaluation of curricular changes. This information is difficult to obtain with traditional cross-sectional studies. The study does not provide proof of causality regarding the educational impact of different programs, but it can be useful to complement the array of program evaluation strategies in medical education.
Availability of data and material
The datasets used in the study are available from the corresponding author on request.
Authors’ contributions
DCS, TBG, MGM, JGMS, and MSM participated in the conceptualization of the study and its design. DCS, TBG, JGMS and MGM participated in data curation, validation, statistical analysis and data visualization. All authors participated in draft and final manuscript writing and approved the final version.
Ethics approval and consent to participate
The study was in compliance with the Declaration of Helsinki for research involving human subjects’ data. Data was managed anonymously in a confidential manner. The Research and Ethics Committee of UNAM Faculty of Medicine approved the research protocol as a non-invasive minimal risk study, with registration number 065/2016.
Disclosure statement
No potential conflict of interest was reported by the author(s).
Additional information
Funding
Notes on contributors
Melchor Sánchez-Mendiola
Our group works at the National Autonomous University of Mexico (UNAM) in Mexico City, in the area of curriculum development and evaluation, faculty development, educational assessment, educational innovation and distance education. We have been studying some aspects of curricular development and evaluation in our higher education institutions, and exploring the effects of the pandemic in distance education, faculty teaching and students’ learning in several areas of knowledge. This study is part of a larger project that aims to develop methods for curriculum analytics and learning analytics in Mexico and Latin America.
References
- Abbott, A., & Forrest, J. (1986). Optimal matching methods for historical sequences. The Journal of Interdisciplinary History, 16(3), 471–20. https://doi.org/10.2307/204500
- Abbott, A. (2001). Time matters: On theory and method. University of Chicago Press.
- Akaki Blancas, J. L., & López Bárcena, J. L. (2018). Formación de médicos especialistas en México. Educación Médica, 19(S1), 36–42. https://doi.org/10.1016/j.edumed.2018.03.007
- Albanese, M. (2000). Problem-based learning: Why curricula are likely to show little effect on knowledge and clinical skills. Medical Education, 34(9), 729–738. https://doi.org/10.1046/j.1365-2923.2000.00753.x
- Alves, C. L., Belisário, S. A., Abreu, D. M. X., Lemos, J. M. C., D’Ávila, L. S., & Goulart, L. M. H. F. (2013). Curricular transformations in medical school: An exploration of the promotion of change in Brazil. Medical Education, 47(6), 617–626. https://doi.org/10.1111/medu.12154
- Anderson, M. B. (2000). A snapshot of Medical Students’ education at the beginning of the 21st century: Reports from 130 Schools. Academic Medicine, 75(9), n9. https://journals.lww.com/academicmedicine/toc/2000/09001
- Ball, R., & Halwachi, J. (1987). Performance indicators in higher education. Higher Education, 16(4), 393–405. https://doi.org/10.1007/BF00129112
- Blanco, M. (2011). El enfoque del curso de vida: Orígenes y desarrollo. Revista Latinoamericana de Población, 5(8), 5–31. https://www.redalyc.org/pdf/3238/323827304003.pdf
- Bland, C. J., Starnaman, S., Wersal, L., Moorhead-Rosenberg, L., Zonia, S., & Henry, R. (2000). Curricular change in medical schools: How to succeed. Academic Medicine, 75(6), 575–594. https://doi.org/10.1097/00001888-200006000-00006
- Bruinsma, M., & Jansen, P. W. A. (2009). When will I succeed in my first‐year diploma? Survival analysis in Dutch higher education. Higher Education Research & Development, 28(1), 99–114. https://doi.org/10.1080/07294360802444396
- Burillo, V., Arriaga, J., Carpeño, A., & Casaravilla, A. (2011). Estudio de la influencia de factores personales y de ingreso en la universidad en el abandono. Valorando el riesgo o probabilidad de abandono en la Universidad Politécnica de Madrid. Congresos CLABES.
- Caballero, L. B., Castillo, Y. B., & Álvarez, C. B. (2011). Comparación de las tasas de aprobación, reprobación, abandono y costo estudiante de dos cohortes en carreras de Licenciatura en Ingeniería en la Universidad Tecnológica de Panamá. Congresos CLABES.
- Campillo Labrandero, M., Martínez González, A., García Minjares, M., Guerrero Mora, L., & Sánchez Mendiola, M. (2021). Desempeño académico y egreso en 25 generaciones de estudiantes de la Facultad de Medicina de la UNAM. Educación Médica, 22(2), 67–72. https://doi.org/10.1016/j.edumed.2019.05.003
- Castro, S. B. E., Castillo, M. A. S., Villegas, E. B., & Estrada, D. Y. R. (2016). Deserción o interrupción en las trayectorias estudiantiles. Congresos CLABES.
- Chan, T., Sebok-Syer, S., Thoma, B., Wise, A., Sherbino, J., Pusic, M., & Promes, S. (2018). Learning analytics in medical education assessment: The past, the present, and the future. AEM Education and Training, 2(2), 178–187. https://doi.org/10.1002/aet2.10087
- Christakis, N. (1995). The similarity and frequency of proposals to reform US medical education. JAMA, 274(9), 706–711. https://doi.org/10.1001/jama.1995.03530090038019
- Cook, D. A. (2010). Twelve tips for evaluating educational programs. Medical Teacher, 32(4), 296–301. https://doi.org/10.3109/01421590903480121
- De Angelis, C. D. (2000). The Johns Hopkins University School of Medicine curriculum for the twenty-first century. JHU Press.
- Dienstag, J. L. (2011). Evolution of the new pathway curriculum at Harvard Medical School: The new integrated curriculum. Perspectives in Biology and Medicine, 54(1), 36–54. https://doi.org/10.1353/pbm.2011.0003
- Elder, G. H., Jr. (1999). Children of the great depression: Social change in life experience (25th Anniverary ed.). Westview Press.
- Elder, G. H., John son, M. K., & Crosnoe, R. (2003). The emergence and development of life course theory. In Mortimer, and Shanahan (eds.), Handbook of the life course (pp. 3–19). Kluwer Academic/Plenum Publishers, New York.
- Elder, J. Z. G. G. H. (1998). Methods of life course research: Qualitative and quantitative approaches. Sage. https://doi.org/10.4135/9781483348919
- Ellaway, R. H., Topps, D., & Pusic, M. (2019). Data, big and small: Emerging challenges to medical education scholarship. Academic Medicine, 94(1), 31–36. https://doi.org/10.1097/ACM.0000000000002465
- Gabadinho, A., Ritschard, G., Studer, M., & Müller, N. S. (2008). Mining sequence data in R with the TraMineR package: A user’s guide. Department of Econometrics and Laboratory of Demography, University of Geneva. http://mephisto.unige.ch/traminer
- Gonzalez, M. V. (2017). Estudio del abandono empleando un modelo de riesgos proporcionales. Congresos CLABES.
- Guthrie, G. (1986). Current research in developing countries: The impact of curriculum reform on teaching. Teaching and Teacher Education, 2(1), 81–89. https://doi.org/10.1016/0742-051X(86)90006-5
- Haas, C., & Hadjar, A. (2020). Students’ trajectories through higher education: A review of quantitative research. Higher Education, 79(6), 1099–1118. https://doi.org/10.1007/s10734-019-00458-5
- Hamui Sutton, A. (2016). Tensiones y reconfiguraciones de la práctica docente ante el cambio curricular en la Facultad de Medicina de la Universidad Nacional Autónoma de México. Investigación En Educación Médica, 5(20), 215–219. https://doi.org/10.1016/j.riem.2016.01.021
- Han, Y., Liefbroer, A. C., & Elzinga, C. H. (2017). Comparing methods of classifying life courses: Sequence analysis and latent class analysis. Longitudinal and Life Course Studies, 8(4), 319–341. https://doi.org/10.14301/llcs.v8i4.409
- Harper, S. R. (2007). Using qualitative methods to assess student trajectories and college impact. New Directions for Institutional Research, 2007(136), 55–68. https://doi.org/10.1002/ir.231
- Hecker, K., & Violato, C. (2008). How much do differences in medical schools influence student performance? A longitudinal study employing hierarchical linear modeling. Teaching and Learning in Medicine, 20(2), 104–113. https://doi.org/10.1080/10401330801991915
- Hecker, K., & Violato, C. (2009). Medical school curricula: Do curricular approaches affect competence in medicine. Family Medicine, 41(6), 420–426. https://pubmed.ncbi.nlm.nih.gov/19492189/
- Hilliger, I., Miranda, C., Celis, S., & Pérez-sanagustín, M. (2019). Evaluating usage of an analytics tool to support continuous curriculum improvement. CEUR Workshop Proceedings, 2437, 1–14. European Conference on Technology Enhanced Learning.
- Hilliger, I., Ortiz-Rojas, M., Pesántez-Cabrera, P., Scheihing, E., Tsai, Y. S., Muñoz-Merino, P. J., Broos, T., Whitelock-Wainwright, A., Gašević, D., and Pérez-Sanagustín, M. (2020). Towards learning analytics adoption: A mixed methods study of data-related practices and policies in Latin American universities. British Journal of Educational Technology, 51(4), 915–937. https://doi.org/10.1111/bjet.12933
- Jamelske, E. (2009). Measuring the impact of a university first-year experience program on student GPA and retention. Higher Education, 57(3), 373–391. https://doi.org/10.1007/s10734-008-9161-1
- Jorm, C., & Roberts, C. (2018). Using complexity theory to guide medical school evaluations. Academic Medicine, 93(3), 399–405. https://doi.org/10.1097/ACM.0000000000001828
- Komenda, M., Víta, M., Vaitsis, C., Schwarz, D., Pokorná, A., Zary, N., Dušek, L., & Vrana, K. E. (2015). Curriculum mapping with academic analytics in medical and healthcare education. PloS One, 10(12), e0143748. https://doi.org/10.1371/journal.pone.0143748
- Konecki, M., LaPierre, C., & Jervis, K. (2018). “Accessible data visualization in higher education,” 41st International Convention on Information and Communication Technology, Electronics and Microelectronics (MIPRO), Opatija, Croatia, pp. 0733–0737. https://doi.org/10.23919/MIPRO.2018.8400136
- Labrandero, M. C., González, A. M., Minjares, M. G., Mora, L. G., & Mendiola, M. S. (2021). Desempeño académico y egreso en 25 generaciones de estudiantes de la Facultad de Medicina de la UNAM. Educación Médica, 22(2), 67–72. https://doi.org/10.1016/j.edumed.2019.05.003
- Lockyer, J. M., Violato, C., Wright, B. J., & Fidler, H. M. (2009). An analysis of long-term outcomes of the impact of curriculum: A comparison of the three-and four-year medical school curricula. Academic Medicine, 84(10), 1342–1347. https://doi.org/10.1097/ACM.0b013e3181b6c08e
- Mellado, F. R. M., Orellana, M. B. C., & Gabrie, A. J. B. (2017). Variables y factores asociados al fenómeno de la retención y abandono estudiantil universitario en investigaciones de Latinoamérica y el Caribe. Congresos CLABES.
- Mennin, S. (2010). Self-organisation, integration and curriculum in the complex world of medical education. Medical Education, 44(1), 20–30. https://doi.org/10.1111/j.1365-2923.2009.03548.x
- Milesi, C. (2010). Do all roads lead to Rome? Effect of educational trajectories on educational transitions. Research in Social Stratification and Mobility, 28(1), 23–44. https://doi.org/10.1016/j.rssm.2009.12.002
- Musso, M. F., Hernández, C. F. R., & Cascallar, E. (2020). Predicting key educational outcomes in academic trajectories: A machine-learning approach. Higher Education, 80(5), 875–894. https://doi.org/10.1007/s10734-020-00520-7
- National Research Council. (2012). Improving measurement of productivity in higher education. The National Academies Press. https://doi.org/10.17226/13417
- Norman, G. (2003). RCT= results confounded and trivial: The perils of grand educational experiments. Medical Education, 37(7), 582–584. https://doi.org/10.1046/j.1365-2923.2003.01586.x
- Oloriz, M. G., & Fernández, J. M. (2013). Relación entre las características del estudiante al momento de iniciar estudios superiores y el abandono en la Universidad Nacional de Luján durante el período 2000-2010. Congresos CLABES.
- Opazo, P., & Villalobos, P. (2012). Probabilidad de desertar de estudiantes: 5 años de experiencia en la Universidad de Talca. Congresos CLABES. https://revistas.utp.ac.pa/index.php/clabes/article/view/1774
- Ordorika, I. (2021). Student movements and politics in Latin America: A historical reconceptualization. Higher Education. https://doi.org/10.1007/s10734-020-00656-6
- Popoola, S. I., Atayero, A. A., Badejo, J. A., John, T. M., Odukoya, J. A., & Omole, D. O. (2018). Learning analytics for smart campus: Data on academic performances of engineering undergraduates in Nigerian private university. Data in Brief, 17, 76–94. https://doi.org/10.1016/j.dib.2017.12.059
- Putnam, C. E. (2006). Reform and innovation: A repeating pattern during a half century of medical education in the USA. Medical Education, 40(3), 227–234. https://doi.org/10.1111/j.1365-2929.2006.02402.x
- Rodríguez Ayán, M. N., & Ruiz Díaz, M. Á. (2011). Indicadores de rendimiento de estudiantes universitarios: Calificaciones versus créditos acumulados. Revista de Educación, 355, 467–492. https://sede.educacion.gob.es/publiventa/indicadores-de-rendimiento-de-estudiantes-universitarios-calificaciones-versus-creditos-acumulados/investigacion-educativa/22890
- Rodríguez, R. (1989). Metodología para el análisis demográfico de la eficiencia terminal, la deserción y el rezago escolar. InFelipe Martínez Rizo (Ed.), La Trayectoria Escolar En La Educación Superior (pp. 225–280). ANUIES & SEP (PROIDES).
- Saavedra, Ó. C., & Espinoza, G. A. B. (2006). ¿Cómo estimar la eficiencia terminal en la educación superior? Notas sobre su estatuto teórico. Revista de La Educación Superior, 35(139), 1. http://publicaciones.anuies.mx/pdfs/revista/Revista139_S1A1ES.pdf
- Sánchez-Mendiola, M., Durante-Montiel, I., Morales-López, S., Lozano-Sánchez, R., Martínez-González, A., & Graue-Wiechers, E. (2011). Plan de estudios 2010 de la Facultad de Medicina de la Universidad Nacional Autónoma de México. Gaceta medica de Mexico, 147(2), 152–158. https://www.medigraphic.com/pdfs/gaceta/gm-2011/gm112k.pdf
- Sánchez-Mendiola, M., Martínez-Franco, A. I., Rosales-Vega, A., Villamar-Chulin, J., Gatica-Lara, F., García-Durán, R., & Martínez-González, A. (2013). Development and implementation of a biomedical informatics course for medical students: Challenges of a large-scale blended-learning program. Journal of the American Medical Informatics Association, 20(2), 381–387. https://doi.org/10.1136/amiajnl-2011-000796
- Seifert, T. A., Pascarella, E. T., Erkel, S. I., & Goodman, K. M. (2010). The importance of longitudinal pretest-posttest designs in estimating college impact. New Directions for Institutional Research, 2010(S2), 5–16. https://doi.org/10.1002/ir.368
- Shinkfield, A. J. (2007). Evaluation theory, models, and applications. Jossey-Bass.
- Sneyers, E., & De Witte, K. (2017). The interaction between dropout, graduation rates and quality ratings in universities. Journal of the Operational Research Society Internet].;68(4):416–430. https://doi.org/10.1057/jors.2016.15
- Trucchi, C., German, C., & Casini, R. B. (2017). Atraso medido en créditos alcanzados, y detección de factores mediante regresión logística en el marco de un nuevo plan de estudios en la Facultad de Ciencias Económicas. UNC. Congresos CLABES.
- Universidad Nacional Autónoma de México (UNAM). (2018). Reglamento General de Estudios Técnicos y Profesionales. https://www.dgae-siae.unam.mx/acerca/normatividad.html#leg-2
- Valle Gómez-Tagle, R., Argüelles, G. R., & Lozano, A. V. (2001). El análisis de las trayectorias escolares en la UNAM. Un método de análisis. Alejandra Romo y Magdalena Fresan, Deserción, Rezago y Eficiencia Terminal En Instituciones de Educación Superior, México. ANUIES.
- van der Bles, A. M., van der Linden, S., Freeman, A. L. J., Mitchell, J., Galvao, A. B., Zaval, L., & Spiegelhalter, D. J. (2019). Communicating uncertainty about facts, numbers and science. Royal Society Open Science, 6(5), 181870. https://doi.org/10.1098/rsos.181870
- Villalobos, M. O., & Gutiérrez, V. C. (2013). Relación entre los parámetros de rendimiento escolar en el bachillerato y las tasas de rezago y abandono en la licenciatura en la facultad de medicina veterinaria y zootecnia de la UNAM. Congresos CLABES.
- Villegas, E. B., Urías, J. R. R., & de Los Uribe, M. A. M. (2017). Detección Temprana De Estudiantes En Situación De Riesgo Soportado En Un Sistema De Información. Congresos CLABES.
- Wong, B. T., m., & Li, K. C. (2020). A review of learning analytics intervention in higher education (2011–2018). Journal of Computers in Education, 7(1), 7–28. https://doi.org/10.1007/s40692-019-00143-7
Appendix A
Figure A1. Curricular map of 1994 MD program.
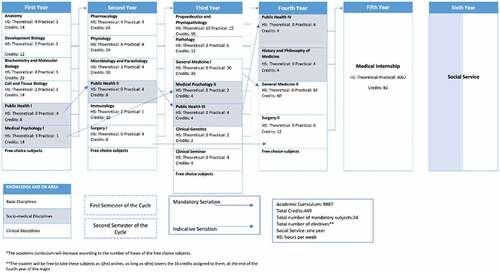
Figure A2. Curricular map of 2010 MD program.
Appendix B
Table B1. Comparative table of the general characteristics of the 1994 MD Curriculum and the 2010 program