Abstract
The stagnant effective thermal conductivities (K0) of sugar cane bagasse (SCB), wheat bran (WB), orange pulp and peel (OPP) and their combination (weight proportion 1:2:2 SCB/OPP/WB) were obtained using the line heat source method. These solid materials were applied to pectinase production via solid-state fermentation. The moisture content ranged from 4 to 80% (w.b.). A conduction mechanism through the porous media was observed, along with conduction through a liquid film and contact thermal resistance between the samples and the probe. K0 was low for intermediate moisture contents and approached the molecular conductivity of water for high moisture contents.
INTRODUCTION
Solid-state fermentation (SSF) can be defined as the growth of microorganisms on moist solid particles under conditions in which the region's voids between particles contain a continuous gas phase and minimal visible water. Although there may be thin films of water at the surface of the particles, most of the inter-particle space is filled with gas. Even under such conditions, the moisture content of the solid must be high to provide adequate conditions for microbial metabolism.[Citation1]
One of the main advantages of SSF is the possibility of using agro-industrial byproducts as substrates. Of particular interest in this article are sugar cane bagasse, orange pulp and peel and wheat bran, which have been successfully used by Martin et al.,[Citation2] Umsza-Guez,[Citation3] and Laurentino[Citation4] for the production of endo- and exo-pectinase by SSF. Sugar cane bagasse has also been applied as a substrate in several studies for cellulolytic enzyme production,[Citation5– Citation8] while wheat bran has been widely employed in SSF because it is considered an excellent substrate, properly balancing sources of carbon, nitrogen, and phosphorous.[Citation9, Citation10]
Packed beds have often been applied in SSF, although heat removal is troublesome, leading to poor options for temperature control. In some cases, such difficulty results in low productivity, product deterioration, and even microorganism death.[Citation11] Therefore, SSF packed bed simulation is a powerful tool for foreseeing hot spots and finding alternatives for avoiding them, and several mathematical models have been presented in the literature.[Citation12– Citation15] Such models require the thermal properties of the porous media, among which the stagnant thermal effective conductivity (K 0) is one of the most important.
K 0 is determined by conductivity mechanisms between the solid and fluid phases and depends on the chemical composition of the solid phase, mainly its water content, and the porous media structure.[Citation16] Few works are available in the literature regarding the K 0 of agro-industrial residues often used in SSF, mainly at high moisture contents. Suter et al.[Citation17] determined the K 0 for peanut hull using the linear probe technique and reported a value of 0.052 W/m/K for 5% moisture content (MC). However, this value may only be useful as a reference for SSF simulation because the moisture content for fermentation experiments is much higher, as in laccase production using basidiomycete Ganoderma sp., where the MC of peanut hull ranges from 40 to 80% (wet basis (w.b.)).[Citation18] Costa et al.[Citation19] determined the K 0 of rice bran, the residue employed as a substrate for SSF by Aspergillus niger to produce glucoamylase. These authors established an experimental correlation of K 0 as a function of packing density and moisture content. They reported that K 0 ranges from 0.1166 to 2.6551 W/m/K for MCs ranging from 40 to 65% and packing densities ranging from 0.5 to 1.0 kg/L.
The line heat source method has been used to determine the thermal conductivity of a wide variety of food products, such as uniform liquids and solids and porous media.[Citation20– Citation24] Fang et al.[Citation25] determined the K 0 for four different starch granules of rice for temperatures ranging from 20 to 80°C, MCs from 4 to 40% (w.b.), and bulk densities from 600 to 800 kg/mCitation3, and they reported K 0 values between 0.075 and 0.169 W/m/K. They used a surface response methodology and obtained a statistical quadratic model correlating the independent variables, concluding that K 0 increases strongly with MC. Kocabiyik et al.[Citation26] determined the K 0 of pumpkin seeds for MCs ranging from 5 to 19% (w.b.) and found a linear relationship of K 0 with MC, with K 0 ranging from 0.113 to 0.135 W/m/K. Mahapatra et al.[Citation27] tested four varieties of rice flour for temperatures ranging from 5 to 37°C, MCs from 5 to 17% (w.b.), and bulk densities from 657 to 837 kg/mCitation3. The observed K 0 values were within the range of 0.045 to 0.124 W/m/K, and linear trends of K 0 with temperature and bulk density were found, although an irregular increase with MC was observed. No investigations have been reported in the literature testing agro-industrial porous materials at very high moisture contents.
The present contribution aimed to determine the K 0 values of sugar cane bagasse, orange pulp and peel, and wheat bran, both individually and mixed, as used in some fermentation processes.[Citation2– Citation4] The line heat source method was used for a wide range of moisture contents, and correlations for K 0 as a function of the moisture content are provided for the individual materials and their mixture. The results presented here can aid in conducting more realistic simulations of packed bed bioreactors using such materials for solid-state fermentation.
Theoretical Considerations of the Line Heat Source Method
Among the available techniques for experimentally determining K 0, [Citation28] the line heat source is widely used due to its simplicity, quickness, and accuracy. It was developed by Van der Held and Van Drunen[Citation29] and is based on the dissipation of heat generated by a source of infinitesimal diameter and infinite length in a homogeneous medium. Hence, the relationship between temperature increase and time depends on the heat generated and the thermal conductivity of the sample.[Citation30] A heat balance would lead to the following solution:
Among the sources of error with this technique are the finite length and diameter of the probe and the thermal contact resistance between the probe and sample.[Citation31] To correct for the effect of a finite diameter, Van der Held and Van Drunen[Citation29] introduced a pre-heating time (t 0) in EquationEq. (1):
According to Blackwell,[Citation32] the ratio of the probe length to its diameter must be larger than 25 to avoid end effects. Temperature gradients within the sample and heat reflection at the sample border should be avoided. This method presents good results for solids with low moisture content (MC) because the experiments are short and significant water movement within the sample during the experiment is not expected.[Citation28, Citation33] However, for porous media with high MCs, simultaneous heat and mass transfer occurs, and large experimental errors are expected, which has been attributed to moisture migration,[Citation34, Citation35] also known as the Dufour effect. Moreover, free convection of water at elevated temperatures is supposed to influence the heat transfer, increasing K 0.[Citation36]
Sakiyama and Yano[Citation37] described the total thermal conductivity of moist porous materials (Kt ) as the summation of the true effective thermal conductivity (K 0) and the heat transfer due to vaporization (Kv ):
Goedeken et al.[Citation35] determined K 0 using a model of parallel resistances, given by:
Goedeken et al.[Citation35] performed experiments with bread samples at MC ranging from 5 to 44% (w.b.). Their experiments were performed at 25 and 85°C, and they applied pressures up to 18 atm to minimize the moisture migration mechanism. The authors showed that the experimental values of K 0 were well fitted by the model of parallel resistances (EquationEq. 4), for all moisture contents tested.
MATERIALS AND METHODS
Materials
Sugar cane bagasse (SCB), orange pulp and peel (OPP) and wheat bran (WB) were tested. They were thoroughly washed with tap water to remove filth and were oven-dried at 105°C until they reached a constant weight. Water was sprayed over the solids to produce samples at several MCs, and the moist samples were stored at 5°C in thick-walled plastic bags for 15 days and revolved daily revolved to homogenize the moisture. For SCB, the moisture content ranged from 6.7 to 80.0% (w.b.), from 4.5 to 40.0% for WB, and from 6.0 to 75% for OPP. The adopted upper MC limit was established when free water was observed in the sample.
SCB was kindly provided by Usina Cerradinho, Catanduva-SP, Brazil, an industrial ethanol producer. Only fibers that passed through a 3-mm opening sieve and were retained by a 1.44-mm opening sieve were used. OPP was kindly provided by Citrovita, Catanduva-SP, Brazil, an industrial orange juice producer. The material was ground in a knife mill, and only the particles retained between 2- and 1.44-mm opening sieves were used. WB was bought from a local retailer and was not sieved.
Laurentino[Citation4] and Umsza-Guez[Citation3] conducted fermentation tests for pectinase production in a packed bed using the weight proportion 1:2:2 SCB/OPP/WB. Hence, some specific experiments in this work were performed at this proportion, termed the composed medium (CM). The dried materials were mixed and moisturized to MCs ranging from 22 to 80%. Protein, lipid, ash, and moisture contents were determined using AOAC standard methods;[39] the carbohydrate content was estimated by calculating the remaining mass. A thermal conductivity probe was calibrated using glass spheres of 0.3- and 3-mm diameters (Potters Industrial Ltd., Rio de Janeiro, Brazil) and glass wool as reference materials because their thermal conductivities have been reported in the literature and their rates of temperature rise are similar to those of the tested materials.
Thermal Conductivity Apparatus and Experiments
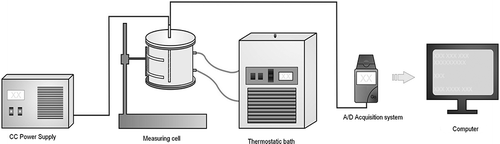
shows the experimental setup. The thermal conductivity probe was composed of a constantan heating wire and a type T thermocouple, both inserted into a stainless steel shaft of 6-mm OD and 215-mm length (L/D = 35.8); magnesium oxide of 99.9% purity was used to electrically isolate the wires. The probe and sample were inserted into an aluminum cylinder of 95-mm ID, 1-mm wall thickness, and 241-mm length surrounded by a polyvinyl chloride (PVC) tube of 157-mm ID. The annular space between the aluminum tube and PVC tube was used as a refrigeration jacket, through which water flowed at a constant temperature. The cell was closed by 15-mm-thick nylon lids. The signals provided by the thermocouple were collected by an A/D data acquisition system (COMPAQ-DAQ®, National Instruments, Austin, TX, USA), managed by a LabView®, version 8.5 (National Instruments), routine. The constantan heating wire was connected to a DC power source (Hewlett-Packard, Palo Alto, CA, USA).
Figure 1 Experimental setup.
The experiments were conducted at 25°C unless stated otherwise. The samples were packed within the aluminum cell by pouring fixed amounts of particles, followed by gentle handling to avoid irregular void spaces, with no pressure applied. A similar procedure was applied by Laurentino[Citation4] and Umsza-Guez[Citation3] in their fermentation experiments. When the temperature measured by the thermocouple probe indicated the same value as the refrigerating water, the heating wire was energized. The rate of temperature increase was preliminarily set according to the tested material.
Thermal Conductivity Calculation
In most cases, EquationEq. (2) takes the finite diameter of the probe and other non-ideal conditions into account.[Citation31] However, the probe used in this experiment was larger than the probes usually found in the literature,[Citation29, Citation30] and the calculation performed using EquationEq. (2) underestimates the K 0 values for some tested materials (corn, soybean, and bean) whose K 0 values have been reported in the literature. Thus, the probe was calibrated, and a correction factor (fc ) was determined, as suggested by Sweat:[Citation40]
To assess fc , experiments were conducted using glass spheres of 0.3- and 3-mm diameters as reference materials for WB and OPP, respectively, and glass wool for SCB. For the composed medium (CM), glass beads of 0.3-mm diameter were used because it was expected that a larger quantity of WB would be in contact with the probe.
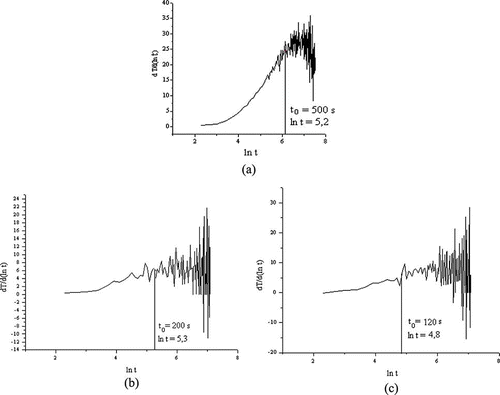
Because the material of the probe has a stable molecular thermal conductivity under temperature variations,[Citation41] the value of fc can be considered constant for all conditions. The values of K 0 for the reference materials were obtained from the literature: 0.035 W/m/K for glass wool[Citation42] and 0.252 W/m/K for the glass spheres.[Citation43] The pre-heating time t 0 was determined by taking the derivative of the temperature with respect to ln(t) using the finite difference technique provided by the software Origin®, version 6.0 (Microcal Software, Inc., Northamption, MA, USA). t 0 was determined from the graphical representation of dT/d ln(t) as a function of ln(t) as the derivative oscillated around a fixed value. The same experimental values of t 0 obtained for the reference materials were used for the tested samples.
The results obtained from the model of conductive resistances in parallel, Eqs. (4) through (6), were compared with the experimental results. For this calculation, the porosity (ϵ) of the porous media was needed, and the results provided by Laurentino[Citation4] for all tested materials were used. The author used the same technique for loose packing in this work and observed a decrease in ϵ with increasing MC due to swelling of the organic materials. The ϵ values ranged from 91.0 to 83.9% for MCs ranging from 4.0 to 75.0% for SCB, respectively; 67.3 ≥ ϵ(%) ≥ 32.9 for 6.5 ≤ MC(%) ≤ 75.0 for OPP, respectively; 60.9 ≥ ϵ(%) ≥ 56.0 for 2.9 ≤ MC(%) ≤ 66.0 for WB, respectively; and 84.0 ≥ ϵ(%) ≥ 67 for 5.0 ≤ MC(%) ≤ 75.0 for the composed medium, respectively. It must be noted that the trend of decreasing ϵ with increasing MC was steady for SCB and OPP and slightly irregular for WB. The experiments followed full statistical designs with temperature and moisture content as the controlled variables. The variance analysis was performed using the software Minitab®, version 15.1 (Minitab, Inc., State College, PA, USA).
RESULTS AND DISCUSSION
A large probe was necessary due to the nature of the porous medium. As previously mentioned, contact between the probe and the sample is one error source involved with this technique; hence, the probe diameter must be designed to guarantee efficient contact between the probe and the porous matrix. The fibers observed were irregular for SCB, and ϵ was noticeably high for all MCs studied. The shaft of a small diameter probe would contact few particles and large portions of air. Such contact is not effective in the sense of an elementary representative volume of a porous medium,[Citation45] defined as a particle and its immediate vicinity.
Due to the probe diameter, calibration was required using reference materials with effective thermal conductivities and porous structures similar to those of the samples. Calibration was also necessary because the probe was built by an industrial thermocouple producer (Rizzitherm, São Paulo-SP, Brazil) using the same technique applied for the production of sheathed thermocouples, leading to a probe design that is different from the others described in the literature.[Citation25, Citation40, Citation45]
To verify the accuracy of our method, experiments were conducted with corn (13% MC) and surgical cotton (7% MC) using glass spheres 3 mm in diameter and glass wool as reference materials, respectively. The experimental values found were 0.144 W/m/K and 0.049 W/m/K for corn and cotton, respectively. Kustermann[Citation46] reported 0.14 W/m/K for corn, and Frydrych and co-workers[Citation47] observed a range of 0.047 to 0.053 W/m/K for cotton, depending on the variety.
presents the derivative dT/d ln(t) used to determine the pre-heating time (t 0) for the reference materials. The values of t 0 were 500 s for glass wool, 200 s for glass spheres of 3-mm diameter, and 120 s for glass spheres of 0.3-mm diameter. The difference between the t0 values for the glass beads must be highlighted. Because they are made of the same type of glass (soda-lime borosilicate), the difference in t 0 can be attributed only to contact between the probe and the porous matrix. Because the rates of temperature rise were similar between the tested samples and their respective reference materials, the pre-heating times obtained for the reference materials were applied to the samples.
Table 1 Thermal conductivity data as a function of moisture content (MC% wet basis) at 25°C
Figure 2 Derivative of temperature with respect to ln(t) to determine the pre-heating time of (a) glass wool, (b) 3-mm glass spheres, and (c) 0.3-mm glass beads.
Thermal conductivity data are presented in as a function of moisture content for all studied materials at an initial temperature of 25°C. Some tests were conducted for sugar cane bagasse and orange pulp and peel at an initial temperature of 50°C, but the results were not suitable for analysis because the temperature as a function of ln(t) never reached a linear trend. For an initial temperature of 25°C, the final temperature of the experiments was approximately 80°C; for an initial temperature of 50°C, the final temperature of the tests reached 100°C; thus, the results were poor.
Sugar Cane Bagasse (SCB)
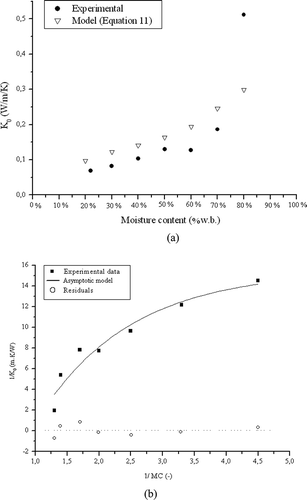
displays K0 for SCB as a function of MC, where a linear trend is observed up to 25% MC. Similar trends have been noted by several authors for solid foodstuffs at low MC ranges.[Citation45, Citation48] However, a steep increase was observed for MCs above 25%, as also reported by other authors,[Citation19, Citation48, Citation49] who attribute such behavior to a moisture migration mechanism not considered in the mathematical modeling. According to this supposition, part of the heat generated by the probe vaporizes water from the solid instead of being totally conducted, and the vaporized water is transferred to a cold zone.
Figure 3 (a) Experimental and estimated K 0 values as a function of moisture content (MC) in wet basis (w.b.) and (b) fitting of the asymptotic model to the experimental data of K 0 for sugar cane bagasse.
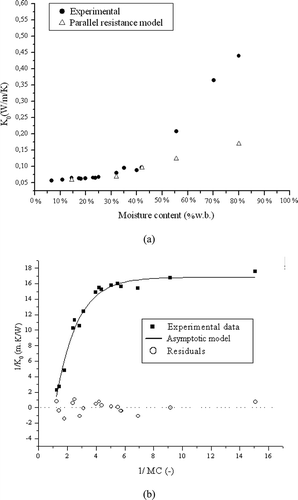
In this work, another hypothesis is considered. Laurentino[Citation4] obtained sorption isotherms for SCB at 30, 45, and 60°C for water activities (aw ) ranging from 0.22 to 0.97 and observed that the equilibrium moisture content (Xeq ) was independent of temperature. Laurentino observed low Xeq values for high values of aw (Xeq = 17%, w.b., for aw = 0.97). This author fitted themodel of Oswin[Citation50] to the experimental data; by extrapolating the model to aw = 0.99, the calculated Xeq would be 25%. Even at such high aw , water is strongly bound to the solid, the heat transport is dominated by conduction, and K 0can be estimated by the model of resistances in parallel, Eqs. (4) through (6), as shown in . For higher MC values, the Xeq water is weakly bound to the porous matrix, with a film of water covering the fibers, and heat conduction through this film overcomes the conduction through the solid. Hence, K 0 tends to approach the molecular thermal conductivity of pure water as the MC approaches 100% (Kwater = 0.611 W/m/K at 25°C).[Citation51] Therefore, the observed mechanism is more likely to be heat conduction through a liquid film than moisture migration. Due to the intricate nature of the fiber porous media, water convection was not expected.
The following asymptotic empirical equation was fitted to the experimental data for the entire range of MCs:
A, B, and C are fitting parameters whose respective values and standard deviations are 16.8 ± 0.4, 35.7 ± 3.4, and 0.51 ± 0.03, respectively. presents the experimental data fitted by EquationEq. (8), and a good fit is observed, as confirmed by the high regression coefficient (R Citation2 = 0.98) and a random residual distribution. This equation is linear regarding parameters A and B, which is an important feature of non-linear regression because it minimizes the possibility of parameter bias due to the regression process. More details on non-linear regression can be found elsewhere.[Citation52, Citation53]
Orange Pulp and Peel (OPP) and Wheat Bran (WB)
shows a steady increase of K 0 with increasing MC for OPP. However, the values predicted by the parallel resistance model are lower than the experimental values for almost the entire range of MCs studied. The contact between the probe and the sample again seems to be the key to understanding such behavior. At low MC values, the particles are hard and non-deformable, while at high MCs, the particles are soft and flexible. Consequently, the surface area of the particles in contact with the probe increases with increasing MC, improving heat dissipation, an effect not considered by the model.
Figure 4 Experimental data (and a linear fit) and estimated K 0 values as a function of moisture content (MC) in wet basis (w.b.) for (a) orange pulp and peel and (b) wheat bran.
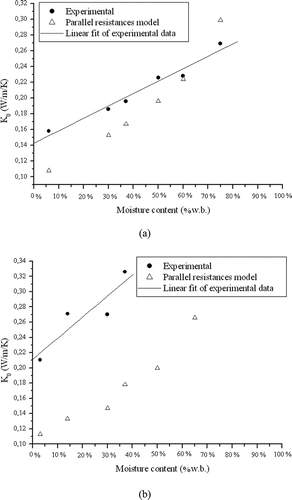
A linear regression applied to the experimental data for OPP resulted in the following equation:
The standard deviations for the linear and angular coefficients were 6.63 × 10− Citation2 and 0.014, respectively. The regression coefficient (R Citation2) was 0.98.
The results for WB were similar to those for OPP, as shown in . The predicted values were lower than the experimental results, probably due to the same reason indicated for OPP. It must be highlighted that the highest MC at which free water was not observed was 40%. The result obtained by applying a linear regression to the experimental K 0 for WB was the following equation:
The standard deviations for the linear and angular coefficients were 0.021 and 0.081, respectively, and the regression coefficient (R Citation2) was 0.92.
Composed Medium (CM)
presents the results for the composed medium. A linear trend was observed for moisture contents ranging from 22 to 70%, and a steep increase was found from 70 to 80%. According to Umsza-Guez,[Citation3] SCB is used during fermentation experiments only to provide structure to the porous medium, whereas WB and OPP are the actual substrates. The physical functionality of SCB in this process is confirmed by the porosity values obtained by Laurentino[Citation4] for the composed medium, which are close to the values of porosity observed for SCB. Therefore, it was expected that SCB would play an important role in the heat transfer process, even though it composed the smallest proportion. To assess this importance, also presents the estimated value of K 0 for the composed medium. This value was obtained using the values of K 0 estimated by the parallel resistance model for each individual wet material, considering the volumetric fraction of water, particle density, and bulk porosity. Consequently, K 0 was balanced by the fraction of each material, as demonstrated by the following equation:
Figure 5 (a) Experimental and estimated K 0 as a function of moisture content (MC) in wet basis (w.b.) and (b) fitting of the asymptotic model to experimental K 0 values for the composed medium (20% SCB, 40% OPP, and 40% WB).
The estimated and experimental K 0 values agree well up to 70% MC, and a mismatch was only observed at MC 80%. At such high moisture content, free water was observed when handling the material even after a resting period of 15 days, and K 0 approached the molecular thermal conductivity of the water.
After applying an asymptotic equation similar to EquationEq. (8) to the experimental data of the composed medium, parameters A, B, and C and their standard deviations were found to be 15.7 ± 2.6, 28.3 ± 7.6, and 0.5 ± 0.2, respectively. shows the fitting curve, whose regression coefficient was 0.97.
CONCLUSIONS
The line heat source technique can be applied to fibrous porous media with high moisture content, provided that the proper probe size and accurate calibration with reference materials that have thermal conductivities and structures similar to those of the tested materials are used. The K 0 values obtained were low for intermediate MCs and tended to the molecular conductivity of water for high moisture content, confirming the difficulty of heat conduction in such types of organic porous media. For sugar cane bagasse at high moisture content, water is weakly bound to the solid matrix, and heat is conducted through a liquid film formed on the fiber surface. Contact between the porous matrix and the probe plays an important role in K 0 determination, and the contact characteristics depend on moisture content for orange pulp and peel and wheat bran. A reliable estimation of K 0 of the composed medium (sugar cane bagasse, orange pulp and peel, wheat bran) based on the composition was obtained from the K 0 values of each individual material.
ACKNOWLEDGMENTS
The authors would like to acknowledge CAPES and FAPESP (proc. MS 2008/55736-3; IC 2010/0766-2) for scholarships and INCT-Bioetanol for the financial support.
REFERENCES
- Mitchell , D.A. , Krieger , N. and Berovic , M. 2006 . Solid-State Fermentation Bioreactors: Fundamentals, Design and Operation , Springer-Verlag: Berlin .
- Martin , N. 2010 . Pectinase production by a Brazilian thermophilic fungus Thermomucor indicae-seudaticae N31 in solid-state and submerged fermentation . Microbiology , 79 ( 3 ) : 306 – 313 . Guez, M.A.U.; Sette, L.D.; Da Silva, R.; Gomes, E.
- Umsza Guez , M.A. 2009 . “ Thermomucor indicae-sedaticae N31 in glass flasks and in a fixed bed bioreactor; 106p ” . In Solid state fermentation production of polygalacturonase by the fungus , 1 – 106 . D.Sc. Thesis , UNESP : São José do Rio Preto . In Portuguese
- Laurentino , C.L. 2007 . Heat transfer in fixed beds with application to solid state fermentation reactors , 1 – 105 . M.Sc. Dissertation , UNESP : São José do Rio Preto . In Portuguese
- Zanelato , A.I. 2011 . Production of cellulolytic enzymes by solid state fermentation in fixed bed bioreactor , 1 – 116 . M.Sc. Dissertation , UNESP : São José do Rio Preto . In Portuguese
- da Silva , R. , Lago , E.S. , Merheb , C.W. , Macchione , M.M. and Park , Y.K. 2005 . Production of xylanase and CMCase on solid state fermentation in different residues by Thermoascus aurantiacus Miehe . Brazilian Journal of Microbiology , 36 : 235 – 241 .
- Sukumaran , R.K. , Singhania , R.R. , Mathew , G.M. and Pandey , A. 2008 . “ Cellulase production using biomass feed stock and its application in lignocellulose saccharification for bio-ethanol production ” . In Renewable Energy 1 – 4 . [s.v.]
- Gao , J. , Weng , H. , Zhu , D. , Yuan , M. , Guan , F. and Xi , Y. 2008 . Production and characterization of cellulolytic enzymes from the thermoacidophilic fungal Aspergillus terreus M11 under solid-state cultivation of corn stover . Bioresource Technology , 99 : 7623 – 7629 .
- Couri , S. , Terzi , S.C. , Pinto , G.A.S. , Freitas , S.P. and da Costa , A.C.A. 2000 . Hydrolytic enzyme production in solid-state fermentation by Aspergillus niger 3T5B8 . Process Biochemistry , 36 : 255 – 261 .
- Selvakumar , P. and Pandey , A. 1999 . Solid state fermentation for the synthesis of inulinase from Staphylococcus sp. and Kluyveromyces marxianus . Process Biochemistry , 34 : 851 – 855 .
- Mitchell , D.A. 2000 . New developments in solid-state fermentation. II. Rational approaches to the design, operation and scale up of bioreactors . Process Biochemistry , 35 : 1211 – 1225 . Kreiger, N.; Stuart, D.M.; Pandey, A.
- 1990 . Heat transfer simulation in solid substrate fermentation . Biotechnology and Bioengineering , 35 : 802 – 808 . Saucedo-Castañeda, G.; Gutiérrez-Rajas, M.; Bacquet, G.; Raimbault, M.; Viniegra-González, G
- Sangsurasak , P. and Mitchell , D.A. 1995 . Incorporation of death kinetics into a 2-D dynamic heat transfer model for solid state fermentation . Journal of Chemical Technology and Biotechnology , 64 : 253 – 260 .
- Sangsurasak , P. and Mitchell , D.A. 1998 . Validation of a model describing two-dimensional heat transfer during solid-state fermentation in packed bed bioreactors . Biotechnology and Bioengineering , 60 ( 6 ) : 739 – 749 .
- Fanaei , M.A. and Vaziri , B.M. 2009 . Modeling of temperature gradients in packed-bed solid-state bioreactors . Chemical Engineering and Processing , 48 : 446 – 451 .
- Zach , L. and Hui , Y.H. 2006 . “ Heat transfer ” . In Handbook of Food Science, Technology and Engineering , CRC Press : Boca Raton, FL . InEd
- Suter , D.A. , Agrawal , K.K. and Clary , B.L. 1975 . Thermal properties of peanut pods, hulls and kernels . Transactions of the ASAE , 18 ( 2 ) : 370 – 375 .
- Revankar , M. , Desai , K. and Lele , S. 2007 . Solid-state fermentation for enhanced production of laccase using indigenously isolated . Applied Biochemistry and Biotechnology , 143 : 16 – 26 .
- Costa , J.A.V. , Alegre , R.M. and Hasan , D.M. 1998 . Packing density and thermal conductivity determination for rice bran solid-state fermentation . Biotechnology Techniques , 12 ( 10 ) : 747 – 750 .
- Zhang , M. , Zhao , H.Z. , Zhang , L.J. , Yang , L. , Zhong , Z.Y. and Chen , J.H. 2011 . Experimental study on thermal conductivity of orange juice using probe system . International Journal of Food Properties , 14 ( 1 ) : 134 – 144 .
- Muramatsu , Y. , Sakaguchi , E. , Orikasa , T. and Tagawa , A. 2011 . Simultaneous estimation of the thermophysical properties of selected liquid dairy products by a transient heat flow probe method . International Journal of Food Properties , 14 : 557 – 569 .
- Turgut , A. , Tavman , I. and Tavman , S. 2009 . Measurement of thermal conductivity of edible oils using transient hot wire method . International Journal of Food Properties , 12 : 741 – 747 .
- Elansari , A.M. and Hobani , A.I. 2009 . Effect of temperature and moisture content on thermal conductivity of four types of meat . International Journal of Food Properties , 12 : 308 – 315 .
- Rao , P.V.K.J. , Das , M. and Das , S.K. 2008 . Thermophysical properties of sugarcane, palmyra palm, and date-palm granular jaggery . International Journal of Food Properties , 11 : 876 – 886 .
- Fang , Q. , Lan , Y.B. , Kocher , M.F. and Hanna , M.A. 2000 . Thermal conductivity of granular rice starches . International Journal of Food Properties , 3 : 283 – 293 .
- Kocabiyik , H. , Kayisoglu , B. and Tezer , D. 2009 . Effect of moisture content on thermal properties of pumpkin seed . International Journal of Food Properties , 12 : 277 – 285 .
- Mahapatra , A.K. , Lan , Y. and Harris , D.L. 2011 . influence of moisture content and temperature on thermal conductivity and thermal diffusivity of rice flours . International Journal of Food Properties , 14 ( 3 ) : 675 – 683 .
- Reidy , G.A. and Rippen , A.L. 1971 . Methods for determining thermal conductivity in foods . Transactions of the ASAE , 14 ( 1 ) : 248 – 254 .
- Van der Held , E.F.M. and Van Drunen , F.G. 1949 . A method of measuring the thermal conductivity of liquids . Physica , 15 ( 10 ) : 865
- McTaggart , R.B. and Underwood , W.M. 1960 . The thermal conductivity of several plastics, measured by an unsteady state method . Chemical Engineering Program Symposium Series , 56 ( 3 ) : 261 – 268 .
- Pratt , A.W. and Tye , R.P. 1969 . “ Heat transmission in low conductivity materials ” . In Thermal Conductivity , 301 – 405 . London : Academic Press Inc . InEd.
- Blackwell . 1956 . J.H. The axial flow error in the thermal conductivity probe . Canadian Journal of Physics , 34 : 412
- Hooper , F.C. and Lepper , F.R. 1950 . Transient heat flow apparatus for the determination of thermal conductivities . Transactions American Society of Heat and Ventilating Engineers , 56 : 309 – 326 .
- Sakiyama , T. and Yano , T. 1990 . Effects of air and water contents on the effective thermal conductivity of air impregnated gels . Agricultural Biology and Chemistry , 54 : 1375 – 1380 .
- Goedeken , D.L. 1998 . True thermal conductivity determination of moist porous food materials at elevated temperatures . Journal of Food Science , 63 ( 6 ) : 1062 – 1063 . Shah, K.K.; Tong, C.K
- Bird , R.B. , Stewart , W.E. and Lightfoot , E.N. Transport Phenomena , 2nd , John Wiley and Sons: New York, 2006 . Ed
- Sakiyama , T. and Yano , T. 1990 . Effects of air and water contents on the effective thermal conductivity of air impregnated gels . Agricultural and Biological Chemistry , 54 : 1375 – 1380 .
- Choi , Y. , Okos , Le Maguer , M. and Jelen , P. 1986 . “ M.R. Effects of temperature and composition on the thermal properties of foods ” . In Food Engineering and Process Applications , 93 – 101 . London, UK : Elsevier Applied Science Publications . InEds
- Association of Official Analytical Chemists (AOAC) . 2006 . Official Methods of Analysis , Gaithersburg , MD : AOAC .
- Sweat , V.E. 1971 . Effects of temperature and time postmortem on the thermal conductivity of chicken meat , 1 – 59 . D.Sc. Thesis , Purdue University : Lafayette, IN .
- Slifka , A.J. , Filla , B.J. and Phelps , J.M. 1998 . Thermal conductivity of magnesium oxide from absolute, steady-state measurements . Journal of Research of the National Institute of Standards and Technology , 103 ( 4 ) : 357 – 363 .
- Insulation Solutions. General purpose glass wool: Industrial insulation blanket. 2004 www.insulationsolutions.com.au/pdf/GlassWool-GP.pdf (http://www.insulationsolutions.com.au/pdf/GlassWool-GP.pdf)
- Thoméo , J.C. , Costa , M.A.V. and Lopes Filho , J.F. 2004 . Effective thermal conductivity of beans via a steady-state method . International Journal of Food Properties , 7 : 129 – 138 .
- Smith , J.M. 1973 . Heat transfer in fixed-bed reactors . Chemical Engineering Journal , 5 : 109 – 116 .
- Deshpande , S.D. , Bal , S. and Ojha , T.P. 1996 . Bulk thermal conductivity and diffusivity of soybean . Journal of Food Processing and Preservation , 20 : 177 – 189 .
- Kustermann , M. and Rahman , M.S. 1995 . “ The effect of physical properties of grain on processing ” . In Food Properties Handbook , CRC Press : Boca Raton, FL . InEd.
- Frydrych , I. , Dziworska , G. and Bilska , J. 2002 . “ Comparative analysis of the thermal insulation properties of fabrics made of natural and man-made cellulose fibres ” . In Fibres & Textiles in Eastern Europe 40 – 44 .
- Kayisoglu , B. , Kocabiyik , H. and Akdemir , B. 2004 . The effect of moisture content on the thermal conductivities of some cereal grains . Journal of Cereal Science , 39 : 147 – 150 .
- Moote , I. 1953 . The effect of moisture on the thermal properties of wheat. Canadian Journal of Technology , 31 : 57 – 69 .
- Oswin , C.R. 1946 . The kinetics of package life. III. The isotherm . Journal of Chemical Industry , 65 : 419 – 421 .
- Perry , R.H. , Benskow , L.R. and Beimesch , W.E. 2008 . Perry's Chemical Engineers’ Handbook , McGraw-Hill : New York .
- Ratkowsky , D.A. 1983 . Nonlinear Regression Modeling , New York : Marcel Dekker .
- Thoméo , J.C. and Freire , J.T. 2000 . Heat transfer in fixed bed: A model non-linearity approach . Chemical Engineering Science , 55 : 2329 – 2338 .