
ABSTRACT
Barhi dates cultivar (Phoenix dactylifera L.) at Khalal stage of maturity was characterised by its sweetness, crunchiness, and bright yellow colour. Non-destructive and quick tools are necessary to evaluate fruit quality during post-harvest operations. Near-infrared (NIR) spectroscopy is an effective method to detect quality parameters for several fruits. In this study, NIR was utilised to correlate quality parameters (total soluble solids, moisture content, and b* colour) at five stages of maturity (from Khalal (green, to yellow), and Rutab (brown) with spectrum analysis. Barhi quality parameters were found to correlate well using NIR with a high coefficient of determination (R2) 0.97 for TSS; 0.94 for MC; and fair of 0.64 for b* colour. It can be concluded that NIR is an effective non-destructive tool to predict fruit quality of Barhi at different stages of maturity during various %post-harvest operations.
Introduction
The date palm (Phoenix dactylifera L.) is considered to be one of the oldest fruit trees in the world and still a major crop in the Middle East and other regions in the world. The global production of dates is 7.62 million tons in 2013; the top 5 producing countries were Egypt, Iran, Saudi Arabia, Pakistan, and United Arab Emirates.[Citation1] Nearly, 75% of dates produced in the world is from Middle East countries and Northern Africa. In 2015, Saudi Arabia produced 14% of the estimated world production from 28 million palm trees.[Citation2] Of that, the number of Barhi Palm trees is 1.45 million trees with an estimated production of 177,000 tons of Barhi fruits annually.
Barhi dates cultivar is well known in the international market. Dates fruit ripening can be classified into five stages of maturity (Hababouk, Kimri, Khalal, Rutab, and Tamr).[Citation3] This study pointed out that some varieties with low tannins and high sugar content can be harvested at the Khalal stage of maturity. Unlike other cultivars, Barhi is consumed at Khalal stage of maturity of yellow colour. Consumers prefer this Barhi cultivar because of its sweetness, crunchiness, mild hardness, and bright yellow colour. Barhi dates is typically harvested at Khalal stage of maturity prior to full physiological ripening when it becomes yellow in colour.[Citation4] One of the challenges in marketing fresh Barhi dates is its short harvesting season (about 3 weeks). To achieve high season market prices, growers tend to harvest fruit before or as soon as horticultural ripening is reached.[Citation5] The huge production of fresh yellow Barhi dates at season causes a vast amount of losses for farmers and thus leads to low prices.[Citation6] Typically, labour harvest fruits are based on their physical properties including colour, sweetness, and moisture content.[Citation7] There is a need to develop a non-destructive and objective method to detect the quality of the fruit at harvest. Kader[Citation8] emphasised the importance of selecting the right maturity level at harvest which is one of the main factors influencing quality and storage life of fruits.[Citation8]
Near-infrared in the wave length region (700–1100 nm) can be utilised to predict fruit quality indices such as moisture content, total soluble solids, skin and bulb colours.[Citation9] The NIR spectrum can help to identify several quality indices at field non-destructively and to track fruit quality during storage.[Citation10] It has been stated that physical properties of agricultural products have an electromagnetic energy for each commodity[Citation11] that can be absorbed (in the red region of 475 nm and blue of 650 nm) or reflected (in the green region of 510 nm).
NIR has been correlated with various quality parameters such as acidity, firmness, total soluble solids, dry matter, and ascorbic acid for several fruits and vegetables.[Citation12–Citation15] Typical absorption curve of mandarin has six broadband peaks.[Citation16] The high absorbance at NIR of 672 nm is indicative of absorbing pigments particularly chlorophyll, that give the fruit its distinctive green colour. NIR models were applied for apple fruits (300–2000 nm) to predict total soluble solids with high R2 (0.91–0.97).[Citation13,Citation15,Citation17,Citation18] For cherry fruits, total soluble solids were estimated using NIR spectroscopy at wave length (600–1100 nm) with standard error of prediction (SEP) of 0.75.[Citation19] Physical properties including colour hue angle and TSS were examined for Kiwi fruits using NIR with R2 (0.93; 0.82), respectively.[Citation20] Other studies predicted total soluble solids in mango fruits using NIR at wave length (1100–2500 nm) with R2 range of 0.93 to 0.99.[Citation21–Citation24] Tomato quality parameters (total acids, total sugars, lycopene, and total phenolic) were predicted using NIR at wave length range (500–1000 nm) with R2 value of 0.965.[Citation25]
The sweetness of many fruits and vegetables is a desirable attribute that is often governed, in part, by sugar concentration. The total soluble solid (TSS) expressed as Brix is commonly used as an estimate of fruit sweetness and is included in assessments of the post-harvest quality of many fruits such as apple.[Citation26] The sugar content and sweetness of fruit and vegetables are commonly quantified by instrumental assessment as well as sensory evaluation including taste panels.[Citation27] Soluble sugars, mostly consisted of glucose, fructose and sucrose, may be determined using refractometry or colourimetry process. Total soluble solids (TSS) are the most important quality parameters used to indicate sweetness of fresh and processed horticultural food products, in laboratories for research and by industry to determine marketing standards.[Citation28] Moreover, TSS can be measured using either a Brix scale hydrometer or a refractometer and reported as ‘degrees Brix’ (◦Brix) which is equivalent to percentage (%).
Limited publications are available that predict date fruits quality utilising NIR spectroscopy. An automatic grading machine of Deglet Noor dates was developed based on NIR spectroscopy at wave length range 800 to 1050 nm for full ripe dates.[Citation29] The results showed excellent model prediction with R2 of 0.977 and RMSE 1.5. In a similar work, continuous sorting machine was developed for Majdool full ripe dates using digital reflective near-infrared imaging for fruit size and skin delamination that can be used for future commercial production.[Citation30] In an interesting study, dates of Shahani cultivar were classified to four stages of maturity (Kimiri, Khalal, Rutab, and Tamr) utilising NIR spectroscopy at (900–1700 nm).[Citation31] The predictive models showed R2 values of 0.98 and 0. 0.96 for moisture content and soluble solids; respectively. From the literature, there is no published paper on the quality of Barhi dates utilising NIR. There is a need to predict quality parameters of fresh Khalal Barhi fruits based on non-destructive method such as NIR spectrum to evaluate fruit quality during harvest and post-harvest operations. The objective of this study was to predict some quality parameters (TSS, MC, and b* colour) of Barhi fruits utilising NIR spectroscopy at different stages of horticulture maturity.
Materials and methods
Fruit samples
Barhi fruits were harvested from nine different farms at three regions (Riyadh, Qassim, and Hail) in Saudi Arabia. Barhi fruits were brought on the same day to Food Processing Laboratory at King Saud University. These fruits were collected during 2016 season (10 July–15 September) at five stages of maturity starting from ‘green’ (below 80% yellowish), to yellow (3 levels: 80, 90, and 100%), to Rutab (more than 100% yellowish).
Experimental procedure
Represented Barhi fruits from different farms and regions in Saudi Arabia were collected during harvesting season at different stages of maturity, namely: green (#1), 80% yellowish (#2), 90% yellowish (#3), 100% yellowish (#4), and Rutab (brown in colour soft in texture #5). Every batch consists of 200 fruits collected at the specific stage of maturity (5 harvesting time) with five days interval. All samples were cleaned from possible dust with mild batch pressurised air (3 bars). Then, spectrum estimation was applied to all collected fruits to initiate the relationship between selected quality indices (b*, TSS, and M.C) and NIR. Moreover, some other basic physical properties of fruits (135 samples) were measured including weight, dimensions, volume, density, and surface area.
Physical properties
Mass of individual dates (135 samples) was measured by a sensitive balance (JS 3002 G, Mettler Toledo, Switzerland) with accuracy ± 0.01 g. Samples density were determined (PG-203, Mettler Toledo, Switzerland) by weighing dates in air (mass, W) and measuring buoyant force (G) which is the difference between the weight of sample in air and in liquid according to Equation (1). If the sample is lighter than the liquid, another solid heavier than the liquid can be attached to the sample as a sinker, and then density can be calculated from Equation (2).[Citation32]
Length and diameter of fruits were measured using dimensional digital scale (CD-15CW, Mitutoyo Crop., Japan). Colour meter (Model 45/0, Hunter Associates Laboratory. Inc., VA, USA) was utilised to measure colour parameters including b*. Moisture content (wet basis) was determined using AOAC procedures where the samples were dried at 70°C for 48 h under vacuum of 200 mm of mercury (Vacutherm model VT 6025, Heraeus Instrument, D- 63450, Hanauer, Germany).[Citation30] TSS weas determined using refractometer (E-line ATC 44–803, Global Water, USA). Fruit volume was calculated from fruit mass and density.
Spectrum estimation
Spectrum analysis was conducted utilising spectrophotometer instrument (handheld F-750, Felix Instruments, Camas, WA) with wave length range (285 to1200 nm. All fruits were divided into five groups based on maturity stages. Training sets were performed by placing the fruit (at room temperature) on the instrument lens at the setup mode to measure the spectrum parameters of fruit samples. Then, the physical properties (TSS, MC, and b*) of fruits (reference values) were measured corresponding to spectrum data. These data were sorted and analysed using (F-750 Data Viewer Software, Version: v1.1.0.51). Model Builder (version: v1.1.0.105) was used to correlate first and second derivative at (285–1200 nm) to predict the model of spectrum with those reference values. Prediction model of Barhi fruits quality can be summarised in the following steps: (i) Creating training set for represented samples of Barhi dates, (ii) Measuring corresponding quality parameters (TSS, MC, b* colour), (iii) Extracting spectrum data from the instrument into Data Viewer Software, (iv) Building Barhi fruit model based on the spectrum and fruit quality parameters using Model Builder, (v) Validating the developed model based on the newly measured quality parameters and the predicted model.
Statistical analysis
Physical properties of Barhi fruits were analysed using statistical package (SPSS, Version 22, IBM, USA). Felix Model Builder was utilised to calculate Coefficient of determination (R2), Root Mean Square Error (RMSE), and Principle Component Analysis (PCR). Generally, the best performance is achieved with the lowest RMSE and the highest R2 of the predicted values. Principle component analysis (PCR) is a standard regression analysis technique based on principal component analysis (PCA). PCR analysis was performed for both calibration and cross-validation samples for each of TSS, MC, and b*.[Citation33]
Results and discussion
Physical properties of Barhi dates
Basic descriptive statistics data of fruit properties including mass, volume, length, diameter, and surface area are summarised in . These data are comparable to Alhamdan et al.[Citation34] work in which the mass was 14.8 ± 2.6 g, volume 14.5 ± 2.9 cm3, density was 1.02 ± 0.05 g cm−3, surface area 27.9 ± 3.0 cm2, length 34.3 ± 2.0 mm, and diameter 27.5 ± 2.0 mm. Some variations of these physical properties of Barhi dates to this study possibly attributed to the age of palm trees and pre-harvest operations.
Table 1. Physical properties of fresh Barhi dates.
Quality indices
Physical properties of the five maturity stages (green to Rutab) are summarised in . Values of TSS of the measured fruits ranged from 7 to 35%; b* ranged from 8 to 39; and Moisture content (wet basis) ranged from 76–80% and 56–60%. The five stages of maturity of the Barhi fruits were picked at different harvesting time (5 days’ interval) starting at 94 days from pollination. The first stage of fruit maturity was picked at early Khalal stage (about 94 days from pollination) when fruit colour is 20–50% green (~50–80% yellowish). The other stages of maturity were selected based on the development of colour towards full yellowish. The last stage of fruit maturity was picked right after the Khalal stage and the start of Rutab (brown colour). The physical properties of Barhi fruits collected at those stages of maturity are shown in . The moisture content (wet basis) tends to decrease gradually during maturation from 80 to 56%. On the other hand, TSS and b* values tend to increase during maturation. These results agreed in general with those reported on the influence of harvesting time on the storage shelf-life of Khalal Barhi dates[Citation35] in the range 60–80% MC, 20–35% TSS, and yellow-green colour (sensory evaluation) during maturation. It can be seen that the harvesting time (stage of maturity) influenced all studied physical properties significantly (p ≤ 0.05) as shown in .
Table 2. Maturity quality index for Barhi fruit at five stages of maturity**.
Second derivative spectra analysis
The mean second derivative spectra for the five stages of maturity of Barhi fruits (200 fruits for each stage) at the wave length region (285–1200 nm) are shown in . Each Barhi stage of fruit maturity has a unique trend with its second derivative wavelength curve. Each second derivative curve in is a mean of 200 samples of Barhi fruits.
Figure 1. The mean second derivative of absorbance in wave length range (285-1200 nm) (A); absorbance for chlorophyll wave length range (660-690 nm) (B); and absorbance for water content wave length range (940-980 nm) (C) for each Barhi fruits stage of maturity.
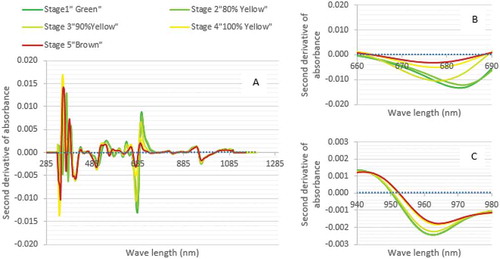
The chlorophyll peak occurred at NIR range of 660–690 nm for all stages of maturity. From , it can be seen that the trend of the mean second derivative curve of the 1st stage (green) was the lowest. Thus, the amount of chlorophyll in green Barhi fruits was the highest at 660–690nm, which then decreased during maturation process. This is in agreement with that of olive fruits.[Citation36] Similarly, the observed chlorophyll content for apple decreased significantly during ripening and storage.[Citation37] It has been reported that NIR has a chlorophyll peak around 680 nm[Citation38] which is similar to that of this study. This chlorophyll content allows fruits to absorb energy during maturation which is responsible for converting carbon dioxide to sugars and starch.[Citation39]
shows that the mean second derivative curve of 1st stage (green) of Barhi fruits was the highest in moisture content at wave length range (940–980 nm). This is similar to the Gerbera plants that were sensitive to water at wave length range (950–970 nm).[Citation40]
Reflectance measurements analysis
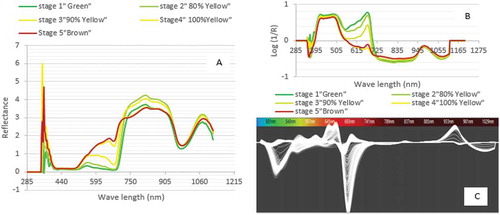
Typically, the reflectance spectra occur in the visible range (475 to 650 nm).[Citation11] illustrates that the difference between reflectance curves of maturity stages was noticeable in the visible region (513–643 nm). This indicates that the variations in reflectance are sensitive to the physiological maturation of Barhi fruits. The upward shift of the spectra curves might reflect the transition from the green to yellow stages of fruit maturity.
Figure 2. The mean second derivative of absorbance in wave length range (285–1200 nm) (A); absorbance for chlorophyll wave length range (660–690 nm) (B); and absorbance for water content wave length range (940–980 nm) (C) for each Barhi fruits stage of maturity.
Response of NIR spectra to fruit absorption
From , it can be observed that the chlorophyll absorbance peak occurred at 680 nm. At this peak, the absorbance varies noticeably due to the stages of ripening for Barhi fruits. The absorbance was the highest for less mature fruit (e.g., 1st stage ‘green’) and gradually lower towards more mature fruit (e.g., 5th stage ‘Rutab’).
For wave length spectra region (930 nm), water absorbance was the dominant. shows that the absorbance curve of green stage of maturity is the lowest while it is the highest for Rutab. This is comparable to that of other fruits such as mango, apple, mandarin, and kiwi.[Citation41–Citation44] A distinguished peak appears at 975 nm that is due to water and carbohydrate absorbance. It was reported[Citation16] that potent water absorption band of Mandarin occurred at 960–990 nm, which is similar to spectrum range of this study. The whole spectrum for the 1000 samples is shown in which indicates the absorbance variations due to effect of fruit stages of maturity.
Principle component analysis
PCR analysis for calibration and cross-validation for TSS, moisture content, and b* properties is shown in . In calibration models, R2 and RMSE values were (0.99, 0.69) for TSS; (0.69, 2.25) for b*; (0.97, 1.26) for moisture content, respectively. In cross-validation models, R2 and RMSE values were (0.97, 1.00) for TSS; (0.64, 2.28) for b*; (0.94, 1.90) for MC, respectively. According to Williams and Norris[Citation45], R2 values higher than 0.70 indicate excellent model performance, while the values ranged from 0.50 to 0.69 show good model performance that suits fruit quality control purposes. This indicated that PCR in this study is excellent for predicting TSS and MC while it is good performance for b*. Selecting too much principle components may cause data confusion.[Citation46] However, few principle components may not be enough to get strong model. Therefore, it is important to choose an optimal number of principle components to optimise data fitting. Accordingly, the principle components (7–12) selected in this study were optimised to obtain high-performance models.
Table 3. PCR model for TSS, M.C, and b* in fresh Barhi dates.
shows a statistical summary of calibration, cross-validation, and prediction of quality parameters for Barhi fruits. CV values for each calibration and cross-validation models were (3.52, 2.60) for TSS; (3.80, 2.95) for MC; and (18.38, 18.75) for b*, respectively. This high coefficient of variation range is due to the wide range of maturation stages from ‘hard’ green to ‘soft’ brown stages. Some outliers of samples were detected utilising PCR and thus excluded (4 samples of TSS model and 5 samples from b* model; out of 1000 samples) as shown in . It can be concluded that data for each process of calibration, validation, and prediction are comparable due to high PCR performance to the studied range of maturity stages for Barhi fruits.
Table 4. Main statistical spectra for TSS, MC%, and b* in Barhi fruit samples.
Performance of prediction model
shows the correlation of predicted values by near-infrared spectra and measured values of fruit’s physical properties (TSS, b*, and MC). Data analysis of R2 revealed that NIR spectroscopy was best correlated in TSS (0.97) and M.C (0.94) models while less for b* model (0.64).
Figure 3. Predicted and measured values of TSS (A); b* (B); MC (C) models for Barhi fruit.
Conclusion
NIR-spectroscopy is a powerful non-destructive tool to predict TSS and moisture content with high R2 of (0.97% and 0.94%) and fair with b* colour (0.69%) for fresh Barhi fruits at five stages of maturity (green to brown) at wave length range (285–1200 nm). NIR measurements had good correlations with measured values as well as for calibration and cross-validation samples of Barhi fruits. These results would enable farmers and producers in the field to optimise harvesting time utilising non-destructive method thus predicting accurately the proper stage of maturity of the fruit and to decide marketing destinations (e.g., less mature fruit for long-distance markets). Moreover, this method is a powerful tool for cold and controlled atmosphere (CA) facilities to manage harvesting and storing Barhi fruits based on fruit maturation. Thus, fresh Barhi fruits can be possibly sorted for market, cold stores, and/or to CA stores based on their maturation. To enhance the performance of the present data, temperature variations (0–35°C) could be incorporated in building spectra model to present refrigeration and field environment. The spectra models for Barhi fruits developed in this study can be utilised for fruit evaluation possibly with developing a smaller and price-effective instrument for routine analysis in field and storage. Moreover, based on the models established in this study, an efficient grading machine can be developed for sorting Barhi fruits.
Additional information
Funding
Related Research Data
References
- FAO. Dates Production. http://faostat3.fao.org/download/Q/QC/E 2016.
- Saudi General Authority of Statistics. Dates Production. http://www.stats.gov.sa/en 2016.
- Gross, K. C.; Chien, Y. W.; Mikal, S. The Commercial Storage of Fruits, Vegetables, and Florist and Nursery Stocks. Agriculture Handbook 66, U.S. Department of Agriculture: Washington, DC, 2016.
- Kader, A. A.; Hussein, A. M. Harvesting and Postharvest Handling of Dates. ICARDA Aleppo. 2009, 1–15.
- Al-Qurashi, A. D.; Awad, M. A. Quality Characteristics of Bisir ‘Barhee’dates during Cold Storage as Affected by Postharvest Dipping in Gibberellic Acid, Naphthaleneacetic Acid and Benzyladenine. Fruits. 2011, 66, 343–352.
- Alhamdan, A. M.; Hassan, B. H.; Alkahtani, H. A.; Ismaiel, S. M. Engineering aspects of the utilization of controlled atmosphere (CA) technology in shelf life extension of fresh barhi dates at khalal stage of maturity at a semi-commercial level. A research project funded by King Abdulaziz City for Science and Technology (KACST); 2012.
- Isaksson, T.; Swensen, L. P.; Taylor, R. G.; Fjæra, S. O.; Skjervold, P. O. Non‐Destructive Texture Analysis of Farmed Atlantic Salmon Using Visual/Near‐Infrared Reflectance Spectroscopy. J. Sci. Food Agric. 2002, 82, 53–60.
- Kader, A. A.; editor. Postharvest Technology of Horticultural Crops; UCANR Publications, Technology & Engineering: California, USA. 2002; p. 535.
- Walsh, K. B.; Guthrie, J. A.; Burney, J. W. Application of Commercially Available, Low-Cost, Miniaturised NIR Spectrometers to the Assessment of the Sugar Content of Intact Fruit. Funct. Plant Biol. 2000, 27, 1175–1186.
- Costa, G.; Noferini, M.; Fiori, G.; Miserocchi, O.; Bregoli, A. NIRs Evaluation of Peach and Nectarine Fruit Quality in Pre-And Post-Harvest Conditions. Acta Hortic. 2002, 2, 593–600.
- Jiang, J.; Qiao, X.; He, R. Use of Near-Infrared Hyperspectral Images to Identify Moldy Peanuts. J. Food Eng. 2016, 169, 284–290.
- Bobelyn, E.; Serban, A.-S.; Nicu, M.; Lammertyn, J.; Nicolai, B. M.; Saeys, W. Postharvest Quality of Apple Predicted by NIR-spectroscopy: Study of the Effect of Biological Variability on Spectra and Model Performance. Postharvest Biol. Technol. 2010, 55, 133–143.
- Liu, Y.; Ying, Y. Use of FT-NIR Spectrometry in Non-Invasive Measurements of Internal Quality of ‘Fuji Apples. Postharvest Biol. Technol. 2005, 37, 65–71.
- Maniwara, P.; Nakano, K.; Boonyakiat, D.; Ohashi, S.; Hiroi, M.; Tohyama, T. The Use of Visible and Near-Infrared Spectroscopy for Evaluating Passion Fruit Postharvest Quality. J. Food Eng. 2014, 143, 33–43.
- Nicolaï, B. M.; Lötze, E.; Peirs, A.; Scheerlinck, N.; Theron, K. I. Non-Destructive Measurement of Bitter Pit in Apple Fruit Using NIR Hyperspectral Imaging. Postharvest Biol. Technol. 2006, 40, 1–6.
- Gomez, A. H.; He, Y.; Pereira, A. G. Non-Destructive Measurement of Acidity, Soluble Solids and Firmness of Satsuma Mandarin Using Vis/NIR-spectroscopy Techniques. J Food Eng. 2006, 77, 313–319.
- Lu, R.; Guyer, D. E.; Beaudry, R. M. Determination of Firmness and Sugar Content of Apples Using Near‐Infrared Diffuse Reflectance. J. Texture Stud. 2000, 31, 615–630.
- Peirs, A.; Schenk, A.; Nicolaı̈, B. M. Effect of Natural Variability among Apples on the Accuracy of VIS-NIR Calibration Models for Optimal Harvest Date Predictions. Postharvest Biol. Technol. 2005, 35, 1–13.
- Carlini, P.; Massantini, R.; Mencarelli, F. Vis-NIR Measurement of Soluble Solids in Cherry and Apricot by PLS Regression and Wavelength Selection. J. Agric. Food Chem. 2000, 48, 5236–5242.
- Schaare, P.; Fraser, D. Comparison of Reflectance, Interactance and Transmission Modes of Visible-Near Infrared Spectroscopy for Measuring Internal Properties of Kiwifruit (Actinidia Chinensis). Postharvest Biol. Technol. 2000, 20, 175–184.
- Rivera, N. V.; Gómez-Sanchis, J.; Chanona-Pérez, J.; Carrasco, J. J.; Millán-Giraldo, M.; Lorente, D.; Cubero, S.; Blasco, J. Early Detection of Mechanical Damage in Mango Using NIR Hyperspectral Images and Machine Learning. Biosystems Eng. 2014, 122, 91–98.
- Saranwong, S.; Sornsrivichai, J.; Kawano, S. Improvement of PLS Calibration for Brix Value and Dry Matter of Mango Using Information from MLR Calibration. J. Near Infrared Spectrosc. 2001, 9, 287–296.
- Schmilovitch, Z. E.; Mizrach, A.; Hoffman, A.; Egozi, H.; Fuchs, Y. Determination of Mango Physiological Indices by Near-Infrared Spectrometry. Postharvest Biol. Technol. 2000, 19, 245–252.
- Valente, M.; Leardi, R.; Self, G.; Luciano, G.; Pain, J. P. Multivariate Calibration of Mango Firmness Using vis/NIR Spectroscopy and Acoustic Impulse Method. J. Food Eng. 2009, 94, 7–13.
- Ding, X.; Guo, Y.; Ni, Y.; Kokot, S. A Novel NIR Spectroscopic Method for Rapid Analyses of Lycopene, Total Acid, Sugar, Phenols and Antioxidant Activity in Dehydrated Tomato Samples. Vib. Spectrosc. 2016, 82, 1–9.
- Nicolai, B.; Beullens, K.; Bobelyn, E.; Peirs, A.; Saeys, W.; Theron, K.; Lammertyn, J. Nondestructive Measurement of Fruit and Vegetable Quality by Means of NIR Spectroscopy: A Review. Postharvest Biol. Technol. 2007, 46, 99–118.
- Zude, M.; Herold, B.; Roger, J.; Bellon-Maurel, V.; Landahl, S. Non-Destructive Tests on the Prediction of Apple Fruit Flesh Firmness and Soluble Solids Content on Tree and in Shelf Life. J. Food Eng. 2006, 77, 254–260.
- Lu, R.;. Multispectral Imaging for Predicting Firmness and Soluble Solids Content of Apple Fruit. Postharvest Biol. Technol. 2004, 31, 147–157.
- Dull, G. G.; Leffler, R. G.; Birth, G. S.; Zaltzman, A.; Schmilovitch, Z. E. The near Infrared Determination of Moisture in Whole Dates. HortScience. 1991, 26, 1303–1305.
- Lee, D.-J.; Schoenberger, R.; Archibald, J.; McCollum, S. Development of a Machine Vision System for Automatic Date Grading Using Digital Reflective Near-Infrared Imaging. J. Food Eng. 2008, 86, 388–398.
- Mireei, S.; Mohtasebi, S.; Massudi, R.; Rafiee, S.; Arabanian, A. Feasibility of near Infrared Spectroscopy for Analysis of Date Fruits. Int. Agrophys. 2010, 24, e356.
- Darmon, N.; Darmon, M.; Maillot, M.; Drewnowski, A. A Nutrient Density Standard for Vegetables and Fruits: Nutrients per Calorie and Nutrients per Unit Cost. J. Am. Diet. Assoc. 2005, 105, 1881–1887.
- AOAC. Association of Official Analytical Chemists – International [AOAC] Official Methods of Analysis, 18th ed.; AOAC: Gaithersburg, MD, USA, 2005.
- Alhamdan, A.; Hassan, B.; Alkahtani, H.; Abdelkarim, D.; Younis, M. Freezing of Fresh Barhi Dates for Quality Preservation during Frozen Storage. Saudi J. Biol. Sci. 2016. (in press)
- Alsaed, A.; Mehyar, G.; Arar, A. Eeffect of Harvesting Time and Storage Temperature on the Duration of Balah Stage of “Barhi” Dates. Italian J. Food Sci. 2013, 25, 345.
- Salvador, M.; Aranda, F.; Fregapane, G. Influence of Fruit Ripening on ‘Cornicabra’virgin Olive Oil Quality a Study of Four Successive Crop Seasons. Food Chem. 2001, 73, 45–53.
- Merzlyak, M. N.; Solovchenko, A. E.; Gitelson, A. A. Reflectance Spectral Features and Non-Destructive Estimation of Chlorophyll, Carotenoid and Anthocyanin Content in Apple Fruit. Postharvest Biol. Technol. 2003, 27, 197–211.
- Clément, A.; Dorais, M.; Vernon, M. Nondestructive Measurement of Fresh Tomato Lycopene Content and Other Physicochemical Characteristics Using Visible−NIR Spectroscopy. J. Agric. Food Chem. 2008, 56, 9813–9818.
- Partensky, F.; Garczarek, L. The Photosynthetic Apparatus of Chlorophyll B-And D-Containing Oxyphotobacteria, Photosynthesis in Algae. Springer: Netherlands. 2003, pp. 29–62.
- Penuelas, J.; Filella, I.; Biel, C.; Serrano, L.; Save, R. The Reflectance at the 950–970 nm Region as an Indicator of Plant Water Status. Int. J. Remote Sens. 1993, 14, 1887–1905.
- Rungpichayapichet, P.; Mahayothee, B.; Khuwijitjaru, P.; Nagle, M.; Müller, J. Non-Destructive Determination of β-carotene Content in Mango by Near-Infrared Spectroscopy Compared with Colorimetric Measurements. J. Food Composition Anal. 2015, 38, 32–41.
- Giovanelli, G.; Sinelli, N.; Beghi, R.; Guidetti, R.; Casiraghi, E. NIR Spectroscopy for the Optimization of Postharvest Apple Management. Postharvest Biol. Technol. 2014, 87, 13–20.
- Magwaza, L. S.; Opara, U. L.; Terry, L. A.; Landahl, S.; Cronje, P. J.; Nieuwoudt, H.; Mouazen, A. M.; Saeys, W.; Nicolaï, B. M. Prediction of ‘Nules Clementine’mandarin Susceptibility to Rind Breakdown Disorder Using Vis/NIR Spectroscopy. Postharvest Biol. Technol. 2012, 74, 1–10.
- Valero, C.; Ruiz-Altisent, M.; Cubeddu, R.; Pifferi, A.; Taroni, P.; Torricelli, A.; Valentini, G.; Johnson, D.; Dover, C. Detection of Internal Quality in Kiwi with Time-Domain Diffuse Reflectance Spectroscopy. Appl. Eng. Agric. 2004, 20, 223.
- Williams, P. C.; Norris, K. Near-Infrared Technology in the Agricultural and Food Industry. AACC Press: St. Paul, 2001.
- Josse, J.; Husson, F. Selecting the Number of Components in Principal Component Analysis Using Cross-Validation Approximations. Comput. Stat. Data Anal. 2012, 56, 1869–1879.