
 ?Mathematical formulae have been encoded as MathML and are displayed in this HTML version using MathJax in order to improve their display. Uncheck the box to turn MathJax off. This feature requires Javascript. Click on a formula to zoom.
ABSTRACT
The primary objective of this study was to optimize the production of exopolysaccharide (EPS) produced by L. kefiranofaciens ZW3 through the utilization of response surface methodology (RSM). Central Composite Design (CCD) was used along with three variables to study the response variable. The effects of lactose (0.16–1.84%), tryptophan (0.16–0.84%), and pH (5.06–7.24) on EPS production were studied. RSM analysis revealed that coefficient of determination (0.9907) was good for the second-order polynomial model. The optimum values of explanatory variables were 0.36% lactose, 0.23% tryptophan, and pH value of 5.19. Additional experiments were performed to confirm the adequacy of this model. The predicted value of EPS at optimized level was 1609 mg/L, while its experimental value at optimized level was 1602 ± 3 mg/L. This study could help to produce higher amount of EPS from L. kefiranofaciens ZW3, which has a lot of industrial applications.
Introduction
There is a growing trend to explore new microbes to produce exopolysaccharides (EPS). These EPS are present in the form of homopolymers and heteropolymers, having numerous applications in industrial products.[Citation1–3] However, the polymers produced by the lactic acid bacteria with GRAS status are of particular interest for the food scientists and have been studied extensively in the recent past.[Citation4] It is used in the dairy industry for the improvement of rheological characteristics of products such as cheese, kefir, and yogurt.[Citation1,Citation5,Citation6] The capacity of L. kefiranofaciens (isolated from kefir) for the production of kefiran (exopolysaccharide) was previously documented.[Citation7] Kefiran is a water-soluble polysaccharide with the chemistry of glucogalactan. It has got certain industrial important attributes, such as strong gel formation that are quite resistant to hydrolysis and viscosity modifying properties.[Citation5] Kefiran (EPS) is a food grade additive that can be used in fermented food products to improve the rheological properties of food products. Additionally, the kefiran can be used as emulsifier, stabilizer, and thickening agent in the food industry.[Citation7] It also possesses antibacterial, antifungal, anti-inflammatory, and antitumor properties.[Citation8] All these properties show its potential to be used in industrial conditions
In traditional methods, we can investigate the effect of one variable on the response, that is very expensive and time consuming. Secondly, they did not explore the interactions among independent variables.[Citation9–11] Now, optimization tools (such as response surface methodology) are available to simultaneously optimize different independent variables and explore the interactive effect of independent variables.[Citation12] Response surface methodology (RSM) is an effective technique for experimental design and prediction.[Citation13,Citation14] It has extensive applications in optimizing medium composition[Citation15,Citation16] and fermentation conditions[Citation17] for polymer production from different microbes. Since both carbon and nitrogen sources along with pH are critical factors influencing biopolymer production,[Citation18,Citation19] lactose (%), tryptophan (%) and pH were optimized for maximum production of kefiran from L. kefiranofaciens ZW3.
In our earlier investigation, we have documented the kefiran production by L. kefiranofaciens ZW3, and some attributes of this polymer were also characterized.[Citation8,Citation20] The major hindrance we and other researchers faced was low production yield under the routine production condition.[Citation4,Citation5] Previous studies have established the role of medium composition, source of carbon, incubation time and temperature for the production of EPS from L. kefiranofaciens.[Citation5,Citation21] However, no study was conducted to optimize the preparation conditions of EPS produced by L. kefiranofaciens ZW3 and to explore the interactions among independent variables. In the present study, we planned to optimize the levels of lactose, tryptophan, and pH during the production of EPS by L. kefiranofaciens ZW3. Optimized production conditions of this study will be helpful to produce higher amount of EPS which has a lot of industrial applications.
Materials and methods
Strain and basic media used
In our previous studies, we isolated the L. kefiranofaciens ZW3 strain from Tibet kefir.[Citation7,Citation8] The genomic sequence of its chromosome and plasmid pWW1 and pWW2 have been deposited in GeneBank with accession numbers CP002764, CP002765, and CP002766.[Citation7,Citation22] The ZW3 genome carries a 14.4-kb EPS gene cluster which contains 17 EPS-related genes that are responsible for the production of polysaccharide.[Citation22] Media used for propagation and for maximum EPS production was deproteinized whey and it was prepared by using the same method as described in our previous studies.[Citation7,Citation8] The temperature of the growth was 30°C and conditions were anaerobic. Produced EPS was estimated by phenol-sulfuric method.[Citation23]
Selection of suitable medium
The select of suitable medium for fermentation has a significant influence on the EPSs yield produced by any strain. Therefore, various media such as M17, APT, MRS, WHEY, Eillker, and SL were utilized for EPS production from L. kefiranofaciens ZW3 strain. Each medium containing 3% ZW3 inoculums was incubated anaerobically at 30°C for 72 h and the quantity of EPS produced was calculated using the phenol-sulfuric method.[Citation23]
Selection of appropriate carbon and nitrogen source
Different sugars (lactose, glucose, sucrose, xylose, maltose, and fructose) were added in the preliminarily selected whey media and nitrogen sources (peptone, tryptone, casein hydrolyzate, ammonium chloride, sodium nitrate, ammonium nitrate, and yeast extract). An inoculum of 3% ZW3 strain was introduced into each medium, followed by incubation under anaerobic conditions at 30°C for 72 h. The phenol-sulfuric acid method was used to quantify the produced EPS.[Citation23]
Experimental design
Based on the initial screening experiments, variables such as lactose, tryptophan, and pH were chosen for media optimization. The coded and un-coded values of these explanatory variables are summarized in . Central composite design (CCD) was used to investigate the impact of independent variables X1 (lactose %), X2 (tryptophan %,) and X3 (pH) on EPS production (). There are five levels for each independent variable: −1.68, −1, 0, 1, and 1.68 (). In order to determine the pure error sum of squares, six replicates were used in the center of the design. To minimize the impact of variability caused by extraneous factors, the experiments were randomized.[Citation24] The independent variables are encoded using the provided equation.
Table 1. Independent variables and their levels for central composite design.
Table 2. Experimental design with the experimental and predicted values for EPS production.
where L, T, and p represent lactose, tryptophan, and pH, respectively. The average production of EPS from two duplicates was taken as response Y.
Statistical analysis
The collected data was analyzed using regression models. The regression equations were derived using a second-order polynomial. Analysis of variance (ANOVA) was performed to access the significant difference at three probability levels: 0.001, 0.01, and 0.05. To visualize the impact of independent variables on the response and optimum conditions, contour, and surface plots were generated using the commercial statistical package Design Expert (Stat-Ease) 8.0.7.1. The obtained optimum conditions were then verified by conducting experiments. The response from the experiment was recorded for subsequent comparison between experimental and predicted values.
Results and discussion
Selection of appropriated medium
For the growth of microorganisms and production of EPS certain conditions are required. So, initial trials were carried out to select best media, nitrogen source, and carbon source. clearly exhibits the potential of whey as the best media for the production of EPS (885 mg/L) by the selected strain. It gives more than 80% higher yield than conventional MRS media. This was probably due to the presence of organic nitrogenous substances in the whey media that are essentially required for the growth of L. keifranfacies and providing required nutrients for the production of EPS. Another potential benefit of whey is that it provides a cheaper alternative to the previously used media.[Citation25] All other media tested showed comparatively lower yield of EPS under the conditions of the experiment.
Figure 1. Effect of different (a) medium, (b) carbon sources, and (c) nitrogen sources on EPS production.
Various factors, such as quantity of carbon source and the concentration of nitrogen sources (e.g., NaNO2 and yeast extract), have been utilized for the optimization of polymer production from different microorganisms.[Citation5,Citation18,Citation21,Citation26] Since different lactic acid bacteria exhibit distinct carbon metabolism pathways, selecting an appropriate carbon source becomes essential to achieve optimum EPS production. In the present study, the best source of polymer production from L. kefiranofaciens ZW3 was lactose (), and these results were similar to results reported in the literature.[Citation27] Taniguchi and colleagues documented that the L. kefiranofaciens JCM 7446 could produce around 200–250 mg/L of kefiran. Nevertheless, when utilizing 50 g/L of lactose as a carbon source, the highest kefiran yield (about 500 mg/L) was achieved after a cultivation time of 9 days.[Citation28] For nitrogen sources, tryptophan was the leading nitrogen source followed by casein hydrolyzate () for the production of EPS (1050 mg) under experimentation conditions. Based on the initial screening experiments, the variables such as lactose, tryptophan, and pH were selected for media optimization using response surface methodology.
Fitting the models
Through the analysis of dependent and independent variables, the subsequent regression equation was derived which depicted the relationship between EPS production and test variables in coded units. The regression equation in terms of actual factors obtained for EPS production was as follows.
Table 3. Significance of regression coefficients for EPS production.
Optimization
The 3D surface plots were generated to show the main and interactive effect between dependent variable and independent variables. These graphs were drawn by keeping one variable fixed at coded zero level () while varying the concentration of the other two variables.[Citation24] presents the influence of lactose %, tryptophan %, and pH value on EPS production using a second-order polynomial. The response surface plots displayed in are created by holding one variable at its optimum level while varying the concentration of the remaining variables. Overall, the surface plot shows a complex interaction between these variables.
Figure 2. 3D graph showing the effect of (a) lactose% and tryptophan %, (b) tryptophan % and pH, and (C) lactose % and pH on EPS production.
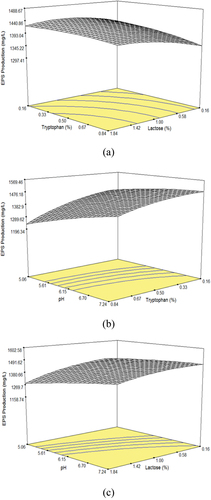
The effect of lactose% and tryptophan% on EPS production is shown in . Tryptophan has linear effect while lactose% has quadratic effect on response. shows the effect of tryptophan% and pH on EPS production. Both have quadratic effect on response. The effects of lactose% and pH on EPS production are shown in . A linear effect of pH and quadratic effect of lactose% was observed on EPS production. By assuming the partial derivative as zero, following optimization equations can be constructed:
By using the EquationEq.uations (2(2)
(2) –Equation4
(4)
(4) ) and EquationEquation (7
(7)
(7) –Equation8
(8)
(8) ), the subsequent results can be derived;
Verification of results
The optimum conditions obtained through model equations were tested to check their suitability to predict optimum response. These experimental conditions and responses were experimentally validated. Under optimum conditions, the predicted value of EPS Production was 1607 mg/L, while its experimental value was 1602 ± 3 mg/L. The experimental values and predicted values are shown in .
Table 4. Comparison of the experimental and predicted EPS production at optimum conditions.
Conclusion
Statistical analysis depicted that the linear term pH had most significant effect, followed by linear term effect of lactose% and quadratic effect of pH. The optimum EPS production (1603 mg/L) was obtained by using 0.36% lactose, 0.23% tryptophan, and pH value of 5.19. Additional experiments were performed to confirm the adequacy of the present model. The experimental value of EPS at the optimized level was 1602 ± 3 mg/L.
Disclosure statement
No potential conflict of interest was reported by the author(s).
References
- Vinogradov, E.; Sadovskaya, I.; Grard, T.; Chapot-Chartier, M.-P. Structural Studies of the Rhamnose-Rich Cell Wall Polysaccharide of Lactobacillus Casei BL23. Carbohydr. Res. 2016, 435, 156–161. DOI: 10.1016/j.carres.2016.10.002.
- Perveen, S.; Anwar, M. J.; Ismail, T.; Hameed, A.; Naqvi, S. S.; Mahomoodally, M. F.; Saeed, F.; Imran, A.; Hussain, M.; Imran, M., et al. Utilization of Biomaterials to Develop the Biodegradable Food Packaging. Int. J. Food Prop. 2023, 26(1), 1122–1139. DOI: 10.1080/10942912.2023.2200606.
- Ma, L. Z.; Wang, D.; Liu, Y.; Zhang, Z.; Wozniak, D. J. Regulation of Biofilm Exopolysaccharide Biosynthesis and Degradation in Pseudomonas aeruginosa. Annu. Rev. Microbiol. 2022, 76(1), 413–433. DOI: 10.1146/annurev-micro-041320-111355.
- Shahabi-Ghahfarrokhi, I.; Khodaiyan, F.; Mousavi, M.; Yousefi, H. Preparation of UV-Protective Kefiran/nano-ZnO Nanocomposites: Physical and Mechanical Properties. Int. J. Biol. Macromol. 2015, 72, 41–46. DOI: 10.1016/j.ijbiomac.2014.07.047.
- Zajsek, K.; Kolar, M.; Gorsek, A. Characterisation of the Exopolysaccharide Kefiran Produced by Lactic Acid Bacteria Entrapped within Natural Kefir Grains. Int. J. Dairy Technol. 2011, 64(4), 544–548. DOI: 10.1111/j.1471-0307.2011.00704.x.
- Du, R.; Yu, L.; Yu, N.; Ping, W.; Song, G.; Ge, J. Characterization of Exopolysaccharide Produced by Levilactobacillus brevis HDE-9 and Evaluation of Its Potential Use in Dairy Products. Int. J. Biol. Macromol. 2022, 217, 303–311. DOI: 10.1016/j.ijbiomac.2022.07.057.
- Wang, Y.; Ahmed, Z.; Feng, W.; Li, C.; Song, S. Physicochemical Properties of Exopolysaccharide Produced by Lactobacillus Kefiranofaciens ZW3 Isolated from Tibet Kefir. Int. J. Biol. Macromol. 2008, 43(3), 283–288. DOI: 10.1016/j.ijbiomac.2008.06.011.
- Ahmed, Z.; Wang, Y.; Anjum, N.; Ahmad, A.; Khan, S. T. Characterization of Exopolysaccharide Produced by Lactobacillus Kefiranofaciens ZW3 Isolated from Tibet Kefir–Part II. Food. Hydrocoll. 2013, 30(1), 343–350. DOI: 10.1016/j.foodhyd.2012.06.009.
- Yılmaz, Ş. Facile Synthesis of Surfactant-Modified Layered Double Hydroxide Magnetic Hybrid Composite and Its Application for Bisphenol A Adsorption: Statistical Optimization of Operational Variables. Surf. Interfaces. 2022, 32, 102171. DOI: 10.1016/j.surfin.2022.102171.
- Yılmaz, Ş.; Zengin, A.; Şahan, T. Bentonite Grafted with Poly(n-Acryloylglycineamide) Brush: A Novel Clay-Polymer Brush Hybrid Material for the Effective Removal of Hg(ii) and As(v) from Aqueous Environments. Colloids Surf. A Physicochem. Eng. Aspects. 2021, 612, 125979. DOI: 10.1016/j.colsurfa.2020.125979.
- Yılmaz, Ş.; Zengin, A.; Şahan, T.; Gübbük, İ. H. Efficient Removal of 2,4-Dichlorophenoxyacetic Acid from Aqueous Medium Using Polydopamine/Polyacrylamide Co-Deposited Magnetic Sporopollenin and Optimization with Response Surface Methodology Approach. J Polym. Environ. 2023, 31(1), 36–49. DOI: 10.1007/s10924-022-02617-9.
- Mehmood, T.; Ahmed, A.; Ahmad, A.; Ahmad, M. S.; Sandhu, M. A. Optimization of Mixed Surfactants-Based β-Carotene Nanoemulsions Using Response Surface Methodology: An Ultrasonic Homogenization Approach. Food Chem. 2018, 253, 179–184. DOI: 10.1016/j.foodchem.2018.01.136.
- Mehmood, T.; Ahmad, A.; Ahmed, A.; Ahmed, Z. Optimization of Olive Oil Based O/W Nanoemulsions Prepared Through Ultrasonic Homogenization: A Response Surface Methodology Approach. Food Chem. 2017, 229, 790–796. DOI: 10.1016/j.foodchem.2017.03.023.
- Mehmood, T. Optimisation of Food Grade Mixed Surfactant‐Based L‐Ascorbic Acid Nanoemulsions Using Response Surface Methodology. IET Nanobiotechnol. 2021, 15(3), 309–317. DOI: 10.1049/nbt2.12014.
- Choudhury, A. R.; Bhattacharyya, M.; Prasad, G. Application of Response Surface Methodology to Understand the Interaction of Media Components During Pullulan Production by Aureobasidium pullulans RBF-4A3. Biocatal. Agric. Biotechnol. 2012, 1(3), 232–237. DOI: 10.1016/j.bcab.2012.02.003.
- Yu, X.; Wang, Y.; Wei, G.; Dong, Y. Media Optimization for Elevated Molecular Weight and Mass Production of Pigment-Free Pullulan. Carbohydr. Polym. 2012, 89(3), 928–934. DOI: 10.1016/j.carbpol.2012.04.038.
- Wu, S.; Chen, J.; Pan, S. Optimization of Fermentation Conditions for the Production of Pullulan by a New Strain of Aureobasidium pullulans Isolated from Sea Mud and Its Characterization. Carbohydr. Polym. 2012, 87(2), 1696–1700. DOI: 10.1016/j.carbpol.2011.09.078.
- Sugumaran, K.; Shobana, P.; Balaji, P. M.; Ponnusami, V.; Gowdhaman, D. Statistical Optimization of Pullulan Production from Asian Palm Kernel and Evaluation of Its Properties. Int. J. Biol. Macromol. 2014, 66, 229–235. DOI: 10.1016/j.ijbiomac.2014.02.045.
- Ju, X.-M.; Wang, D.-H.; Zhang, G.-C.; Cao, D.; Wei, G.-Y. Efficient Pullulan Production by Bioconversion Using Aureobasidium pullulans as the Whole-Cell Catalyst. Appl. Microbiol. Biotechnol. 2015, 99(1), 211–220. DOI: 10.1007/s00253-014-6100-1.
- Ahmed, Z.; Wang, Y.; Ahmad, A.; Khan, S. T.; Nisa, M.; Ahmad, H.; Afreen, A. Kefir and Health: A Contemporary Perspective. Critical Reviews in Food Science and Nutrition. Crit. Rev. Food Sci. Nutr. 2013, 53(5), 422–434. DOI: 10.1080/10408398.2010.540360.
- Yoon, S.; Hong, E.; Kim, S.; Lee, P.; Kim, M.; Yang, H.; Ryu, Y. Optimization of Culture Medium for Enhanced Production of Exopolysaccharide from Aureobasidium pullulans. Bioprocess Biosyst. Eng. 2012, 35(1–2), 167–172. DOI: 10.1007/s00449-011-0620-1.
- Wang, Y.; Wang, J.; Ahmed, Z.; Bai, X.; Wang, J. Complete Genome Sequence of Lactobacillus Kefiranofaciens ZW3. J. Bacteriol. 2011, 193(16), 4280–4281. DOI: 10.1128/JB.05306-11.
- Chen, W.; Gao, L.; Song, L.; Sommerfeld, M.; Hu, Q. An Improved Phenol-Sulfuric Acid Method for the Quantitative Measurement of Total Carbohydrates in Algal Biomass. Algal Res. 2023, 70, 102986. DOI: 10.1016/j.algal.2023.102986.
- Mehmood, T. Optimization of the Canola Oil Based Vitamin E Nanoemulsions Stabilized by Food Grade Mixed Surfactants Using Response Surface Methodology. Food Chem. 2015, 183, 1–7. DOI: 10.1016/j.foodchem.2015.03.021.
- García, A.; Fernández-Sandoval, M. T.; Morales-Guzmán, D.; Martínez-Morales, F.; Trejo-Hernández, M. R. Advances in Exopolysaccharide Production from Marine Bacteria. J. Chem. Technol. Biotechnol. 2022, 97(10), 2694–2705. DOI: 10.1002/jctb.7156.
- Tabet, Z.; Belaadi, A.; Boumaaza, M.; Bourchak, M. Drilling of a Bidirectional Jute Fibre and Cork-Reinforced Polymer Biosandwich Structure: ANN and RSM Approaches for Modelling and Optimization. Int. J. Adv. Manuf. Technol. 2021, 117(11–12), 3819–3839. DOI: 10.1007/s00170-021-07679-y.
- Mitsue, T.; Tachibana, K.; Hara, T.; Fujio, Y. Isolation of Kefiran-Producing Lactic Acid Bacteria from Kefir Grain and Improvement of Kefiran Productivity-Note. Seibutsu-Kogaku Kaishi. 1998, 76(11), 447–450.
- Taniguchi, M.; Nomura, M.; Itaya, T.; Tanaka, T. Kefiran Production by Lactobacillus Kefiranofaciens Under the Culture Conditions Established by Mimicking the Existence and Activities of Yeast in Kefir Grains. Food Sci. Technol. Res. 2001, 7(4), 333–337. DOI: 10.3136/fstr.7.333.
- Amin, N. A. S.; Anggoro, D. D. Optimization of Direct Conversion of Methane to Liquid Fuels Over Cu Loaded W/ZSM-5 Catalyst. Fuel. 2004, 83(4), 487–494. DOI: 10.1016/j.fuel.2003.09.013.