
 ?Mathematical formulae have been encoded as MathML and are displayed in this HTML version using MathJax in order to improve their display. Uncheck the box to turn MathJax off. This feature requires Javascript. Click on a formula to zoom.
ABSTRACT
The analysis of the content of school textbooks, particularly in a time of cross-cultural borrowing, is a growing field restricted by the tools currently available. In this paper, drawing on the analyses of three English year-one mathematics textbooks, we show how two approaches to the analysis of sequential data not only supplement conventional frequency analyses but highlight trends in the content of such textbooks hidden from frequency analyses alone. The first, moving averages, is conventionally used in science to eliminate noise and demonstrate trends in data. The second, Lorenz curves, is typically found in the social sciences to compare different forms of social phenomena. Both, as we show, extend the range of questions that can be meaningfully asked of textbooks. Finally, we speculate as to how both approaches can be used with other forms of ordered classroom data.
Introduction
For many teachers, particularly those of mathematics, textbooks are the primary resource for lesson planning and students’ tasks (Stacey and Vincent Citation2009; Stein and Kim Citation2009). It is not surprising, therefore, that the analysis and comparison of school mathematics textbooks has a long tradition, historically motivated by concerns about the quality or suitability of didactical materials (Patty and Painter Citation1931; Schutter and Spreckelmeyer Citation1959; Williams and Shuff Citation1963). These concerns persist internationally, whether in, for example, Australia (Vincent and Stacey Citation2008), Sweden (Boesen et al. Citation2014; Sidenvall, Lithner, and Jäder Citation2015) or the United States (Huntley and Terrell Citation2014; Tarr et al. Citation2006). More recently, drawing on the results of international tests of achievement, researchers have begun to compare textbooks produced in their own countries with those from more successful educational systems (Ding Citation2016; Li, Chen, and An Citation2009; Yang, Reys, and Wu Citation2010). In so doing, a number have begun to problematize the practice of importing materials developed for use in curricular traditions other than their own (Sayers et al. Citation2019; Wu and Zhang Citation2006). However, despite its ubiquity as a research topic, the methodology of textbook analysis remains limited, an issue we aim to address in this paper.
Broadly speaking, mathematics textbook research has focused on the presentation of either mathematical topics or mathematical processes. A not uncommon example of the former is fractions, with colleagues evaluating either the topic in general, as found in studies of primary textbooks in Kuwait, Japan, the USA (Alajmi Citation2012), Cyprus, Ireland and Taiwan (Charalambous et al. Citation2010), or particular aspects of the topic, as found in examinations of fraction multiplication in middle school textbooks from Korea and the USA (Son and Senk Citation2010), China, Japan and the USA (Li, Chen, and An Citation2009) and Turkey and the USA (Kar et al. Citation2018). With respect to the processes of mathematics, researchers have frequently examined aspects of mathematical reasoning and proof, as in studies of the textbooks of Australia (Stacey and Vincent Citation2009), France and Japan (Miyakawa Citation2017), Finland and Sweden (Bergwall and Hemmi Citation2017) and the United States (Otten et al. Citation2014; Stylianides Citation2009). In sum, these examples highlight the extent to which all manner of school mathematical knowledge has been subjected to some form of textbook analysis, often comparative.
Methodologically, much textbook-related research has employed some form of qualitative description, typically aligned with some form of analytical framework that may be supplemented by frequency analyses, whereby the number of occurrences of particular forms of task is counted and compared, as with our own analyses of English and Swedish year one textbooks (Löwenhielm et al. Citation2017). Yet, while frequency analyses highlight textbooks’ authors’ privileged topics, they show little with respect to how these topics are sequenced (Otten et al. Citation2014). That being said, some scholars have examined, in some way, the distribution of the topic of interest. For example, some have identified, in the sequence of all tasks, the absolute position of the first task of interest (Fujita Citation2001) or the proportion of a textbook covered before such occurrences (Alajmi Citation2012; Li, Chen, and An Citation2009). Others, particularly those involving analyses of textbook series that cross grade boundaries, have examined the percentages of tasks focused on the topic of interest across such series (Borba and Selva Citation2013; Ding Citation2016). Still, such approaches are limited in their offering little beyond the location of the first occurrence of a task or the overall proportion of such tasks within a book. Other scholars, mindful of the problem, have exploited timeline analyses, whereby tasks are presented as dots on a horizontal axis representing the sequence of all tasks within the textbooks. In such a manner, it is possible to see, at a glance, where a topic of interest is emphasized (Huntley and Terrell Citation2014). However, where such dots occur close together, lines may take on a solid appearance and, particularly with respect to comparative analyses, mask subtle differences. Our aim in this paper is to present two previously unconsidered approaches to textbook analysis that both complement frequency analyses and go beyond simple timelines to make transparent the location and sequencing of particular forms of task in ways that facilitate comparative analysis. These are moving averages and an adapted version of Lorenz curves. In so doing, we offer examples from analyses of three mathematics textbooks used in English year-one classrooms, although the principles we establish are applicable to other educational contexts.
The material on which the proposed analyses are based
As indicated above, to illustrate our use of moving averages and adapted Lorenz curves in the analyses of textbooks, we present analyses of three textbooks currently used in the teaching of year-one children in England.Footnote1 Since the purpose of this paper is the use of two hitherto unconsidered approaches to textbook analysis, the provenance of the books and decisions concerning their selection are immaterial and will not be discussed further, other than to say that one is a long-standing and popular English-authored textbook, Abacus, and two are recent adaptations of Singaporean imports, Inspire Maths (hereafter, IM) and Maths – No Problem (hereafter MNP). Importantly, the books were analysed from the perspective of the opportunities they offer for the development of foundational number sense or FoNS (Andrews and Sayers Citation2015). FoNS, summarized in , emerged from a systematic constant comparison analysis of around 400 peer-reviewed articles from the fields of mathematics education, early childhood education, educational psychology and special needs education. The goal was to identify a set of simple-to-operationalize number-related and curriculum-independent competences that all year one children need to acquire for later mathematical learning. Our aim, with respect to textbook analysis, was to identify not only the frequencies of FoNS-related opportunities children receive but where, during the school year, such opportunities occur.
Table 1. Summary definitions of the eight FoNS categories.
As with all research, the quality of any output lies in the choice of unit of analysis. With respect to textbooks, some scholars have argued that counting the number of pages given to a mathematical topic is sufficient (Bråting, Madej, and Hemmi Citation2019). Our view, however, is that textbooks reflect their authors’ perspectives on the sequencing of mathematical ideas and within such sequences are tasks intended to address particular objectives, including, inter alia, the consolidation of skills, the introduction of new material and opportunities for problem-solving. In addition, the particular nature of the FoNS categories means that not all would be represented as chapters or sections of textbooks. Therefore, the unit of analysis became any task that demands a response from the child. Thus, worked examples requiring students to read were included, while tasks in, for example, teachers’ guides were not.
Every task in each book was coded against the different FoNS categories. This led to each task yielding a sequence of ones and zeros, according to the presence or absence of each category in that task. One FoNS category, on which the following is based, is addition and subtraction within the integer range 0–20. The frequencies of this category, both absolute and relative, can be seen in .
Table 2. Frequencies of simple addition and subtraction tasks in the three books.
The figures of highlight the emphases on simple arithmetic found in the three books. Firstly, two of the books, IM and MNP, comprise significantly more tasks overall than the English-authored Abacus. Indeed, IM comprises more than 60% more tasks than Abacus. IM and MNP also share similarities in terms of the absolute number of arithmetic-related tasks and the proportion of such tasks within the whole books. However, despite the relative paucity of tasks overall, Abacus comprises a significantly greater proportion of arithmetic-related tasks than either IM or MNP, with, in relative terms, double the proportion of such tasks. Such variation, we argue, is likely to represent culturally different perspective on the role of simple arithmetic in the mathematical experiences of year one children. However, as indicated above, frequency analyses alone fail to offer any indication as to where in the sequence of all tasks such learning opportunities occur. This dissatisfaction led us to consider different ways of examining the sequencing of tasks within textbooks. Admittedly, some scholars have addressed mathematics textbooks’ structural sequencing, but, as with Valverde’s et al. (Citation2002) well-known study, have presented their results in charts of such complexity that they were effectively impossible to interpret. Our goal in this paper is to address the presentation of textbooks’ structural sequencing in simple to interpret and transparent ways. In the following, therefore, we show how, respectively, adapted Lorenz curves and moving averages address this problem, with both highlighting the distribution and sequencing of textbook material in visually powerful ways.
Adapted Lorenz curves
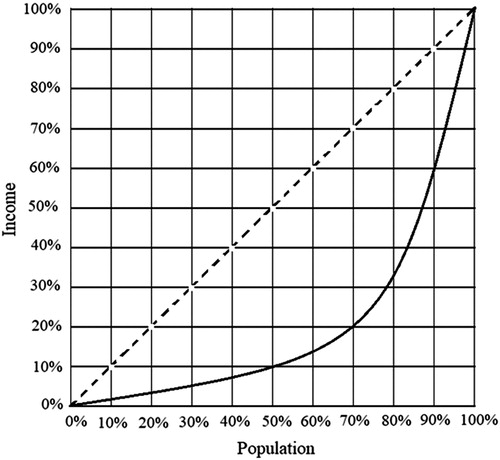
Lorenz curves have been widely used to ‘describe and compare inequality in income or wealth distribution’ (Beach and Davidson Citation1983, 723). In this context, they are graphical representations of the cumulative distribution of wealth (Aaberge Citation2000; Delbosc and Currie Citation2011) and show the changes in the income of a population when all income recipients are ordered from lowest to highest (Hutchens Citation1991, 39). , adapted from Delbosc and Currie (Citation2011), is a hypothetical income-related Lorenz curve showing clearly that 100% of all income is distributed across 100% of the population, where the ‘dashed line represents a population of perfectly equitable income distribution (and) the solid curved line represents an inequitable distribution of wealth’ (Delbosc and Currie Citation2011, 1253). Indeed, it can be seen clearly that in this hypothetical instance 50% of the population receives only 10% of the total income.
Figure 1. A population income distribution (Adapted from Delbosc and Currie Citation2011).
Over the last two decades, scholars in various disciplines have shown the power of Lorenz curves to highlight how some specified resource is distributed within a population. These disciplines have included environment-related research concerning transport (Delbosc and Currie Citation2011), carbon emissions (Groot Citation2010) and electricity consumption (Jacobson, Milman, and Kammen Citation2005). Lorenz curves have also been found in agricultural studies focused on the yields of different fields (Sadras and Bongiovanni Citation2004), fishing quotas (Abayomi and Yandle Citation2012) and forestry management (Valbuena et al. Citation2014). They have also been found in health care studies concerning the prevalence of dental caries (Poulsen, Heidmann, and Vaeth Citation2001). However, to our knowledge, no one has shown how Lorenz curves may facilitate our understanding of the structure and emphases of tasks in school textbooks.
Mathematically, the Lorenz curve, which shows a relative cumulative distribution, represents the proportional totality of all sorted or ordered data. This means that the curve will always start at the co-ordinate (0; 0) and steadily increase until its endpoint in (100%; 100%). Moreover, as can be seen in , because all data are ordered by magnitude, from smallest to largest, the slope increases monotonically. That is, the curve is always on an upwards trajectory. However, with respect to our analysis of textbooks, the goal is to show the cumulative distribution of those tasks coded for particular content as a proportion of all tasks in the book. Consequently, our cumulative distribution curves will have most of the properties of the Lorenz curve with the exception that it will not necessarily be strictly increasing, although it can never be decreasing, nor reach 100% on the vertical axis unless every task in a book is coded for the category under scrutiny. For this reason, we refer to this as an adapted Lorenz curve. Procedurally, assuming that each task in a book is coded 1 or 0 according to the presence or absence of the characteristic of interest, the adapted Lorenz curve shows the cumulative or ‘running’ total of all the proportions of all the tasks in the book.
Moving averages
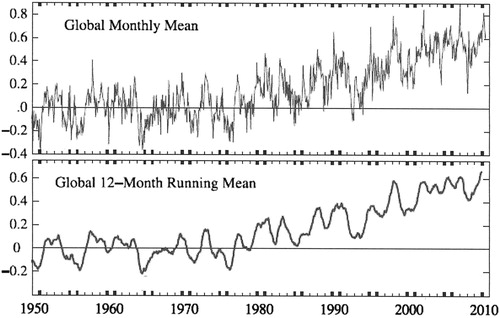
Moving averages is a well-established technique for displaying visually how particular characteristics of a data set evolve over time. It is typically used to ‘understand the underlying dynamics, forecast future events, and control future events’ with respect to stochastic processes (Fan and Yao Citation2003, 9) and a familiar context would be graphs showing temperature variation over time. By way of illustration, shows two graphs adapted from Hansen et al. (Citation2010, 13). The upper graph, based on NASA data, shows the monthly variation in global temperatures from a 1960 zero point, while the lower shows the same data as a moving average based on a 12-month cycle. It can be seen clearly that the moving average smooths out the noise of particular and, possibly, atypical variations to show trends over time. The time period under scrutiny, whether a month, a decade or a millennium, is determined by the researcher’s aims. However, while commonplace in earth sciences, moving averages are rare in the social sciences, although Vasileiadou and Vliegenthart (Citation2014) employed similar procedures in their analysis of social processes, and, to our knowledge, have yet to be used in the analysis of school textbooks.
Figure 2. Global temperature variation from 1950 (adapted from Hansen et al. Citation2010).
Although school mathematics textbooks do not strictly present stochastic events, the tasks within them occur in a time-ordered sequence, though not temporally equidistant, and are thus amenable to a moving averages analysis. The aim of a moving average is to replace each individual data point with the arithmetical mean of the point itself and a predetermined number of points either side of the point of interest. A mathematical detail is that the calculation of an arithmetic mean is identical to calculating a proportion; and for this reason, the moving averages are applicable to statistical variables on both nominal and metric scales. This process is represented mathematically in Equation (1), where the value is the arithmetical mean of the point itself,
, and
points either side of it. That is, their sum, being the total of all these points, is divided by
.
(1)
(1)
In sum, the aim of a moving average is to present complex and changeable data in an accessible and interpretable manner that shows trends clearly and unambiguously.Footnote2 With respect to the analysis of textbooks, a key aspect of this calculation concerns the divisor shown in Equation (1), which represents a window of time, whereby every task within that window is included in the calculation. For example, Equation (2) represents all the opportunities available to students in, say, one week’s work.
(2)
(2)
This choice of window is important for both psychological and technical reasons. For example, with respect to the former, one week’s workload may be a reasonable window for an individual student, who may remember details from all lessons within such a short period but forget details from longer sequences. From the technical perspective, however, moving averages based on a week’s tasks may be too noisy for important patterns to emerge. To illustrate this latter point, shows four curves, each representing a different window for the opportunities for children to engage with arithmetical operations within the range 0–20 identified in Abacus. These four windows, acknowledging that a school year can be construed as roughly ten months, 40 weeks or 200 school days, yield the graphs for moving averages based on a month, a week, a day and the trivial case of the individual task. In this latter case, the moving average exploits a window of width one, with no tasks included from either side and is equivalent to the timeline exploited by Huntley and Terrell (Citation2014).
Figure 3. Moving averages for different window widths.
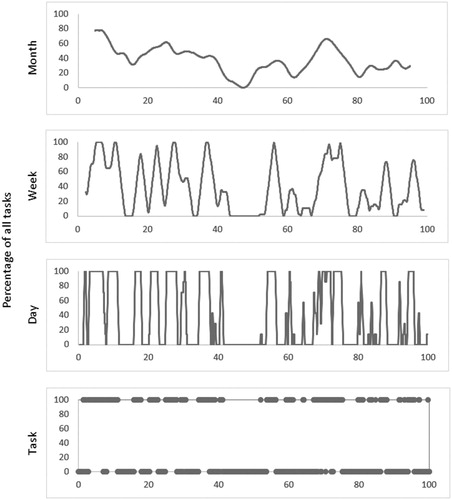
The graphs in show clearly the impact of these different window lengths. A broad window, such as a month, smooths out much short-term variation and presents curves with shallow gradients. Importantly, it shows clearly that there is no month during which every task addresses arithmetical operations within the range 0–20. By way of contrast, a narrow window, such as a day, emphasizes variation and presents steep gradients showing almost instant shifts from days with such tasks and days without. It also shows the many days during which all tasks address the same objective. Between these two lies the weekly window, with characteristics falling between those of month and day. Here, it can be seen that there are several weeks during which every analysed task addresses arithmetical operations within the range 0–20.
These differences highlight the importance of choosing a window width that is sensitive to both the research question and the context of the data. The final diagram in , where the window is of width one, is effectively a representation of a scatterplot of ones and zeros along a timeline. One advantage of this diagram is that it gives a picture that is fine-grained down to occurrence of individual codes. However, this is also its drawback. For larger data sets, the graphic in the timeline becomes too dense, making it difficult to discern any useful information. Using moving averages avoids this drawback. That being said, since not even the most diligent of pupils is likely to complete every task, we concede Mesa’s (Citation2004) and Valverde et al. (Citation2002, 2) point that ‘textbooks exert probabilistic influences on the educational opportunities that take place in the classrooms in which they are used’. This means that the curves found in show the full extent of the opportunities the different books offer and are unlikely to match what children are asked to do. In other words, acknowledging that a moving average showing ‘above zero’ confirms the existence of the coded characteristic during that time period, the curves in represent the complete range of opportunities on the coded characteristic available to students during the specified period.
Content analysis using moving averages and adapted Lorenz curves
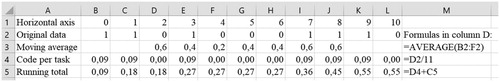
In order to clarify how the two procedures are applied to the real data of textbooks, we first offer a hypothetical example to demonstrate how the figures for moving averages and adapted Lorenz curves can be calculated on a conventional spreadsheet. The second row of shows the hypothetical codes applied to 11 hypothetical tasks arranged in order. The figure 11 was chosen because it offers 10 unit-spaces on the horizontal axis, ranging from zero to one, equivalent to 100% of all tasks. The third row shows the moving average based on a window of width five, equivalent to two points either side of the point of interest and explains the empty cells at the beginning and end of the row. In particular, the formula in cell M3 shows the calculation for the moving average based around the third task. This calculation, due to the size of the window we have chosen to use, can only begin with the third task and must end with the eighth, otherwise the spreadsheet would be searching for data that do not exist. The fourth row, based on the formula in cell M4, shows the result of dividing the code for each cell by the total number of tasks, in this case 11, and represents the proportion of the textbook given to each coded task. The fifth row, based on the formula in cell M5, shows the cumulative or running total that will yield an adapted Lorenz curve. Finally, he graph for the moving averages is created by plotting the figures in row 3 against those in row 1 being the horizontal axis (as task number or in some other scale), while the adapted Lorenz curve is the plot of the figures in row 5 against those in row 1.
Figure 4. Calculating moving averages and an adapted Lorenz curve (= running total) on a spreadsheet.
Comparing different textbooks using adapted Lorenz curves and moving averages
In this section, we show not only how moving average curves and the adapted Lorenz curves enable us to go beyond standard frequency analyses to highlight the sequencing and structural emphases of the content of mathematics textbooks but also how they facilitate comparative analyses of any time-dependent or sequenced data.
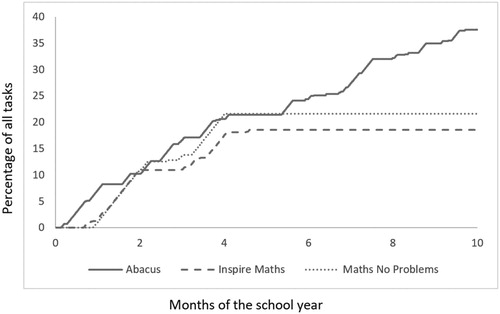
The solid curve of shows the adapted Lorenz curve for the tasks found in Abacus, the dashed curve for those in IM and the dotted curve for the tasks of MNP. In interpreting these graphs, it is important to note that any horizontal line segment represents a time period when no tasks address addition and subtraction in the range 0–20. Broadly speaking, the graphs show quite clearly that the three textbooks have similar structural emphases throughout the first four months of the school year. Indeed, by the end of this period, approximately 20% of all the tasks in each book had addressed addition and subtraction of numbers in the range 0–20. That said, it is also clear that during this four-month period the graph for Abacus shows several cycles of topic-related activity followed by short breaks of a week or two, while both IM and MNP offer no such tasks for almost a month, before presenting two periods, of around five or six weeks and separated by a fallow period of almost a month, in which such material is covered. After the fourth month, neither book offers any further tasks on the topic, while, from the middle of the sixth month until the end of the school year, Abacus comprises further repeated cycles of activity. Thus, by the end of the school year, almost 40% of all tasks in Abacus had addressed the topic in a largely continuous manner, which represents a very different profile from the very similar profiles of IM and MNP. This example illustrates that when using adapted Lorenz curves, there is no point in showing all up to 100% on the vertical axis as is the case for the original Lorenz curve.
Figure 5. Adapted Lorenz curves showing the distribution of simple arithmetical operations tasks across three textbooks.
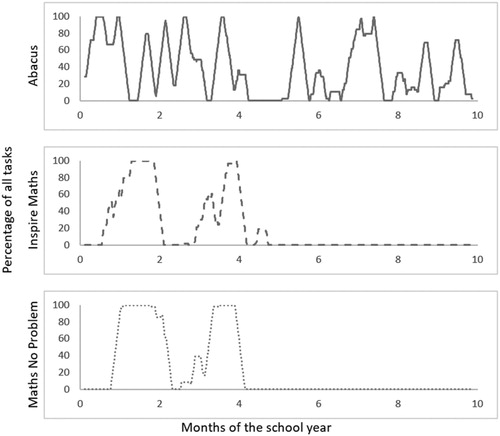
shows the graphs of the moving averages for the three textbooks, with respect to addition and subtraction of whole numbers within the interval 0–20 calculated with a window of one week. It can be seen that the curve for Abacus is the same as that shown in and represents the arithmetic-related opportunities for pupils over the course of the academic year. The graphs highlight similar characteristics to the adapted Lorenz curves shown in . That is, they show clearly how both IM and MNP end all opportunities for children to engage with simple addition and subtraction by the end of the fourth month, while Abacus, with a break throughout the fifth month, offers such opportunities throughout the school year. The graphs also show that within IM and MNP opportunities fall, effectively, into two extended opportunities during these first four months, while Abacus comprises many more, but shorter, periods.
Figure 6. Moving averages curves showing the distribution of simple arithmetical operations tasks across three textbooks.
In summary, both moving averages and adapted Lorenz curves offer similar insights unlikely to emerge from typical frequency analyses. For example, moving averages and adapted Lorenz curves visualize differences between textbooks in both emphasis and location. However, there are differences between the two presented methods. The first is that the horizontal line segments of the adapted Lorenz curves give precise indications as to the periods of the school year when no tasks address the topic under consideration. The second is that the same curves show not only the proportions of a textbook given over to a topic but also their temporal locations. The third is that the moving averages curves are more dramatic in their variation and, therefore, simpler to interpret, with well-defined peaks, albeit defined by the choice of window, and troughs indicative of particular temporal emphases, albeit with no indication of the proportions found in the adapted Lorenz curves. That is, while the adapted Lorenz curves may be more precise, the moving averages may be more user-friendly. Moreover, the adapted Lorenz curves are not dependent on any window size, making them simpler to compute in comparison with moving averages.
Comparing different characteristics within a textbook using adapted Lorenz curves and moving averages
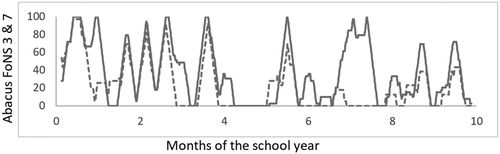
In the above, we have shown how a single characteristic, addition and subtraction within numbers 0-20, can be compared across textbooks. We now show how a single book may distribute two or more characteristics across its length. and show, with respect to Abacus, the adapted Lorenz curve and moving average distribution of, on the one hand, addition and subtraction within numbers 0–20 (FoNS category 7) and, on the other hand, the relationship between number and quantity (FoNS category 3). Here, the solid line represents simple addition and subtraction (the same as in and ) and the dotted line represents the relationship between number and quantity. The two graphs show clearly that during the first half of the textbook, tasks with an emphasis on the relationship between number and quantity also address simple addition and subtraction, presumably to support children’s arithmetical development, while during the second half of the book, arithmetical calculations are less frequently accompanied by such a focus, due, presumably, to increasing expectations of arithmetical independence. In short, the juxtaposition of the two curves (for each graph) shows a clear developmental trend in the textbook’s structure and, of course, are not limited to just two codes. Several could be juxtaposed in the same way to expose or highlight didactical relationships.
Figure 7. A comparison of two nominal codes in the same adapted Lorenz curve.
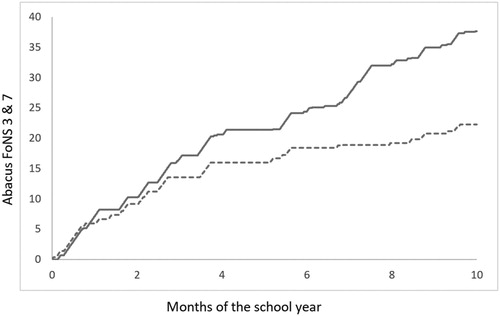
Figure 8. A comparison of two nominal codes in the same moving averages diagram.
Discussion
Before discussing the results in detail, we remind readers that teachers decide what tasks children should tackle and in what order. That is, there is no guarantee that any task presented in any textbook, if it is tackled at all, will be tackled in the order envisaged by its authors. Consequently, all textbook analyses, irrespective of the approach adopted, are probabilistic and, essentially, draw on the following questions, both of which focus on the opportunities embedded in textbooks, ‘what would students learn if their mathematics classes were to cover all the textbook sections in the order given? What would students learn if they had to solve all the exercises in the textbook?’ (Mesa Citation2004, 255–256). In this article, we have shown how two unrelated graphical approaches to data distribution, widely used in other fields, can be applied to the content analysis of school mathematics textbooks to complement standard frequency analyses of the tasks therein. In so doing, we have shown that both approaches offer analytical tools for supporting Valverde et al. (Citation2002) ‘probabilistic’ analysis of the ‘likely impact of the text on the users’ (Stacey and Vincent Citation2009, 276).
Importantly, both approaches simplify the process of comparison, which is particularly important when textbooks are unregulated, as is the case in England, and where teachers may have to choose from a plethora of textbooks, all intended for the same audience but with the possibility of very different learning opportunities for children (Charalambous et al. Citation2010; Huntley and Terrell Citation2014; Tarr et al. Citation2006). The analyses presented above, albeit brief, show well how both moving averages and adapted Lorenz curves can highlight differences both in emphasis and sequencing of textbooks’ content. Moreover, both approaches are general methods of content analysis and are not restricted to textbooks, with the only criterion being that data must be sequenced, and both complement frequency analyses to show how codes are distributed along the timeline of units of analysis.
In conventional content analyses, visual presentations of distributions along timelines are rare, despite their being implicated in the identification of causal relationships (Cohen, Manion, and Morrison Citation2007; Wilkinson and Friendly Citation2009). Where concessions to such presentations are made, they typically arise in the context of textbooks analysed across school years and the results displayed in a table (Borba and Selva Citation2013) or some form of graphical diagram (Ding Citation2016; Huntley and Terrell Citation2014). In fact, the tables in Borba and Selva (Citation2013) and the diagrams in Ding (Citation2016) are special cases of the moving averages diagram with non-overlapping windows, whose widths are chapters, booklets or parts of textbooks-series. Also, the diagram in Huntley and Terrell (Citation2014) is a special case of a moving average with window width being single units of analysis. However, such presentations, we argue, lack the visual authority of either the moving average or the adapted Lorenz curves, which highlight well the distribution of events. In this respect, this study has shown that while first-order statistics like frequencies are important tools in content analysis second-order statistics related to distribution widens the set of possible research questions that can be addressed.
Implications for the analysis of other forms of classroom data
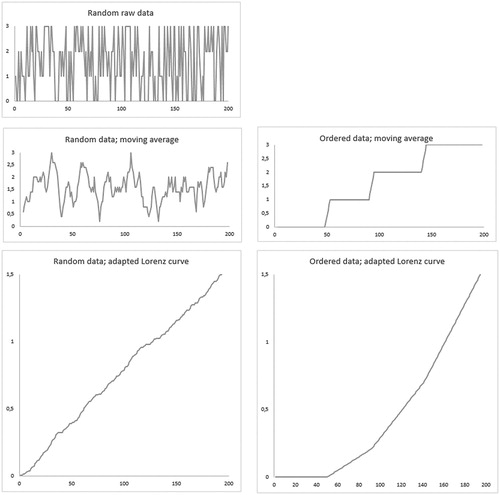
Finally, having examined the use of moving averages and adapted Lorenz curves in the context of textbooks, we now consider, speculatively, how both can be applied to other forms of classroom data. For example, classroom discourse, including speech, gestures and actions, can be construed as occurring along a timeline and coded according to, say, different levels of intensity or proficiency (see, e.g. Holsti Citation1968, 651f). In this respect, Hunt et al. (Citation2016) analysed the development of a child’s fractions-related vocabulary against four hierarchical proficiency levels. However, Hunt et al.’s (Citation2016) analysis drew on fewer than 20 data points, which are too few for the graphical approaches discussed above to show any meaningful trends. Consequently, in order to illustrate the possibilities provided by moving averages and adapted Lorenz curves, we generated a random set of 200 data points, each representing, for the sake of argument, one of Hunt et al.’s (Citation2016) four proficiency levels, although they could equally apply to a hierarchy of teacher questions. The issue of importance is that there is both ordinality and temporality to the data.
shows various graphs for this hypothetical data set. The left-hand column shows three graphs for the random data, while the right-hand column shows two graphs for a data set ordered entirely by the principle of educational progression, with all the codes in the first quarter being 0, all those in the second quarter being 1 and so on. The moving averages curve for the random data, calculated with a window of five units, shows some smoothing of the random curve. However, it is clear that further smoothing due to wider windows, is likely only to confirm that the curve will approach a horizontal line due, entirely, to the random nature of the data. The adapted Lorenz curve confirms this with its, effectively, straight line and moderate gradient showing no varying trends. However, the graphs of the ordered data, show progression, with the moving average being stepped and the adapted Lorenz curve comprising four straight sections of different and increasing gradients. In other words, with large data sets based, effectively on ordinal scales, both forms of graphical representation offer insights into, say, educational progression. This means that moving averages and adapted Lorenz curves allow us to move beyond frequency analyses to examine trends (Holsti Citation1968) or ‘the incidence of particular words, concepts, categories over time or over texts’ (Cohen, Manion, and Morrison Citation2007, 482).
Figure 9. Hypothetical distributions of 200 ordinal codes in levels 0–3, one random and one ordered.
Concluding remarks
In this article, we have shown how moving averages and adapted Lorenz curves, analytical tools not typically associated with the analysis of textbooks, yield insights left hidden by conventional frequency analyses into how textbook authors emphasize and structure mathematical content. We have also shown, somewhat speculatively, how both approaches can be adapted to other forms of classroom data arranged on some form of timeline. Finally, we have shown how both approaches can accommodate data presented on either nominal or ordinal scales, making them relevant to almost all forms of classroom data, whether textbook or discourse, in the expectation that they will reveal insights lost if only frequency analyses are employed.
Supplemental Material
Download MS Excel (192.3 KB)Acknowledgement
The authors gratefully acknowledge the financial support of the Swedish Research Council (Vetenskapsrådet), project grant 2015-01066, without which the work reported in this paper would not have been possible.
Disclosure statement
No potential conflict of interest was reported by the author(s).
Additional information
Funding
Notes
1 In England, children commence year-one in the school-year in which they turn five.
2 The computations necessary for both calculating moving averages and drawing graphs, can be done using ordinary spreadsheet software, where one row (or column) contains the original data and the other row (column) contains the calculated moving averages using Equation (1).
References
- Aaberge, Rolf. 2000. “Characterizations of Lorenz Curves and Income Distributions.” Social Choice & Welfare 17 (4): 639. doi:10.1007/s003550000046.
- Abayomi, Kobl, and Tracy Yandle. 2012. “Using Conditional Lorenz Curves to Examine Consolidation in New Zealand Commercial Fishing.” Marine Resource Economics 27 (4): 303–321. doi:10.5950/0738-1360-27.4.303.
- Alajmi, Amal Hussain. 2012. “How do Elementary Textbooks Address Fractions? A Review of Mathematics Textbooks in the USA, Japan, and Kuwait.” Educational Studies in Mathematics 79 (2): 239–261. doi:10.1007/s10649-011-9342-1.
- Andrews, Paul, and Judy Sayers. 2015. “Identifying Opportunities for Grade One Children to Acquire Foundational Number Sense: Developing a Framework for Cross Cultural Classroom Analyses.” Early Childhood Education Journal 43 (4): 257–267. doi:10.1007/s10643-014-0653-6.
- Beach, Charles M., and Russell Davidson. 1983. “Distribution-free Statistical Inference with Lorenz Curves and Income Shares.” The Review of Economic Studies 50 (4): 723–735. doi:10.2307/2297772.
- Bergwall, Andreas, and Kirsti Hemmi. 2017. “The State of Proof in Finnish and Swedish Mathematics Textbooks—Capturing Differences in Approaches to Upper-Secondary Integral Calculus.” Mathematical Thinking and Learning 19 (1): 1–18. doi:10.1080/10986065.2017.1258615.
- Boesen, Jesper, Ola Helenius, Ewa Bergqvist, Tomas Bergqvist, Johan Lithner, Torulf Palm, and Björn Palmberg. 2014. “Developing Mathematical Competence: From the Intended to the Enacted Curriculum.” The Journal of Mathematical Behavior 33 (1): 72–87. doi:10.1016/j.jmathb.2013.10.001.
- Borba, Rute, and Ana Selva. 2013. “Analysis of the Role of the Calculator in Brazilian Textbooks.” ZDM 45 (5): 737–750. doi:10.1007/s11858-013-0517-3.
- Bråting, Kajsa, Lars Madej, and Kirsti Hemmi. 2019. “Development of Algebraic Thinking: Opportunities Offered by the Swedish Curriculum and Elementary Mathematics Textbooks.” Nordisk Matematikkdidaktikk, NOMAD:[Nordic Studies in Mathematics Education] 24 (1): 27–49.
- Charalambous, Charalambos Y., Seán Delaney, Hui-Yu Hsu, and Vilma Mesa. 2010. “A Comparative Analysis of the Addition and Subtraction of Fractions in Textbooks From Three Countries.” Mathematical Thinking and Learning 12 (2): 117–151. doi:10.1080/10986060903460070.
- Cohen, Louis, Lawrence Manion, and Keith Morrison. 2007. Research Methods in Education [Electronic Resource]. 6. ed. ed. London: Routledge.
- Delbosc, Alexa, and Graham Currie. 2011. “Using Lorenz Curves to Assess Public Transport Equity.” Journal of Transport Geography 19 (6): 1252–1259. doi:10.1016/j.jtrangeo.2011.02.008.
- Ding, Meixia. 2016. “Opportunities to Learn: Inverse Relations in U.S. and Chinese Textbooks.” Mathematical Thinking and Learning 18 (1): 45–68. doi:10.1080/10986065.2016.1107819.
- Fan, Jianqing, and Qiwei Yao. 2003. Nonlinear Time Series: Nonparametric and Parametric Methods. New York: Springer.
- Fujita, Taro. 2001. “The Order of Theorems in the Teaching of Euclidean Geometry: Learning From Developments in Textbooks in the Early 20th Century.” ZDM 33 (6): 196–203. doi:10.1007/BF02655671.
- Groot, Loek. 2010. “Carbon Lorenz Curves.” Resource and Energy Economics 32 (1): 45–64. doi:10.1016/j.reseneeco.2009.07.001.
- Hansen, James, Reto Ruedy, Mki Sato, and Ken Lo. 2010. “Global Surface Temperature Change.” Reviews of Geophysics 48: 4. doi:10.1029/2010RG000345.
- Holsti, Ole R. 1968. “Content Analysis.” In The Handbook of Social Psychology. Vol. 2, Research Methods, edited by Elliot Aronson and Gardner Lindzey, 596–692. Reading, MA:Addison-Wesley.
- Hunt, Jessica H., Arla Westenskow, Juanita Silva, and Jasmine Welch-Ptak. 2016. “Levels of Participatory Conception of Fractional Quantity along a Purposefully Sequenced Series of Equal Sharing Tasks: Stu’s Trajectory.” The Journal of Mathematical Behavior 41: 45–67. doi:10.1016/j.jmathb.2015.11.004.
- Huntley, Mary Ann, and Maria S. Terrell. 2014. “One-Step and Multi-Step Linear Equations: A Content Analysis of Five Textbook Series.” ZDM 46 (5): 751–766. doi:10.1007/s11858-014-0627-6.
- Hutchens, Robert M. 1991. “Segregation Curves, Lorenz Curves, and Inequality in the Distribution of People across Occupations.” Mathematical Social Sciences 21 (1): 31–51. doi:10.1016/0165-4896(91)90038-S.
- Jacobson, Arne, Anita D. Milman, and Daniel M. Kammen. 2005. “Letting the (Energy) Gini Out of the Bottle: Lorenz Curves of Cumulative Electricity Consumption and Gini Coefficients as Metrics of Energy Distribution and Equity.” Energy Policy 33 (14): 1825–1832. doi:10.1016/j.enpol.2004.02.017.
- Kar, T., G. Güler, C. Şen, and E. Özdemir. 2018. “Comparing the Development of the Multiplication of Fractions in Turkish and American Textbooks.” International Journal of Mathematical Education in Science and Technology 49 (2): 200–226. doi:10.1080/0020739X.2017.1355993.
- Li, Yeping, Xi Chen, and Song An. 2009. “Conceptualizing and Organizing Content for Teaching and Learning in Selected Chinese, Japanese and US Mathematics Textbooks: The Case of Fraction Division.” ZDM 41 (6): 809–826. doi:10.1007/s11858-009-0177-5.
- Löwenhielm, A., Gosia Marschall, Judy Sayers, and Paul Andrews. 2017. “Opportunities to Acquire Foundational Number Sense: A Quantitative Comparison of Popular English and Swedish Textbooks.” In Proceedings of the Tenth Congress of the European Society for Research in Mathematics Education, edited by T. Dooley and G. Gueudet, 371–378. Dublin: Dublin City University.
- Mesa, Vilma. 2004. “Characterizing Practices Associated with Functions in Middle School Textbooks: An Empirical Approach.” Educational Studies in Mathematics 56 (2): 255–286. doi:10.1023/B:EDUC.0000040409.63571.56.
- Miyakawa, Takeshi. 2017. “Comparative Analysis on the Nature of Proof to be Taught in Geometry: The Cases of French and Japanese Lower Secondary Schools.” Educational Studies in Mathematics 94 (1): 37–54. doi:10.1007/s10649-016-9711-x.
- Otten, Samuel, Nicholas J. Gilbertson, Lorraine M. Males, and D. Lee Clark. 2014. “The Mathematical Nature of Reasoning-and-Proving Opportunities in Geometry Textbooks.” Mathematical Thinking and Learning 16 (1): 51–79. doi:10.1080/10986065.2014.857802.
- Patty, W. W., and W. I. Painter. 1931. “Improving our Method of Selecting High-School Textbooks.” The Journal of Educational Research 24 (1): 23–32. doi:10.1080/00220671.1931.10880178.
- Poulsen, S., J. Heidmann, and M. Vaeth. 2001. “Lorenz Curves and Their Use in Describing the Distribution of ‘the Total Burden’ of Dental Caries in a Population.” Community Dental Health 18 (2): 68–71.
- Sadras, Victor, and Rodolfo Bongiovanni. 2004. “Use of Lorenz Curves and Gini Coefficients to Assess Yield Inequality Within Paddocks.” Field Crops Research 90 (2-3): 303–310. doi:10.1016/j.fcr.2004.04.003.
- Sayers, Judy, Jöran Petersson, Eva Rosenqvist, and Paul Andrews. 2019. “Opportunities to Learn Foundational Number Sense in Three Swedish Year One Textbooks: Implications for the Importation of Overseas-Authored Materials.” International Journal of Mathematical Education in Science and Technology, doi:10.1080/0020739X.2019.1688406.
- Schutter, Charles Henry, and Richard L. Spreckelmeyer. 1959. Teaching the Third R: A Comparative Study of American and European Textbooks in Arithmetic. Washington: Council for Basic Education.
- Sidenvall, Johan, Johan Lithner, and Jonas Jäder. 2015. “Students’ Reasoning in Mathematics Textbook Task-Solving.” International Journal of Mathematical Education in Science and Technology 46 (4): 533–552. doi:10.1080/0020739X.2014.992986.
- Son, Ji-Won, and Sharon L. Senk. 2010. “How Reform Curricula in the USA and Korea Present Multiplication and Division of Fractions.” Educational Studies in Mathematics 74 (2): 117–142. doi:10.1007/s10649-010-9229-6.
- Stacey, Kaye, and Jill Vincent. 2009. “Modes of Reasoning in Explanations in Australian Eighth-Grade Mathematics Textbooks.” Educational Studies in Mathematics 72 (3): 271–288. doi:10.1007/s10649-009-9193-1.
- Stein, Mary Kay, and Gooyeon Kim. 2009. “The Role of Mathematics Curriculum Materials in Large-Scale Urban Reform.” In Mathematics Teachers at Work: Connecting Curriculum Materials and Classroom Instruction, edited by J. Remillard, B. Herbel-Eisenmann, and G. Lloyd, 37–55. New York: Routledge.
- Stylianides, Gabriel J. 2009. “Reasoning-and-Proving in School Mathematics Textbooks.” Mathematical Thinking and Learning 11 (4): 258–288. doi:10.1080/10986060903253954.
- Tarr, James E., Óscar Chávez, Robert E. Reys, and Barbara J. Reys. 2006. “From the Written to the Enacted Curricula: The Intermediary Role of Middle School Mathematics Teachers in Shaping Students’ Opportunity to Learn.” School Science and Mathematics 106 (4): 191–201. doi:10.1111/j.1949-8594.2006.tb18075.x.
- Valbuena, Rubén, Jari Vauhkonen, Petteri Packalen, Juho Pitkänen, and Matti Maltamo. 2014. “Comparison of Airborne Laser Scanning Methods for Estimating Forest Structure Indicators Based on Lorenz Curves.” ISPRS Journal of Photogrammetry and Remote Sensing 95: 23–33. doi:10.1016/j.isprsjprs.2014.06.002.
- Valverde, Gilbert A., Leonard J. Bianchi, Richard G. Wolfe, William H. Schmidt, and Richard T. Houang. 2002. According to the Book: Using TIMSS to Investigate the Translation of Policy Into Practice Through the World of Textbooks. Dordrecht: Kluwer Academic Publishers.
- Vasileiadou, Eleftheria, and Rens Vliegenthart. 2014. “Studying Dynamic Social Processes with ARIMA Modeling.” International Journal of Social Research Methodology 17 (6): 693–708. doi:10.1080/13645579.2013.816257.
- Vincent, Jill, and Kaye Stacey. 2008. “Do Mathematics Textbooks Cultivate Shallow Teaching? Applying the TIMSS Video Study Criteria to Australian Eighth-Grade Mathematics Textbooks.” Mathematics Education Research Journal 20 (1): 82–107. doi: 10.1007/BF03217470
- Wilkinson, Leland, and Michael Friendly. 2009. “The History of the Cluster Heat Map.” The American Statistician 63 (2): 179–184. doi:10.1198/tas.2009.0033.
- Williams, Emmet D., and Robert V. Shuff. 1963. “Comparative Study of SMSG and Traditional Mathematics Text Material.” The Mathematics Teacher 56 (7): 495–504. doi: 10.5951/MT.56.7.0495
- Wu, Margaret, and Dianzhou Zhang. 2006. “Overview of Curricular in the West and East.” In Mathematics Education in Different Cultural Traditions – a Comparative Study of East Asia and the West: The 13th ICMI Study, edited by F. K. S. Leung, K. Graf, and F. J. Lopez-Real, 181–193. New York, PA: Springer.
- Yang, Der-Ching, Robert E. Reys, and Li-Lin Wu. 2010. “Comparing the Development of Fractions in the Fifth-and Sixth-Graders’ Textbooks of Singapore, Taiwan, and the USA.” School Science and Mathematics 110 (3): 118–127. doi:10.1111/j.1949-8594.2010.00015.x.