
 ?Mathematical formulae have been encoded as MathML and are displayed in this HTML version using MathJax in order to improve their display. Uncheck the box to turn MathJax off. This feature requires Javascript. Click on a formula to zoom.
ABSTRACT
Thirty samples of Cabernet Sauvignon Mexican wines from 5 wine regions, 19 wineries and vintage between 2004 and 2012 were characterised regarding total phenolic compounds (TPC), anthocyanins (AC), tannins (TC), flavonoids (FC) and antioxidant capacity (ABTS and DPPH assays). Samples were processed using Fourier transform mid-infrared spectroscopy combined with partial least squares regression (PLS1 and PLS2) and principal components regression algorithms to obtain one optimised chemometric model for each algorithm. The spectral region selected for each model was between 1550 and 824 cm−1. The PLS1 model showed the best predictive capacity for simultaneous prediction of the six parameters. Excellent values of the coefficient of determination in validation (Rv2; 0.93–0.95) and residual predictive deviation (RPD; 4.28–6.95) were obtained for TPC, FC, ABTS and DPPH. Suitable values of Rv2 (0.91–0.92) and RPD (3.75–3.84) were obtained for TC and AC.
RESUMEN
Se caracterizaron treinta muestras de vinos mexicanos Cabernet Sauvignon procedentes de 5 regiones vitivinícolas, 19 bodegas y vendimia entre 2004–2012 con respecto al contenido de compuestos fenólicos totales (TPC), antocianinas totales (AC), taninos (TC), flavonoides (FC) y capacidad antioxidante (ensayos ABTS y DPPH). Las muestras se procesaron mediante espectroscopia infrarroja media por transformada de Fourier (FT-MIR) acoplada a los algoritmos regresión por componentes principales (PCR) y regresión por mínimos cuadrados parciales (PLS1 y PLS2) para obtener un modelo quimiométrico optimizado para cada algoritmo. La región espectral seleccionada para cada modelo se encontró entre 1550-824 cm−1. El modelo PLS1 mostró la mejor capacidad predictiva para la predicción simultánea de los seis parámetros. Se obtuvieron excelentes valores de Rv2 (0.934-0.95) y RPD (4.28–6.95) para TPC, FC, ABTS y DPPH. Por otro lado, se obtuvieron valores aceptables de Rv2 (0.91–0.92) y RPD (3.75–3.84) para TC y AC.
1. Introduction
Wine is a complex beverage from a chemical point of view, being composed of water, alcohol and contains more than 500 compounds, some originating from the grapes and some metabolic by-products of yeast activity during fermentation (Soleas, Diamandis, & Goldberg, Citation1997). Ethanol is the main by-product, but since wine’s elaboration incorporates the seeds and skin of the grapes, both with high concentrations of bioactive compounds, red wine is also rich in polyphenolics. Polyphenols contributed either the grape pigmentation and red colour or the flavour (Ribéreau-Gayon, Glories, Maujean, & Dubordieu, Citation2006).
Polyphenols have particular importance due to their antioxidant properties (Dávalos & Lasunción, Citation2009). The moderate red wine consumption (100–200 mL/day) reduces the risk of cardiovascular diseases, neurodegenerative illness, some symptoms of arthritis and some cancers (Jackson, Citation2016; Kang, Shin, Lee, & Lee, Citation2011).
One of the growing wine producer countries is Mexico. Nowadays, it is among the most prominent wine-producing countries in America (Medina-Albaladejo, Martínez-Carrión, & Ramón-Muñoz, Citation2014). The main wine-growing regions are in Mexican’s north, and Cabernet Sauvignon grape variety is the most cultivated (SAGARPA, Secretaría de Agricultura, Ganadería, Desarrollo Rural, Pesca y Alimentación, Citation2011). According to the literature, there is little information about Mexican wines, despite its growth in the global wine market.
Some analytical methods are available for identifying the bioactive compounds in wine, but gas chromatography and high-performance liquid chromatography are the most widely used (Porgali & Büyüktuncel, Citation2012). However, techniques of vibrational spectroscopy have gained popularity (Bevilacqua, Bucci, Materazzi, & Marini, Citation2013) due to their features: speed, reliability, effortlessness, environmentally friendly, requires minimal or no sample treatment and suitability for routine analyses because of its capacity to process large samples in a short time. Thus, they are an alternative to conventional chemical analysis. The advantage of using infrared spectra is that it represents the combined absorbance of all components in the wine matrix, rather than merely the composition of a few chemical compounds (Bevin, Fergusson, Perry, Janik, & Cozzolino, Citation2006). Besides, the coupling with multivariate techniques enables to develop predictive models, which allow quantitative information of sample composition, and this is known as chemometric analysis and is a powerful analysis tool.
Fourier transform mid-infrared (FT-MIR) spectroscopy coupled to chemometrics has been applied in the analysis of a wide range of enological parameters in the finished product (e.g. Ozturk, Yucesoy, & Ozen, Citation2012; Silva, Feliciano, Boas, & Bronze, Citation2014) or during winemaking (e.g. Di Egidio, Sinelli, Giovanelli, Moles, & Casiraghi, Citation2010; Fragoso, Aceña, Guasch, Mestres, & Busto, Citation2011; Preserova, Ranc, Milde, Kubistova, & Stavek, Citation2015). The PLS1 algorithm is commonly used to model properties, and the PLS2 or PCR algorithms are not tested.
In the wine industry, the routine analysis is focused on analysing chemical components such as alcohol, sugars and acidity (Cozzolino, Citation2015). However, the investigation and prediction of bioactive compounds content and the antioxidant capacity are necessary to characterise the vinification process, know the sensorial attributes and recognise wine quality to predict its protector effect which is a significant aspect for consumers.
The scientific literature reports few studies of the prediction of antioxidant capacity in wine by FT-MIR (Patz, Blieke, Ristow, & Dietrich, Citation2004; Preserova, Ranc, Milde, Vladimira, & Stavek, Citation2015; Silva et al., Citation2014; Versari, Parpinello, Scazzina, & Del Rio, Citation2010). To our knowledge, there is no PLS or PCR models base on FT-MIR applied to the simultaneous prediction of wine antioxidant capacity by ABTS and DPPH assays. These methods differ in their principles, and they are complementary.
The first aim of the research was to obtain a characterisation of total phenolic compounds (TPC), total anthocyanins content (AC), tannins content (TC), flavonoids content (FC) and antioxidant capacity (ABTS and DPPH assays) of Mexican Cabernet Sauvignon wines produced in the wine-growing region of Mexico which is an emergent wine sector on the global market. The second aim was to develop chemometric models based on data obtained by FT-MIR spectroscopy and PLS1, PLS2 and PCR algorithms for simultaneous prediction of phenolic compounds (TPC, AC, TC and FC) and antioxidant capacity of red wine variety Cabernet Sauvignon produced in Mexico, to obtain a fast, reliable and easy methodology.
2. Materials and methods
2.1 Samples
Thirty commercial red wine varieties Cabernet Sauvignon produced in Mexico (Aguascalientes, Aguascalientes, n = 1; Encinillas, Chihuahua, n = 1; Ensenada, Baja California, n = 23; Parras, Coahuila, n = 3; and Tecate, Baja California, n = 2) were collected in commercial wineries in Mexico City. The samples were originated from 18 Mexican brand producers and belong to different vintages (2001, 2005, 2006, 2007, 2008, 2009, 2010, 2011, 2012, 2013 and 2014) to consider the extensive and natural variability of red wines when the chemometric model is built of the calibration models. All samples were stored in a dark room, at room temperature until analysis. The chemicals used in the experiments were analytical grade.
2.2 Bioactive compounds determination
The 30 red wine samples were analysed in triplicate by spectrophotometric assays (Jenway 7305, UK). The total phenol content (TPC) was determined based on Singleton and Rossi (Citation1965) method and was calculated as milligrams equivalents of gallic acid per litre (mg GAE/L). Total AC was measured using bisulphite bleaching method (Ribéreau-Gayon et al., Citation2006) and was expressed as mg malvidin-3-glucoside/L. The FC was determined based on Kramling and Singleton (Citation1969) method and was calculated as milligrams equivalents of gallic acid per litre (mg GAE/L). The TC was measured according to Ribéreau-Gayon and Stonestreet method (Ribéreau-Gayon et al., Citation2006) and was expressed as g cyanidin/L wine.
2.3 Antioxidant capacity determination
The antioxidant capacity of the wine samples was analysed using DPPH radical (1,1- diphenyl-2-picrylhydrazyl; Brand-Williams, Cuvelier, & Berset, Citation1995) and ABTS+ radical cation (2,2ʹazinobis-(3-ethylbenzothiazoline-6-sulphonic acid; Re et al., Citation1999). The antioxidant capacity was expressed as millimoles equivalents of Trolox per litre (mmol TE/L). The samples were analysed in triplicate.
2.4 Statistical analysis
Values obtained for TPC, AC, TC, FC, DPPH and ABTS were analysed using one-way ANOVA with Tukey’s test (p < 0.05) and coefficient of variation (CV) to confirm the variability present in the data set which is necessary for a proper calibration. Moreover, principal component analysis (PCA) was performed for data set reference values before chemometric models were developed. PCA allows to examine sample groupings and detects outliers. Minitab Statistical Software version 16.1.0 (State College, PA, USA) was used for the analyses.
2.5 FT-MIR spectroscopic analysis
The wine samples were scanned using a 1600 FT-MIR spectrometer (PerkinElmer, MA, USA) within the range of 4000–550 cm−1 at a resolution of 4 cm−1, and the average of 64 scans was considered. Measurements were carried out with an attenuated total reflectance (ATR) accessory with a zinc selenide crystal. An aliquot of 1.5 mL of red wine was placed onto the ATR crystal with a Pasteur pipette, avoiding the bubble formation, and covering with a press accessory to prevent the evaporation of the sample. A background air spectrum was subtracted from each wine sample spectrum. Samples were analysed in triplicate and averaged.
2.6 Quantitative models
The chemometric analysis was performed using partial least squares regression (PLS1 and PLS2) and principal components regression (PCR) algorithms of Unscrambler software v9.2 (CAMO Process AS, Oslo, Norway). Each one was used to correlate spectral data with the data set of bioactive compounds and antioxidant capacity values of wine samples. The regression models were created with 30 averaged FT-MIR spectra. The samples for calibration and validation sets were chosen before the analysis of principal component 2D scatterplot defined by the two first PCA. When all samples were placed in a 2D space, the 20% was randomly selected for the validation set (6 samples). The selected samples were well distributed in that 2D space. The remaining 80% (24 samples) was used for the calibration set.
Different spectral pre-treatments were used to improve the accuracy of the chemometric models. The pre-treatments applied were Savitzky–Golay filter with until 19 smoothing points to diminish the random noise in the spectral signal. The correction of offset to avoid changes in the baseline. The first and second order derivatives with until 13 smoothing points to increase spectral differences; and multiplicative scatter correction (MSC) or standard normal variate (SNV), which eliminate or minimise interferences caused by scattering effects. Furthermore, the correct choice of the spectral region was a necessary step.
The standard error of calibration (SEC) and the coefficient of determination in calibration (Rc2) were obtained to evaluate calibration step. The standard error of prediction (SEP), the coefficient of determination in validation (Rv2), Mahalanobis total distance and residual error were obtained with the Unscrambler software v9.2 to estimate the predictive capacity of the model. Additionally, in validation step, the residual predictive deviation (RPD) was calculated as the ratio between the standard deviation of the population (SD) and the SEP, and the percentage of relative difference (%RD) was obtained by Eq. (1):
The closest to minimum SEP for each parameter at the lowest number of factors was used as a criterion for selecting the optimal number of factors (in PLS) or components (in PCR) for each parameter. The selection is necessary to avoid overfitting or underfitting of the model, which is the inclusion of unnecessary data or the lack of variance in the data, respectively.
3. Results and discussion
3.1 Bioactive compounds
summarises the analytical values of bioactive compounds and antioxidant capacity of Mexican Cabernet Sauvignon wines, also shows the wine region, winery’s number and vintage of each sample. The samples in each graph are ordered from the highest to the lowest values of each analysed parameter.
Figure 1. Bioactive compounds and antioxidant capacity values of Mexican Cabernet Sauvignon wines: a) TPC, b) AC, c) TC, d) FC, e) ABTS assay, f) DPPH assay. Results are plotted as mean ± standard deviation (n = 3). Different letters in the same parameter indicate significant differences (p < 0.05). The wine’s code indicates: The abbreviation of wine regions (A = Aguascalientes, Aguascalientes; C = Parras, Coahuila, E = Ensenada, Baja California, H = Encinillas, Chihuahua, T = Tecate, Baja California), the winery number and vintage (last two digits).
Figura 1. Compuestos bioactivos y valores de capacidad antioxidante de vinos mexicanos Cabernet Sauvignon: A) TPC, b) AC, c) TC, d) FC, e) ABTS, f) DPPH. Los resultados se representan como media ± desviación estándar (n = 3). Letras diferentes en el mismo parámetro indican diferencias significativas (p < 0.05). El código del vino indica: la abreviatura de las regiones vitivinícolas (A: Aguascalientes, Aguascalientes; C: Parras, Coahuila; E: Ensenada, Baja California; H: Encinillas, Chihuahua; T: Tecate, Baja California), el número de la bodega, y la vendimia (los dos últimos dígitos).
By making an overall analysis, it was observed that the wines from Chihuahua (H) and Coahuila (C) are between samples with high TPC, AC, TC and FC values (). For all parameters, the wines showed a slightly significant difference between samples for each parameter, although the CV ranges from 13.65 to 57.77. The exception was the FC parameter with a highly significant difference between wine samples. Besides, taking into account the vintage, it was not found a diminish of TPC or TC values through the time. However, some oldest wines showed low values of AC and FC.
In the present investigation, the TPC ranged from 803 to 1754 mg GAE/L, and the average value was 1254 mg GAE/L (). The TPC shows a CV of 16.0%. These results are comparable with previously published results for Cabernet Sauvignon wines from Brazilian, Italian and Spanish wines ranged from 252 to 2143.3 mg GAE/L (Fragoso et al., Citation2011; Granato, Katayama, & Castro, Citation2010; Pellegrini et al., Citation2000). Higher values have also been reported in the literature for Cabernet Sauvignon red wine (Chira, Pacella, Jourdes, & Teissedre, Citation2011; Hosu, Vasile-Mircea, & Cimpoiu, Citation2014). The variation in concentrations of phenolic compounds in wine occurred due to differences in the quality of grape cultivar, grape maturity at harvest, growing season, soil type, environmental and climatic conditions, and geographic locations, and also for the duration of skin contact before or during fermentation, the type of fining, the duration of ageing, among other factors (Jackson, Citation2016).
The AC of wines showed the highest CV (57.77%). It ranged from 4.96 to 56.88 mg malvidin-3-glucoside/L, and the average value was 18.24 mg/L (). The values were lower compared to the reported values in the current literature for Cabernet Sauvignon red wine which ranged from 15.31 to 377 mg malvidin-3-glucoside/L for French, Romanian and Spain wines (Chira et al., Citation2011; Fragoso et al., Citation2011; Hosu et al., Citation2014).
The differences may be due to the conditions used during the maceration phase in winemaking. The extended macerations allow wines with high colour, rich in anthocyanins and tannins, due to the ripeness of the grape and ambient conditions during the wine growing (Aleixandre, Citation2003), and due to progressive transformation into more stable oligomeric and polymeric pigments during ageing (Monagas, Gómez-Cordovés, & Bartolomé, Citation2006). The TC of wines ranged from 1.93 to 4.74 g cyanidin/L, and the average value was 3.32 g cyanidin/L (). The TC shows a CV of 20.97%. These results are higher than those reported by others authors for Cabernet Sauvignon red wine, which concentration ranged from 0.96 to 2.34 g cyanidin/L for Spain, French and Romanian wines (Chira et al., Citation2011; Hosu et al., Citation2014; Monagas et al., Citation2006; Soto-Vázquez, Río-Segade, & Orriols-Fernández, Citation2010).
The variation in the TC may also be due to the conditions under which the maceration takes place since this process has a significant effect on the relative proportion of tannins that pass from the grape to the wine (Favre, Charamelo, & González-Neves, Citation2013). Another possible explanation for the variation in tannin concentration is the use of oenological tannins. They are used to facilitate the clarification of wines and musts (International Oenological Codex, Citation2015). For instance, the high values for some Spain wine are due to tannins addition (Soto-Vázquez et al., Citation2010).
The FC in samples ranged from 115.22 to 647.41 mg GAE/L, and the average value was 412.14 mg GAE/L (). The FC values show a CV of 28.41%. In current literature, a higher FC has been reported for Cabernet Sauvignon wines. For Brazilian, Serbian, French, American and Croatian wines, the content ranged from 1335 to 2432 mg GAE/L (Atanacković, Citation2013; Lima et al., Citation2011).
The differences in grape composition or different winemaking techniques probably modify the FC (Lima et al., Citation2011). Moreover, the lower flavonoids concentration in some samples could be due to progressive anthocyanin-flavanol condensation reactions during ageing (Monagas et al., Citation2006). Thus, aged wines exhibited lower flavonoids and anthocyanins contents. Similar results were reported by Granato et al. (Citation2010).
3.2 Antioxidant capacity
The evaluation of the antioxidant capacity of wine is an indirect index of phenolic compounds present in wine (Fotakis, Christodouleas, Zervou, Papadopoulos, & Calokerinos, Citation2012). No method fully reflects all the antioxidants of a sample. Therefore, two methodologies were used in the present study to measure the antioxidant capacity of a complex system such as wine.
In general, it was observed that the wines from Chihuahua (H) and Coahuila (C) have high antioxidant capacity values (). There are not high statistical differences among wine samples. However, a CV of 13.65 and 20.47% was obtained for ABTS and DPPH values, respectively, and the variation was enough for the development of the chemometric models. Moreover, the ageing of the wine was not associated with lower values of antioxidant capacity ().
In the present work, the antioxidant capacity with ABTS method ranged from 29.12 to 52.67 mmol TE/L, with an average value of 40.33 mmol TE/L (). Other authors have been reported different values (from 1.08 to 30.9 mmol TE/L) for Romanian, Italian and German wines (Hosu et al., Citation2014; Patz et al., Citation2004; Pellegrini et al., Citation2000).
Additionally, the antioxidant capacity with DPPH method ranged from 6.93 to 13.76 mmol TE/L, with an average value of 10.92 mmol TE/L (). Similar values have been reported for California, South Australia, Chile, Bulgaria, Italy and Macedonian wines, which values ranged from 5.71 to 11.2 mmol TE/L (Ivanova-Petropulus et al., Citation2015; Van Leeuw, Kevers, Pincemail, Defraigne, & Dommes, Citation2014). However, higher values have been reported for Brazilian, Argentine and Chilean wines (Granato et al., Citation2010).
Table 1. Calibration results for chemometric models based on FT-MIR spectroscopy.
Tabla 1. Resultados de calibración para los modelos quimiométricos basados en espectroscopia FT-MIR.
The ABTS and DPPH results suggested that Mexican wines had comparable antioxidant capacity with wines from others wine regions.
3.3 PCA and correlation analysis
The TPC, AC, TC, FC, DPPH and ABTS results were subjected to the unsupervised PCA pattern recognition method to investigate the presence of outliers and the formation of clusters (). The information included in the data set showed that three principal components explained 85.4% of the variability of the samples (62.9% PC1, 14% PC2 and 8.5% PC3). The principal component 3D scatterplot () indicated the distribution of the 30 wine samples along the third principal components. The variables vintage, wine region and winery had no clustering effect on the data set as can be seen in for the wine region.
Figure 2. a) Principal components 3D scatterplot of 30 wines grouped by wine region and winery, letters and numbers are codes as in ) Principal components loading plot.
Figura 2. a) Gráfica de dispersión 3D de las puntuaciones del análisis de componentes principales de treinta vinos agrupados por región vitivinícola y bodega. Letras y números son códigos como en la ) Gráfica de cargas del análisis de componentes principales.
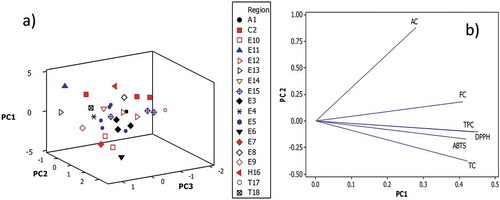
Additionally, the principal components loading plot () illustrates the correlation between the variables. The PCA analysis showed a high correlation among DPPH, ABTS TPC and TC. The last statement is in agreement with the high Pearson correlation coefficients among ABTS and DPPH (r = 0.744). The coefficients were also good between TPC and TC (r = 0.73). In the same way, a slightly higher correlation was obtained between DPPH and TPC, TC or FC (0.64 < r < 0.67) than ABTS and the same bioactive compounds (0.50 < r < 0.61). Fotakis et al. (Citation2012) also report similar coefficients for TPC regarding ABTS or DPPH values. Moreover, a weak correlation between AC regarding TPC (0.39) and antioxidant capacity measured by DPPH (r = 0.39) or ABTS (r = 0.34) was observed. This last result is in agreement with Li, Wang, Li, Li, and Wang (Citation2009).
3.4 FT-MIR spectra
The chemical composition of red wines can be correlated with the FT-MIR spectra of samples. The compounds have functional groups that absorb in the mid-infrared region and produce particular vibrational signals of molecular bonds. The resulting spectrum is a fingerprint of the wine.
depicts the raw FT-MIR spectra of Cabernet Sauvignon wines in the region of the infrared medium spectrum (4000–850 cm−1). In the FT-MIR, the broad and strong band between 3640 and 3200 cm−1 are due to overlapping of O-H stretches vibrations for water, alcohol and phenols in the sample (Larkin, Citation2011). The bands at 2939 and 2923 cm−1 are due to methyl (-CH3) and methylene (-CH2-) asymmetric stretching, respectively, present in the substitutions of the aromatic rings (Socrates, Citation2001). The peak observed at 1630–1640 cm−1 corresponds to the C = C stretch vibration (Socrates, Citation2001), that is a characteristic bond of flavonoids and non-flavonoids. The band near 1640 cm−1 corresponds to O-H group deformation (Larkin, Citation2011). The absorption at 1448–1444 cm−1 and 1376–1373 cm−1 corresponds to asymmetric and symmetric in-plane bending of -CH3, respectively (Silva et al., Citation2014). The bands observed in the region 1410–1310 cm−1 correspond to O-H deformation and C-O stretching of phenols (Socrates, Citation2001). The bands in the region 1330–1210 cm−1 and 960–850 cm−1 correspond to the C-O stretching and O-H out-of-plane torsions of the carboxylic acids (Coates, Citation2006), which are present in red wine such as coumaric, ferulic, cinnamic and caffeic acids. The absorption at 1410–1310 cm−1 has been assigned to O-H bending in phenols (Coates, Citation2006). The peak at 1270–1290 cm−1 is due to the = C-O-C asymmetric stretching (Socrates, Citation2001) and C-O stretching vibration of the pyran-derived ring structure of flavonoid-based tannins (Edelmann & Lendl, Citation2002). Strong absorptions are also observed in the region 1000–1095 cm−1 due to C-O stretching vibrations of polysaccharides, also at 900–835 cm−1 region, the absorption peaks of α and β pyranose compounds are identified (Socrates, Citation2001), such as those present in glycosylated anthocyanins such as malvidin-3-glucoside.
Figure 3. FT-MIR spectra in the region of 4000–850 cm−1 of Mexican Cabernet Sauvignon wines.
Figura 3. Espectros FT-MIR en la región de 4000–850 cm−1 de vinos mexicanos Cabernet Sauvignon.
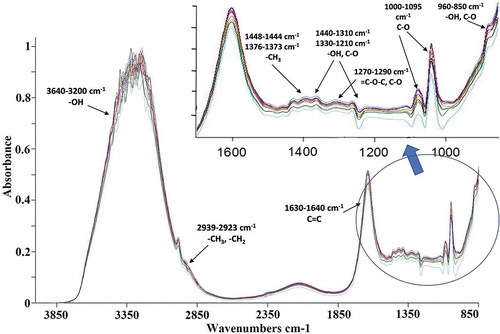
In the FTIR spectra, many bands that have been attributed to the same functional group of components in the complex matrix. Thus, a combination of the spectra and chemometric is required to predict the bioactive compounds’ concentrations.
3.5 Chemometric models
Three optimised chemometric models were obtained with the algorithms PLS1, PLS2 and PCR. They were used to associate TPC, AC, TC, FC and antioxidant capacity (ABTS and DPPH) of Cabernet Sauvignon wines with their FT-MIR spectra. The correlation allows to find components or factors from the original correlated spectroscopy data and uses only these linear combinations in the regression equation (Naes, Isaksson, Fearn, & Davies, Citation2004).
Different pre-treatments were applied to the models to reduce the noise and to intensify the signals of interest for the samples. The selected pre-treatments applied in the three models were smoothing of 13 points, SNV normalisation and second derivative with 9 points. The region used for the models was from 1550 to 824 cm−1. This region showed a suitable correlation between absorbance and concentration data to avoid X-variable outliers. Neither regions with high absorbance nor regions of very low absorbance are desirable, as they contribute to extremely high variation or may be considered to be only noise, respectively.
shows the optimal number of principal components for PCR or factors for PLS, the Rc2, the SEC and the SEP of the three optimised calibration models. Factors represent a new dimension with significant data that resume the original variables in the spectrum, and they are useful to explain a parameter of interest. According to , PLS1 and PLS2 models showed higher Rc2 values than PCR model in calibration data set. Values of Rc2 high to 0.9 suggest excellent quantitative information (Shenk & Westerhaus, Citation1996). For PLS1 and PLS2, lower SEC and SEP values were obtained, in comparison with PCR using the optimal number of factors. The SEC and SEP have the same unit as the reference value and provide an indication of the potential error in the regression; consequently, low values are desirable.
Thus, SEC and SEP values obtained by PLS1 model indicated a better calibration than PCR and PLS2 models. Moreover, the PLS1 model used fewer factors to predict, and then, a more robustness model is expected. For that reason, the PLS1 model was chosen as the better model, and the subsequent validation step was applied only for PLS1 model.
PLS1 and PLS2 are two different approaches for PLS. The first algorithm calibrates the properties one at a time and PLS2 calibrates all simultaneously, searching the maxima variance between analytic and spectral data. PCR algorithm also calibrates all at a time and selects components only according to the maxima variability in spectral data (Naes et al., Citation2004). PLS1 usually gives more accurate models. However, PLS2 provides models with similar predictive abilities to PLS1 when the dependent variables are strongly correlated (Pedro & Ferreira, Citation2007). The present work explored the prediction ability of PLS2 and PCR, but PLS1 showed the best calibration performance at less number of factors.
The validation set of 6 external samples was employed to know the performance of prediction models. The regression of predicted values versus the reference values was obtained for each parameter. shows the Rv2 and RPD values for the prediction of each parameter with PLS1 model. Excellent correlations (R2 > 0.91) between the reference and the predicted data were obtained for the six parameters (Shenk and Westerhaus (Citation1996); although the highest correlations were for TPC, FC, ABTS and DPPH.
Table 2. Validation results for the PLS1 model obtained using external validation.
Tabla 2. Resultados de validación para el modelo PLS1 obtenido mediante validación externa.
RPD values were used to standardise the predictive results of the model. RPD is a statistic widely used to compare calibrations, and it allows to obtain a fair comparison between SEP values with a different number of samples because SEP increases as the response interval of the parameter increases. An RPD value higher than 3.1 indicates a suitable calibration model for prediction purposes (Williams, Citation2001).
The RPD values of 6.95 and 6.03 for DPPH and FC, respectively, indicate that the PLS1 model is very good for the prediction of these parameters (). Besides, the values between 3.75 and 4.78 for TPC, ABTS, AC and TC are considered good for the prediction. It is worth mentioning that TC and AC showed the lowest RPD values.
Comparable results were found by Fragoso et al. (Citation2011) with lower RPD values for TC and AC respect to TPC values. This result could be explicated by the chemical resemblance of anthocyanins and tannins with other phenolic compounds (Fragoso et al., Citation2011). To use the same spectral region for all parameters compromised the accuracy of the prediction since the phenolic compounds have a very similar spectral response. A better in the model could be obtained with specific regions for TC and AC.
shows external samples of good correlation between predicted and reference values of each parameter. The % RD values for TPC and FC ranged from 0.06 to 1.88%, and for ABTS, DPPH, AC and TC ranged from 0.09 to 13.17%. The residual ratios were less than 3 for the six validation samples; this indicated that unknown samples were representative of the calibration set, based on the factors in the property model. The Mahalanobis total distance values were less than 1; this indicated that the unknown samples were properly classified by the model (PerkinElmer, Citation1991). Thus, the PLS1 model proved to be a rapid method for the simultaneous prediction of six important parameters in red wines.
Table 3. Comparative results of six external samples quantify by reference methods and PLS1 model based on FT-MIR spectroscopy.
Tabla 3. Resultados comparativos de seis muestras externas cuantificadas por los métodos de referencia y el modelo PLS1 basado en espectroscopia FT-MIR.
There are previous studies which had been developed chemometric models couple with FT-MIR spectroscopy for prediction of sugars, alcohols, organic acids or physicochemical parameters of wine (Di Egidio et al., Citation2010; Ozturk et al., Citation2012; Patz et al., Citation2004; Versari et al., Citation2010). Satisfactory predictions had been obtained for these models, even comparable with official wine methods (Patz et al., Citation2004).
Nevertheless, less satisfactory calibrations had been reported for wine’s components in low concentration and some studies have addressed this problem (Di Egidio et al., Citation2010; Fernandez & Agosin, Citation2007; Fragoso et al., Citation2011; Laghi, Versari, Parpinello, Nakaji, & Boulton, Citation2011; Ozturk et al., Citation2012). In general, in those studies, TPC yielded excellent and FC good predictions. However, AC and TC showed low correlations. The present work is in agreement with these findings. The last studies had been considered the fingerprint region as the best option for predictions, although Fernández & Agosin (Citation2007) suggested the full range of 4000–650 cm−1 for improved TC prediction. In the present work, a broad spectral range was tested, and TC prediction was not improved. Future works are required to improve the accuracy of AC and TC predictions.
As far as antioxidant capacity, few chemometric model based on FT-MIR had been developed. Presereova et al. (Citation2015) and Versari et al. (Citation2010) predicted antioxidant capacity using ferric reducing-antioxidant (FRAP) assay, and they reported R2 of cross-validation of 0.88 and 0.85, respectively. Silva et al. (Citation2014) also predicted antioxidant capacity both as FRAP and as % inhibition of DPPH, and they reported R2 of cross-validation of 0.383 and 0.367, respectively, and rough estimates for DPPH and FRAP antioxidant capacities, especially for FRAP. Finally, Patz et al. (Citation2004) predicted antioxidant capacity based on decolourisation of ABT+ radical, and they reported a R2 of 0.9204.
The present work tested both DPPH and ABTS assays to improve prediction of antioxidant capacity, and the result was satisfactory since DPPH and ABTS predictions showed Rv2 higher than 0.93 and RPD values higher than three which indicate good prediction models. It is worth mentioning that, to our knowledge, no previous published studies in wine had modelled simultaneously DPPH and ABTS assays using FT-MIR and PLS algorithm.
The prediction of antioxidant capacity is of paramount importance since it is a way to estimate the presence of phenolic compounds with radical scavenging activity due to polyphenols from red wine have been reported to exert potent antioxidant effects (Dávalos & Lasunción, Citation2009). The last statement is in agreement with the correlation between antioxidant capacity and TPC found in the present work.
4. Conclusions
The present study indicates an overview of the Mexican Cabernet Sauvignon wines’ composition of main bioactive compounds and antioxidant capacity. A high correlation among DPPH, ABTS, TPC and TC was observed in oppose to the weak correlation between AC and TPC, DPPH or ABTS. The TPC values were comparable with the reported in the current literature, but lower AC and FC values and higher TC values were observed respect previously published results.
The use of the PLS1 algorithm, instead of PLS2 and PCR algorithm, shows a more satisfactory model for the prediction of Cabernet Sauvignon wine’s properties. The statistical results demonstrated that PLS1 model was suitable to simultaneous prediction of TPC, AC, TC, FC and antioxidant capacity by ABTS and DPPH methods. Excellent predictions of TPC, FC, ABTS and DPPH were provided, and a good prediction of AC and TC values was obtained. The proposed model is a convenient and reliable instrument for quality control or authenticity studies when a considerable number of samples must be analysed.
Acknowledgements
Financial support from the Consejo Nacional de Ciencia y Tecnología (CONACyT) and the Secretaría de Estudios de Posgrado e Investigación del Instituto Politécnico Nacional de México (SIP-IPN) is greatly appreciated.
Disclosure statement
No potential conflict of interest was reported by the authors.
Additional information
Funding
References
- Aleixandre, J. (2003). La cultura del vino, cata y degustación [Wine culture and tasting] (pp. 361). Valencia, ES: Universitat Politecnica de Valencia, Servicio de publicaciones.
- Atanacković, M. (2013). Analysis of phenolic content and antioxidative capacity of red wines from Serbia. In L. Č. Popović, M. Vidaković, & D. S. Kostić (Eds.), Resources of Danubian Región: The possibility of cooperation and utilization (pp. 10–16). Belgrade, RS: Humboldt-Club Serbien.
- Bevilacqua, M., Bucci, R., Materazzi, S., & Marini, F. (2013). Application of near infrared (NIR) spectroscopy coupled to chemometrics for dried egg-pasta characterization and egg content quantification. Food Chemistry, 140(4), 726–734. doi:10.1016/j.foodchem.2012.11.018
- Bevin, C. J., Fergusson, A. J., Perry, W. B., Janik, L. J., & Cozzolino, D. (2006). Development of a rapid “fingerprinting” system for wine authenticity by mid-infrared spectroscopy. Journal of Agricultural and Food Chemistry, 54(26), 9713–9718. doi:10.1021/jf062265o
- Brand-Williams, W., Cuvelier, M. E., & Berset, C. (1995). Use of a free radical method to evaluate antioxidant activity. LWT-Food Science and Technology, 28(1), 25–30. doi:10.1016/S0023-6438(95)80008-5
- Chira, K., Pacella, N., Jourdes, M., & Teissedre, P. L. (2011). Chemical and sensory evaluation of Bordeaux wines (Cabernet-Sauvignon and Merlot) and correlation wine age. Food Chemistry, 126(4), 1971–1977. doi:10.1016/j.foodchem.2010.12.056
- Coates, J. (2006). Interpretation of infrared spectra: A practical approach. In R. A. Meyers (Ed.), Encyclopedia of analytical chemistry (pp. 1–23). Chichester, UK: John Wiley and Sons.
- Cozzolino, D. (2015). Sample presentation, sources of error and future perspectives on the application of vibrational spectroscopy in the wine industry. Journal of the Science of Food and Agriculture, 95, 861–868. doi:10.1002/jsfa.6733
- Dávalos, A., & Lasunción, M. A. (2009). Health-promoting effects of wine phenolics. In M. V. Moreno-Arribas & M. C. Polo (Eds.), Wine chemistry and biochemistry (pp. 571–591). New York, NY: Springer.
- Di Egidio, V., Sinelli, N., Giovanelli, G., Moles, A., & Casiraghi, E. (2010). NIR and MIR spectroscopy as rapid methods to monitor red wine fermentation. European Food Research and Technology, 230(6), 947–955. doi:10.1007/s00217-010-1227-5
- Edelmann, A., & Lendl, B. (2002). Toward the optical tongue: Flow-through sensing of tannin-protein interactions based on FTIR spectroscopy. Journal of the American Chemical Society, 124(49), 14741–14747. doi:10.1021/ja026309v
- Favre, G., Charamelo, D., & González-Neves, G. (2013). Empleo de taninos enológicos y maceración prefermentativa en frío en una experiencia de elaboración de vinos Tannat [Use of oenological tannins and cold prefermentative maceration in a Tannat winemaking experiment]. Agrociencia Uruguay, 17(1), 65–73. Retrieved from http://www.scielo.edu.uy/scielo.php?script=sci_arttext&pid=S2301-15482013000100007.
- Fernandez, K., & Agosin, E. (2007). Quantitative analysis of red wine tannins using fourier-transform mid-infrared spectrometry. Journal of Agricultural and Food Chemistry, 55(18), 7294–7300. doi:10.1021/jf071193d
- Fotakis, C., Christodouleas, D., Zervou, M., Papadopoulos, K., & Calokerinos, A. C. (2012). Classification of wines based on different antioxidant responses to spectrophotometric analytical methods. Analytical Letters, 45(5–6), 581–591. doi:10.1080/00032719.2011.649456
- Fragoso, S., Aceña, L., Guasch, J., Mestres, M., & Busto, O. (2011). Quantification of phenolic compounds during red winemaking using FT-MIR spectroscopy and PLS-regression. Journal of Agricultural and Food Chemistry, 59(20), 10795–10802. doi:10.1021/jf201973e
- Granato, D., Katayama, F. C. U., & Castro, I. A. (2010). Assessing the association between phenolic compounds and the antioxidant activity of Brazilian red wines using chemometrics. LWT-Food Science and Technology, 43(10), 1542–1549. doi:10.1016/j.lwt.2010.05.031
- Hosu, A., Vasile-Mircea, C., & Cimpoiu, C. (2014). Analysis of total phenolic, flavonoids, anthocyanins and tannins content in Romanian red wines: Prediction of antioxidant activities and classification of wines using artificial neural networks. Food Chemistry, 150, 113–118. doi:10.1016/j.foodchem.2013.10.153
- International Oenological Codex. (2015). Oenological tannins. COEI-1-TANINS: 2015. OIV-Oeno 554–2015). Paris, FR: Organisation Internationale de la Vigne et du Vin (OIV).
- Ivanova-Petropulus, P. V., Hermosín-Gutierrez, I., Boros, B., Stefova, M., Stafilov, T., Vojnoski, B., … Kilár, F. (2015). Phenolic compounds and antioxidant activity of Macedonian red wines. Journal of Food Composition and Analysis, 41, 1–14. doi:10.1016/j.jfca.2015.01.002
- Jackson, R. S. (2016). Wines: Wine and health. In B. Caballero, P. M. Finglas, & F. Toldrá (Eds.), Encyclopedia of food and health (pp. 562–571). Oxford, UK: Academic Press.
- Kang, N. J., Shin, S. H., Lee, K. W., & Lee, H. J. (2011). Polyphenols as small molecular inhibitors of signaling cascades in carcinogenesis. Pharmacology and Therapeutics, 130(3), 310–324. doi:10.1016/j.pharmthera.2011.02.004
- Kramling, T. E., & Singleton, V. L. (1969). An estimate of the nonflavonoid phenols in wines. American Journal of Enology and Viticulture, 20, 86–92.
- Laghi, L., Versari, A., Parpinello, G. P., Nakaji, D. Y., & Boulton, R. B. (2011). FTIR spectroscopy and direct orthogonal signal correction preprocessing applied to selected phenolic compounds in red wines. Food Analytical Methods, 4(4), 619–625. doi:10.1007/s12161-011-9240-2
- Larkin, P. J. (2011). Infrared and Raman spectroscopy: Principles and spectral interpretation. Waltham, MA: Elsevier.
- Li, H., Wang, X., Li, Y., Li, P., & Wang, H. (2009). Polyphenolic compounds and antioxidant properties of selected China wines. Food Chemistry, 112(2), 454–460. doi:10.1016/j.foodchem.2008.05.111
- Lima, D. B. D., Agustini, B. C., Silva, E. G. D., Gaensly, F., Cordeiro, R. B., Fávero, M. L. D., … Bonfim, T. M. B. (2011). Evaluation of phenolic compounds content and in vitro antioxidant activity of red wines produced from Vitis labrusca grapes. Food Science and Technology, 31(3), 783–800. doi:10.1590/S0101-20612011000300038
- Medina-Albaladejo, F. J., Martínez-Carrión, J. M., & Ramón-Muñoz, J. M. (2014). The world wine market and the competitiveness of the southern hemisphere countries, 1961-2010. América Latina En La Historia Económica, 21(2), 40–83. Retrieved from http://www.scielo.org.mx/pdf/alhe/v21n2/v21n2a2.pdf.
- Monagas, M., Gómez-Cordovés, C., & Bartolomé, B. (2006). Evolution of the phenolic content of red wines from Vitis vinifera L. during ageing in bottle. Food Chemistry, 95(3), 405–412. doi:10.1016/j.foodchem.2005.01.004
- Naes, T., Isaksson, T., Fearn, T., & Davies, T. (2004). A user-friendly guide to Multivariate Calibration and Classification. Chichester, UK: NIR Publications.
- Ozturk, B., Yucesoy, D., & Ozen, B. (2012). Application of mid-infrared spectroscopy for the measurement of several quality parameters of alcoholic beverages, wine and raki. Food Analytical Methods, 5(6), 1435–1442. doi:10.1007/s12161-012-9397-3
- Patz, C. D., Blieke, A., Ristow, R., & Dietrich, H. (2004). Application of FT-MIR spectrometry in wine analysis. Analytica Chimica Acta, 513(1), 81–89. doi:10.1016/j.aca.2004.02.051
- Pedro, A. M., & Ferreira, M. M. (2007). Simultaneously calibrating solids, sugars and acidity of tomato products using PLS2 and NIR spectroscopy. Analytica Chimica Acta, 595(1), 221–227. doi:10.1016/j.aca.2007.03.036
- Pellegrini, N., Simonetti, P., Gardana, C., Brenna, O., Brighenti, F., & Pietta, P. (2000). Polyphenol content total antioxidant activity of vini novelli (young red wine). Journal of Agricultural and Food Chemistry, 48(3), 732–735. doi:10.1021/jf990251v
- PerkinElmer. (1991). Spectrum quant+ software for quantitative multicomponent analysis using chemometric methods: Tutorial. Waltham, MA: Author.
- Porgali, E., & Büyüktuncel, E. (2012). Determination of phenolic composition and antioxidant capacity of native red wines by high performance liquid chromatography and spectrophotometric methods. Food Research International, 45(1), 145–154. doi:10.1016/j.foodres.2011.10.025
- Preserova, J., Ranc, V., Milde, D., Kubistova, V., & Stavek, J. (2015). Study of phenolic profile and antioxidant activity in selected Moravian wines during winemaking process by FT-IR spectroscopy. Journal of Food Science and Technology, 52(10), 6405–6414. doi:10.1007/s13197-014-1644-8
- Re, R., Pellegrini, N., Proteggente, A., Pannala, A., Yang, M., & Rice-Evans, C. (1999). Antioxidant activity applying an improved ABTS radical cation decolorization assay. Free Radical Biology and Medicine, 26(9–10), 1231–1237. doi:10.1016/S0891-5849(98)00315-3
- Ribéreau-Gayon, P., Glories, Y., Maujean, A., & Dubordieu, D. (2006). Handbook of enology, 2nd ed. Chichester, UK: John Wiley and Sons.
- SAGARPA, Secretaría de Agricultura, Ganadería, Desarrollo Rural, Pesca y Alimentación. (2011). Estudio de demanda de uva de mesa Mexicana [Study of the demand for Mexican table grapes]. Retrieved from http://www.sagarpa.gob.mx/agronegocios/Documents/Estudios_promercado/ESTUDIO_UVA.pdf
- Shenk, J. S., & Westerhaus, M. O. (1996). Near infrared spectroscopy: The future waves. In: A. M. C. Davies & P. Williams (Eds.), Proceedings of the 7th International Conference on Near Infrared Spectroscopy (pp. 198–202). Montreal, CA: NIR Publications.
- Silva, S. D., Feliciano, R. P., Boas, L. V., & Bronze, M. R. (2014). Application of FTIR-ATR to Moscatel dessert wines for prediction of total phenolic and flavonoid contents and antioxidant capacity. Food Chemistry, 150, 489–493. doi:10.1016/j.foodchem.2013.11.028
- Singleton, V. L., & Rossi, J. A. (1965). Colorimetry of total phenolics with phosphomolybdic–Phosphotungstic acid reagents. American Journal of Enology and Viticulture, 16, 144–158.
- Socrates, G. (2001). Infrared and Raman characteristic group frequencies: Tables and charts. Chichester, UK: John Wiley and Sons.
- Soleas, G. J., Diamandis, E. P., & Goldberg, D. M. (1997). Wine as a biological fluid: History, production, and role in disease prevention. Journal of Clinical Laboratory Analysis, 11(5), 287–313. doi:10.1002/(SICI)1098-2825(1997)11:5<287::AID-JCLA6>3.0.CO;2-4
- Soto-Vázquez, E., Río-Segade, S., & Orriols-Fernández, I. (2010). Effect of the winemaking technique on phenolic composition and chromatic characteristics in young red wines. European Food Research Technology, 231(5), 789–802. doi:10.1007/s00217-010-1332-5
- Van Leeuw, R., Kevers, C., Pincemail, J., Defraigne, J., & Dommes, J. (2014). Antioxidant capacity and phenolic composition of red wines from various grape varieties: Specificity of pinot Noir. Journal of Food Composition and Analysis, 36(1–2), 40–50. doi:10.1016/j.jfca.2014.07.001
- Versari, A., Parpinello, G. P., Scazzina, F., & Del Rio, D. (2010). Prediction of total antioxidant capacity of red wine by Fourier transform infrared spectroscopy. Food Control, 21(5), 786–789. doi:10.1016/j.foodcont.2009.11.001
- Williams, P. C. (2001). Implementation of near-infrared technology. In P. C. Williams & K. H. Norris (Eds.), Near infrared technology in the agricultural and food industries (pp. 145–169). St. Paul, MN: American Association of Cereal Chemist.