Figures & data
Table 1. Cognitive processes of revised Bloom’s taxonomy (based on Anderson et al., Citation2001)
Table 2. The major types and subtypes of the knowledge dimension (based on Anderson et al., Citation2001)
Table 3. Numbers of obligatory learning outcomes prescribed by national curricula; the percentages between parentheses show the percentage of specific subjects in the total number of outcomes of the country (which is reported in the last row of the table)
Table 4. Percentages of complex learning outcomes requiring two or more types of knowledge
Table 5. Percentages of learning outcomes requiring the corresponding combination of type of knowledge (F, C, P and M) and cognitive process (RE, UN, AP, AN, EV and CR)
Figure 1. Percentages of learning outcomes requiring different types of knowledge
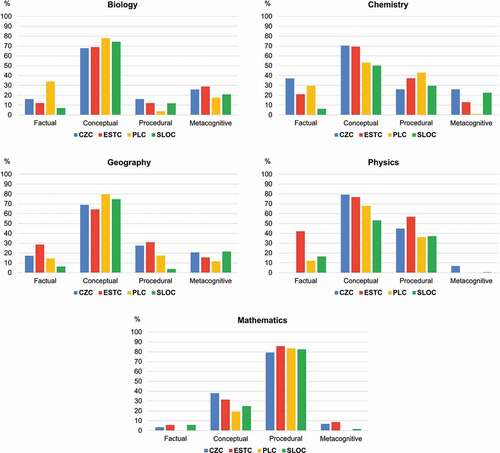
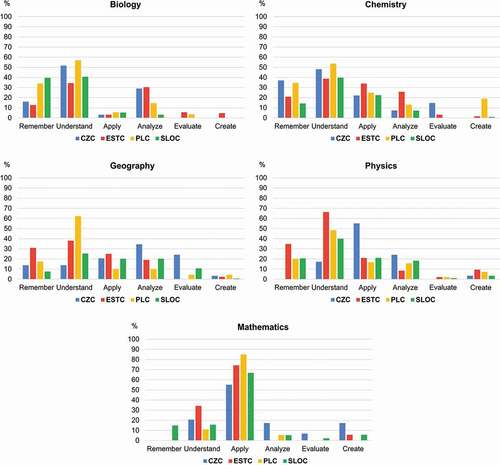
Figure 2. Percentages of learning outcomes requiring specific cognitive processes