
Figures & data
Table 1. Content of phenolics and flavonoids in different sweet corn varieties and percentage contribution of free and bound fractions to the total (means ± SD, n = 3).
Table 2. The content of ferulic acid and p-coumaric acid in different sweet corn varieties tested (μg/100g FW) (means ± SD, n = 3).
Table 3. IC50 values of DPPH scavenging activity of different sweet corn varieties determined (mg FW of sample /mL) (means ± SD, n = 3).1
Figure 1. Antioxidant activity of the free and bound phenolic fractions of 8 sweet corn varieties determined by the FRAP assay (n=3, means ± SD) FRAP: Ferric reducing antioxidant power. Means without a common letter are significantly different (p < 0.05).
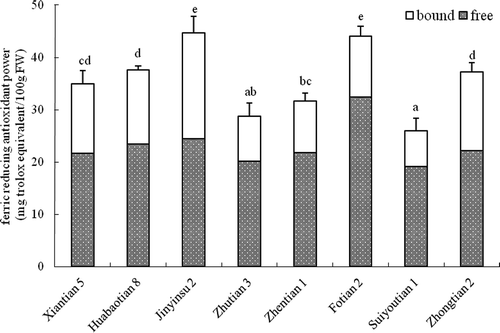
Figure 2. Antioxidant activity of the free and bound phenolic fractions of 8 sweet corn varieties determined by cellular antioxidant assay (CAA) (n=3, means ± SD). Means without a common letter are significantly different (p < 0.05).
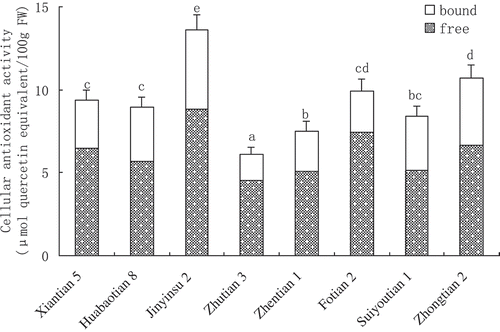
Table 4. Comparison of antioxidant quality of sweet corn extracts with the cellular antioxidant activity (CAA) assay (μmol quercetin equivalent/100 μmol phenolics).1