Figures & data
Table 1. Physicochemical properties of various honey samples.
Figure 1. Antioxidant properties of (a) DPPH free radical scavenging activity power (1/IC50); (b) ascorbic acid equivalent antioxidant capacity (AEAC); (c) ferric ion reducing antioxidant power (FRAP); and (d) total phenolic content (TPC) of various honey samples (T: Tualang; G: Gelam; P: Pineapple; B: Borneo; K: Kelulut; M: Manuka; CY: Commercial Y; CZ: Commercial Z). Values presented are mean ± standard error (n = 3 × N) with different letters indicate significant differences (P < 0.05).
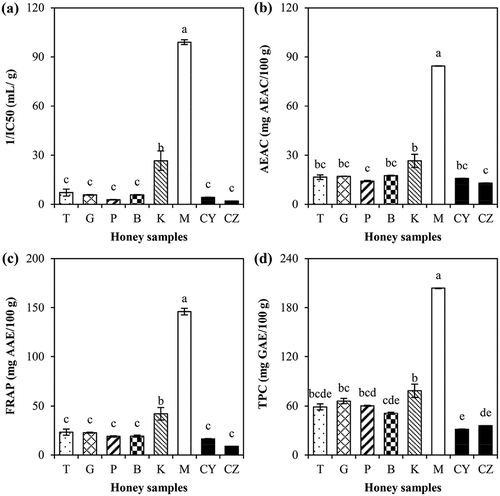
Table 2. Pearson correlation coefficients between various properties of honey.
Figure 2. Dendrogram of hierarchical cluster analysis based on physicochemical and antioxidant properties of various honey samples. The codes of A and B of raw honeys indicate the samples from different batches.

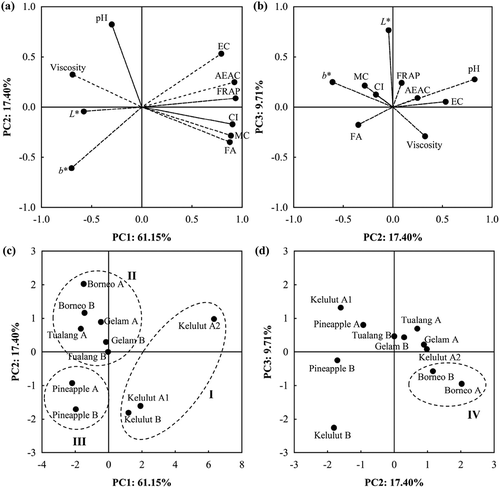
Figure 3. The (a) loading plot for PC2 versus PC1; (b) loading plot for PC3 versus PC2; (c) score plot for PC2 versus PC1; and (d) score plot for PC3 versus PC2 from PCA based on physicochemical and antioxidant properties for honey classification following its entomological origin (I: Heterotrigona itama; II: Apis dorsata and Apis cerana; III: Apis mellifera; IV: Apis cerana). The codes of A and B of raw honeys indicate the samples from different batches.