Figures & data
Table 1. Physical properties of fresh Barhi dates.
Table 2. Maturity quality index for Barhi fruit at five stages of maturity**.
Figure 1. The mean second derivative of absorbance in wave length range (285-1200 nm) (A); absorbance for chlorophyll wave length range (660-690 nm) (B); and absorbance for water content wave length range (940-980 nm) (C) for each Barhi fruits stage of maturity.
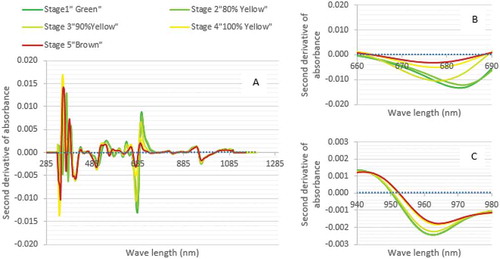
Figure 2. The mean second derivative of absorbance in wave length range (285–1200 nm) (A); absorbance for chlorophyll wave length range (660–690 nm) (B); and absorbance for water content wave length range (940–980 nm) (C) for each Barhi fruits stage of maturity.
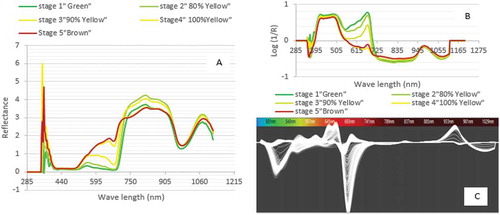
Table 3. PCR model for TSS, M.C, and b* in fresh Barhi dates.
Table 4. Main statistical spectra for TSS, MC%, and b* in Barhi fruit samples.
Figure 3. Predicted and measured values of TSS (A); b* (B); MC (C) models for Barhi fruit.