
Figures & data
Table 1. Independent variables and their levels for central composite design.
Table 2. Experimental design with the experimental and predicted values for EPS production.
Figure 1. Effect of different (a) medium, (b) carbon sources, and (c) nitrogen sources on EPS production.
Table 3. Significance of regression coefficients for EPS production.
Figure 2. 3D graph showing the effect of (a) lactose% and tryptophan %, (b) tryptophan % and pH, and (C) lactose % and pH on EPS production.
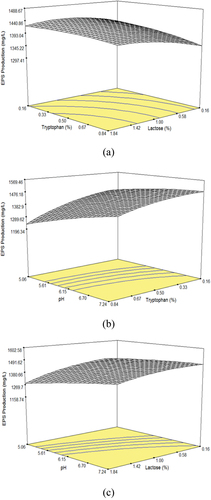
Table 4. Comparison of the experimental and predicted EPS production at optimum conditions.