
Figures & data
Figure 1. The sequencing process.
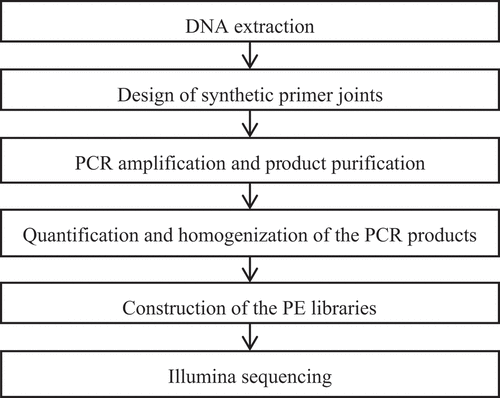
Table 1. Primer names and sequences.
Table 2. Materials for PCR amplification[Citation19].
Figure 2. Core species curve.
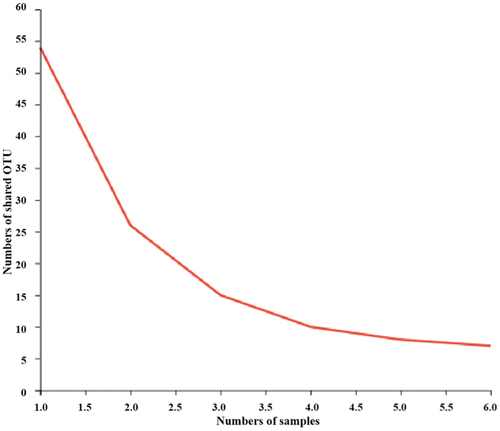
Figure 3. Shannon dilution curve. C: CK group; J: composite essential oil (EO) group; K: composite preservative group.
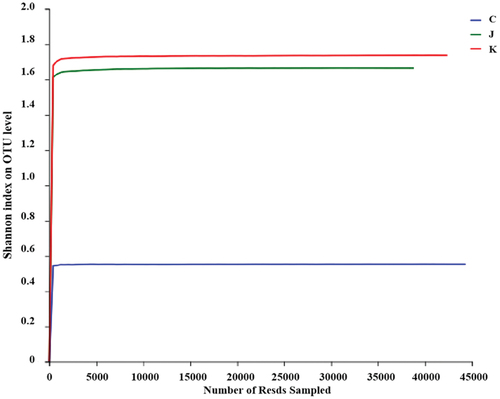
Figure 4. Rank-abundance curve. C: CK group; J: composite essential oil (EO) group; K: composite preservative group.
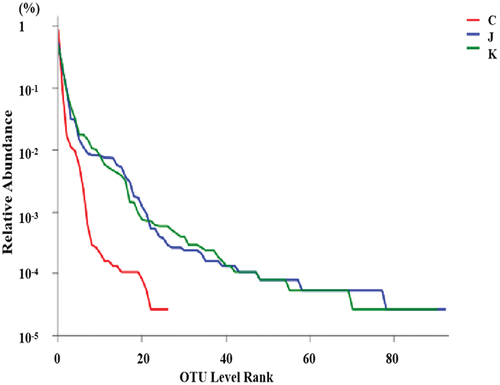
Figure 5. Visualization of Alpha diversity indices. a. Sobs index; b. Simpson index; c. Shannon index; d. Chao index. *p<.05; ***p<.01.
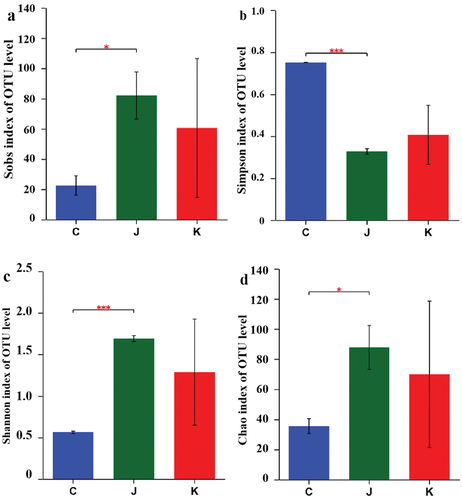
Figure 6. Principal component analysis (PCA) of the different treatment groups.
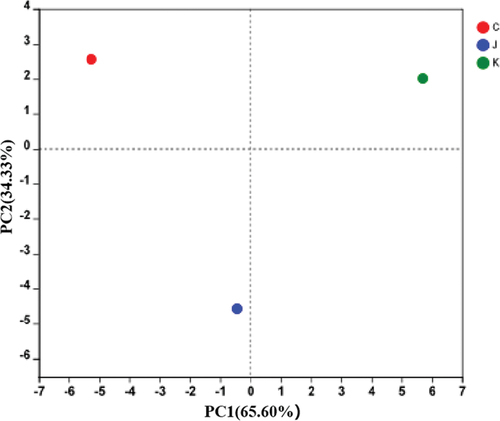
Figure 7. Venn diagram for the different treatment groups.
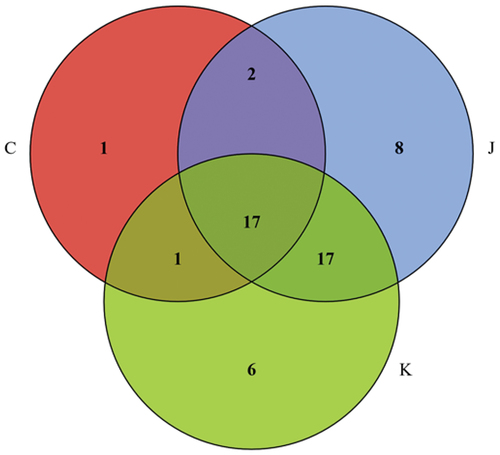
Figure 8. Bar graphs of the bacterial abundance in the microbiota of the different groups. Relative abundance is indicated at the family level.
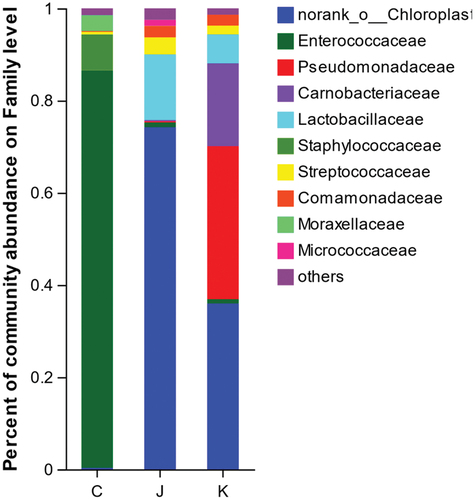
Figure 9. Pie charts showing the bacterial composition at the family level in the three groups. a, CK group; b, J group; c, K group.
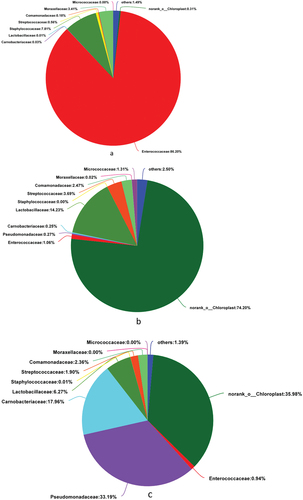
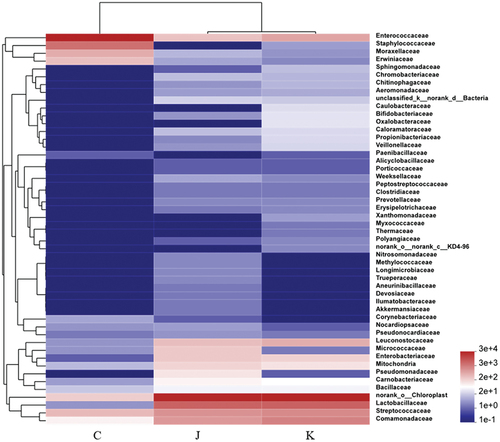
Figure 10. Heat map of bacterial species abundance at the family level. The color gradient is represented on the right side of the figure.
Data availability statement
The datasets generated for this study are available upon request from the corresponding author.’