Figures & data

Figure 1. Schematic of an apparatus for H-radical generation and transportation.
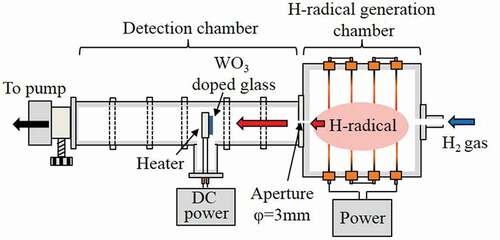
Figure 2. Schematic of (a) the apparatus used for reduction of SiCl4 and (b) the position of the quartz glasses.
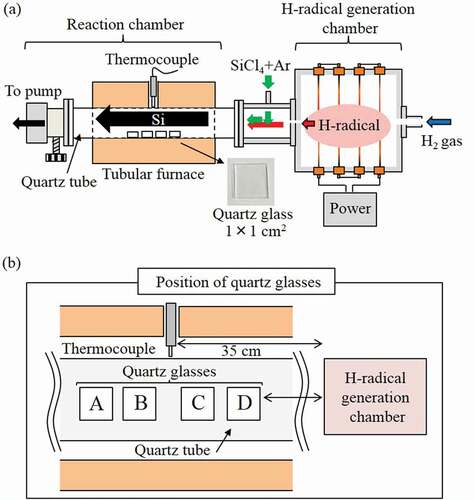
Table 1. Pressures of generation and detection chambers.
Figure 3. Dependence of the estimated H-radical density on (a) the pressures in the H-radical generation chamber and the detection chamber (the pressures represented in the graph are the pressures in the detection chamber), (b) currents applied to the W filaments (the temperatures indicated in the graph are estimated W filament temperatures), and (c) the transportation distance.
Figure 4. (a) Appearance of quartz tubes and quartz glasses after the reduction of SiCl4. (b) XRD pattern and (c) cross-sectional SEM image of the quartz glass placed at the position B during the experiment with an applied current of 30 A. The pressure in the H-radical generation chamber and the reaction chamber were ~3 kPa and ~1.8 kPa, respectively.
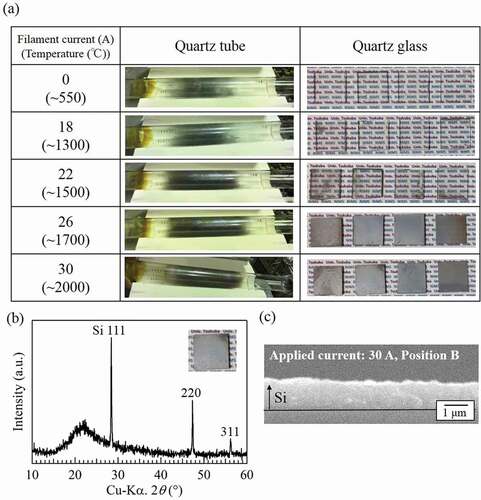
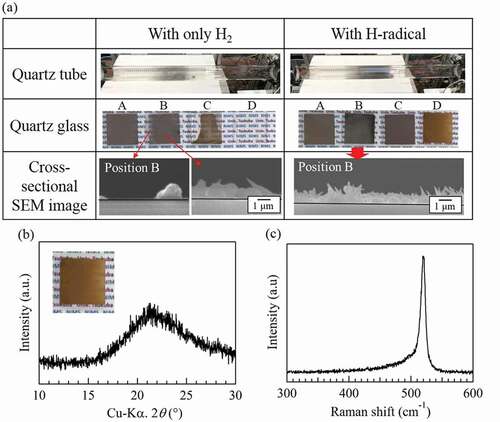
Figure 5. Appearances of quartz tubes and quartz glasses after the reduction of SiCl4 with H2 and H-radicals at 900°C, and cross-sectional SEM images of the quartz glasses placed at position B. The pressures in the H-radical generation chamber and the reaction chamber were ~105 kPa and ~101 kPa, respectively.
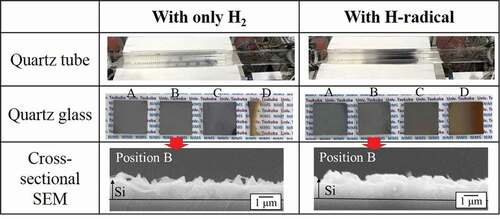
Figure 6. (a) Appearances of the quartz tubes and quartz glasses after the reduction of SiCl4 with H2 and H-radicals at 850°C, and cross-sectional SEM images of the quartz glasses placed at positions A–D. (b) XRD pattern and (c) Raman spectrum of the quartz glass placed at position D during the H-radical reduction of SiCl4. The pressures in the H-radical generation chamber and the reaction chamber were ~105 kPa and ~101 kPa, respectively.